

Editor’s note: Seeking Alpha is proud to welcome Macrotips Trading as a new contributor. It’s easy to become a Seeking Alpha contributor and earn money for your best investment ideas. Active contributors also get free access to SA Premium. Click here to find out more »
kasezo/iStock via Getty Images
With the Russia/Ukraine war spiking Crude oil prices to well over $100/bbl, it is no wonder that governments and investors around the world are increasingly looking at alternative energy sources and investment vehicles. I believe the Global X Uranium ETF (NYSEARCA:URA) is an interesting investment vehicle to explore this theme.
Is Uranium Green?
What may surprise many ESG-focused investors is that nuclear power is one of the greenest source of energy (Figure 1). According to the Department of Energy, nuclear fission emits just 3 tons of CO2 per GWh of Electricity, on par with Solar and Wind, and is 270 times less polluting that Coal! However, unlike intermittent Solar and Wind, nuclear power is vastly more reliable and can be considered for baseload generation. It also has a much smaller physical footprint (Figure 2) compared to Solar and Wind. If we want to transition to a less carbon-centric economy, nuclear energy should be part of the solution.
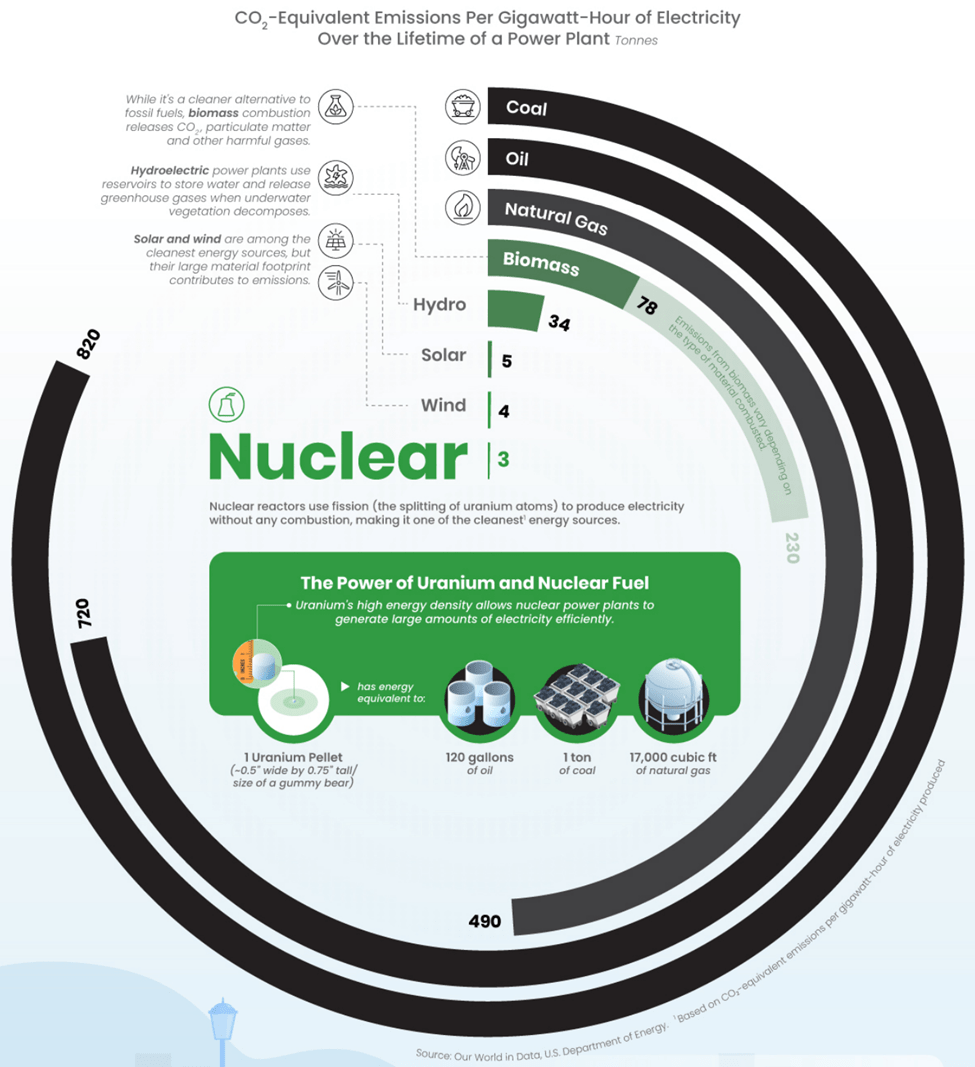
Figure 1 – CO2 equivalent emmissions per GWh (Sprott Physical Uranium Trust)
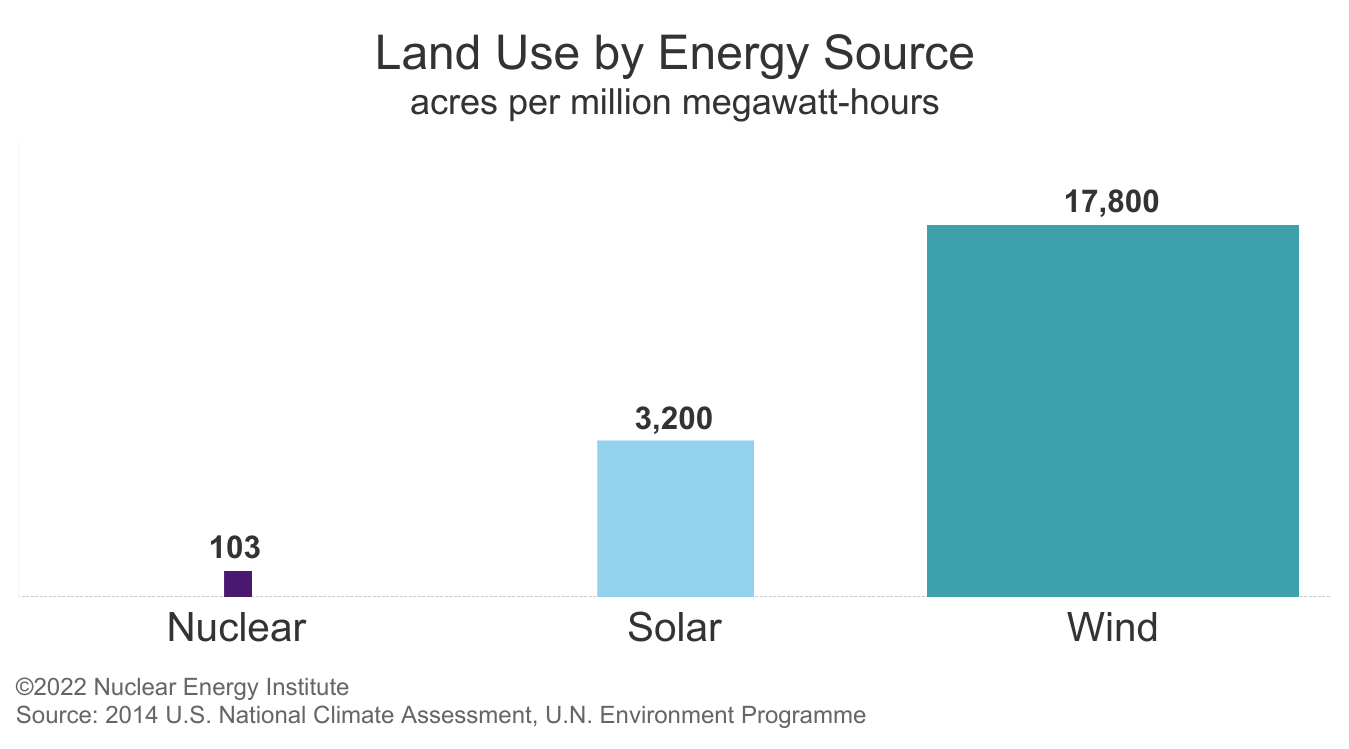
Figure 2 – Nuclear power uses much less land than equivalent solar and wind installations. (2014 US National Climate Assessment)
With such strong ESG credentials, why is there such a hesitancy for nuclear power?
The hesitancy to nuclear power largely stems from the 2011 Fukushima disaster. In 2011, the 9.0 Tohoku earthquake created a powerful tsunami with waves as high as 40m, that swamped and damaged the Fukushima Daiichi Nuclear Power Plant, causing the worst nuclear disaster since the Chernobyl disaster in 1986.
After the nuclear disaster, governments around the world enacted moratoriums on nuclear energy with some such as Germany even deciding to phase out nuclear power by 2022.
Governments rethinking nuclear energy
However, times may be changing. Since Russia’s invasion of Ukraine in late February, many governments around the world have been actively looking at securing their energy supply and are reconsidering their positions against nuclear power. For example, the Philippines is pushing to restart a dormant reactor; Japan and Korea are pushing for more nuclear energy amid the Ukraine crisis; Belgium is delaying its nuclear exit by at least 10 years; China continues to expand nuclear power and India plans to build 10 reactors in the next 3 years. Even California, long the most anti-nuclear US state, is looking to extend the life of its Diablo Canyon reactors.
With renewed interest in nuclear power, uranium prices briefly spiked to over $60/lb in April, before settling in at $48 recently (Figure 3).
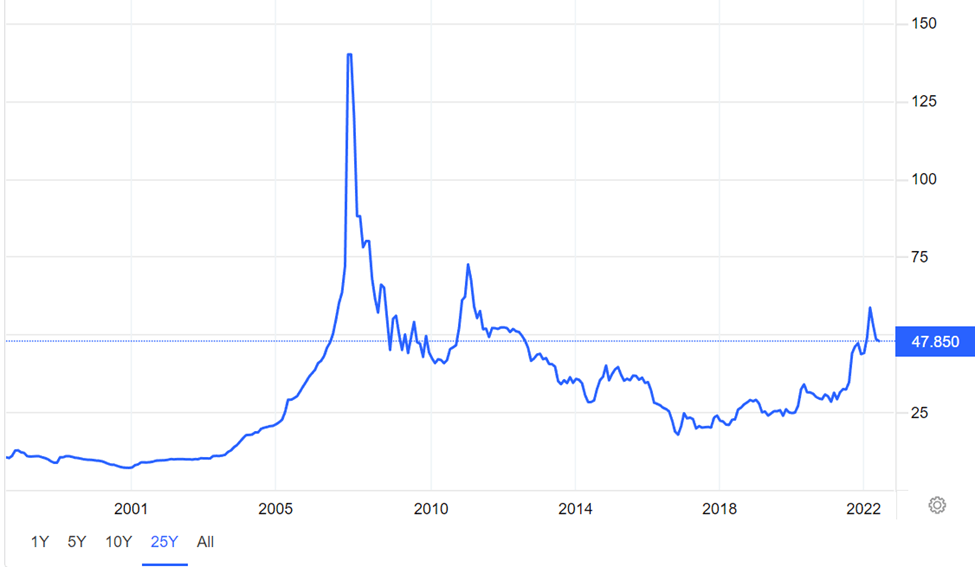
Figure 3 – Long term uranium prices trending higher (tradingeconomics.com)
With the twin macro tailwinds of ESG and energy security, what are the ways to participate in this trend?
With a macro trend like uranium, there are 3 main ways to participate. First, one can try to buy the underlying commodity directly through futures or physical ETFs such as the Sprott Physical Uranium ETF (OTCPK:SRUUF). For those with more risk appetite, one can buy uranium sector ETFs like the Global X Uranium ETF (URA) or the Sprott Uranium Miners ETF (URNM). Finally, investors with the most risk appetite can look at uranium mining companies, such as Cameco Corporation (CCJ) or NexGen Energy (NXE).
For the average investor without a lot of time to investigate individual uranium-related securities, I believe a broadly diversified approach like the Global X Uranium ETF is the ideal solution.
Overview Of URA
The Global X Uranium ETF is a targeted play on uranium mining and the production of nuclear components. It tracks the Solactive Global Uranium & Nuclear Components Total Return Index. URA includes companies focused on the extraction, refining, exploration, or manufacturing of equipment for the uranium and nuclear industries. The fund was launched on November 4, 2010, so there is a long history of returns to analyze and compare. It currently has $1.4 billion in assets, making it one of the larger commodity-producer focused ETFs on the market.
Fees And Expenses
One key point to note is that the URA ETF charges an expense ratio of 0.69%, which is high relative to market ETFs such as the SPDR S&P 500 Trust ETF (SPY)’s 0.09%. However, it is comparable to other sector ETFs average of 0.71% (Figure 4).
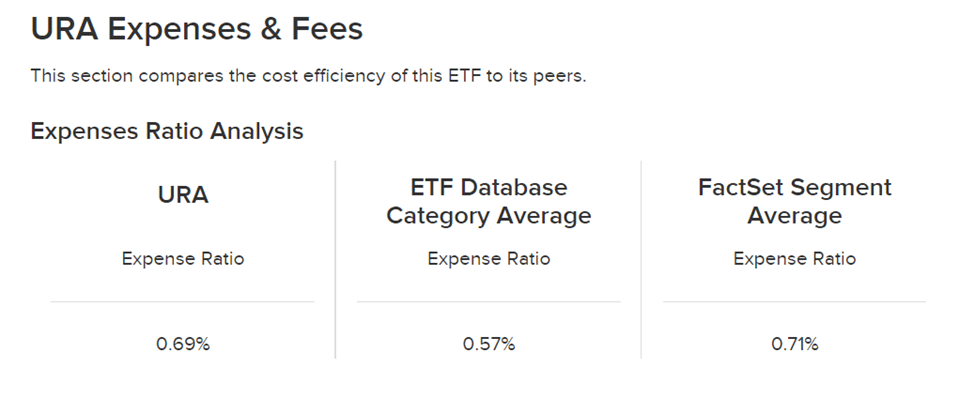
Figure 4 – URA charges an inline 0.69% expense ratio (etfdb.com)
Dividend and Yield
The URA ETF pays a semi-annual distribution and its most recent indicated SEC yield is 0.81%. In 2021, it paid $1.33 per unit while in 2020, it only paid $0.26. Looking through its distribution history summarized in Figure 5, it is clear the distribution payments are highly erratic. Investors looking for stable dividend income should consider other funds.
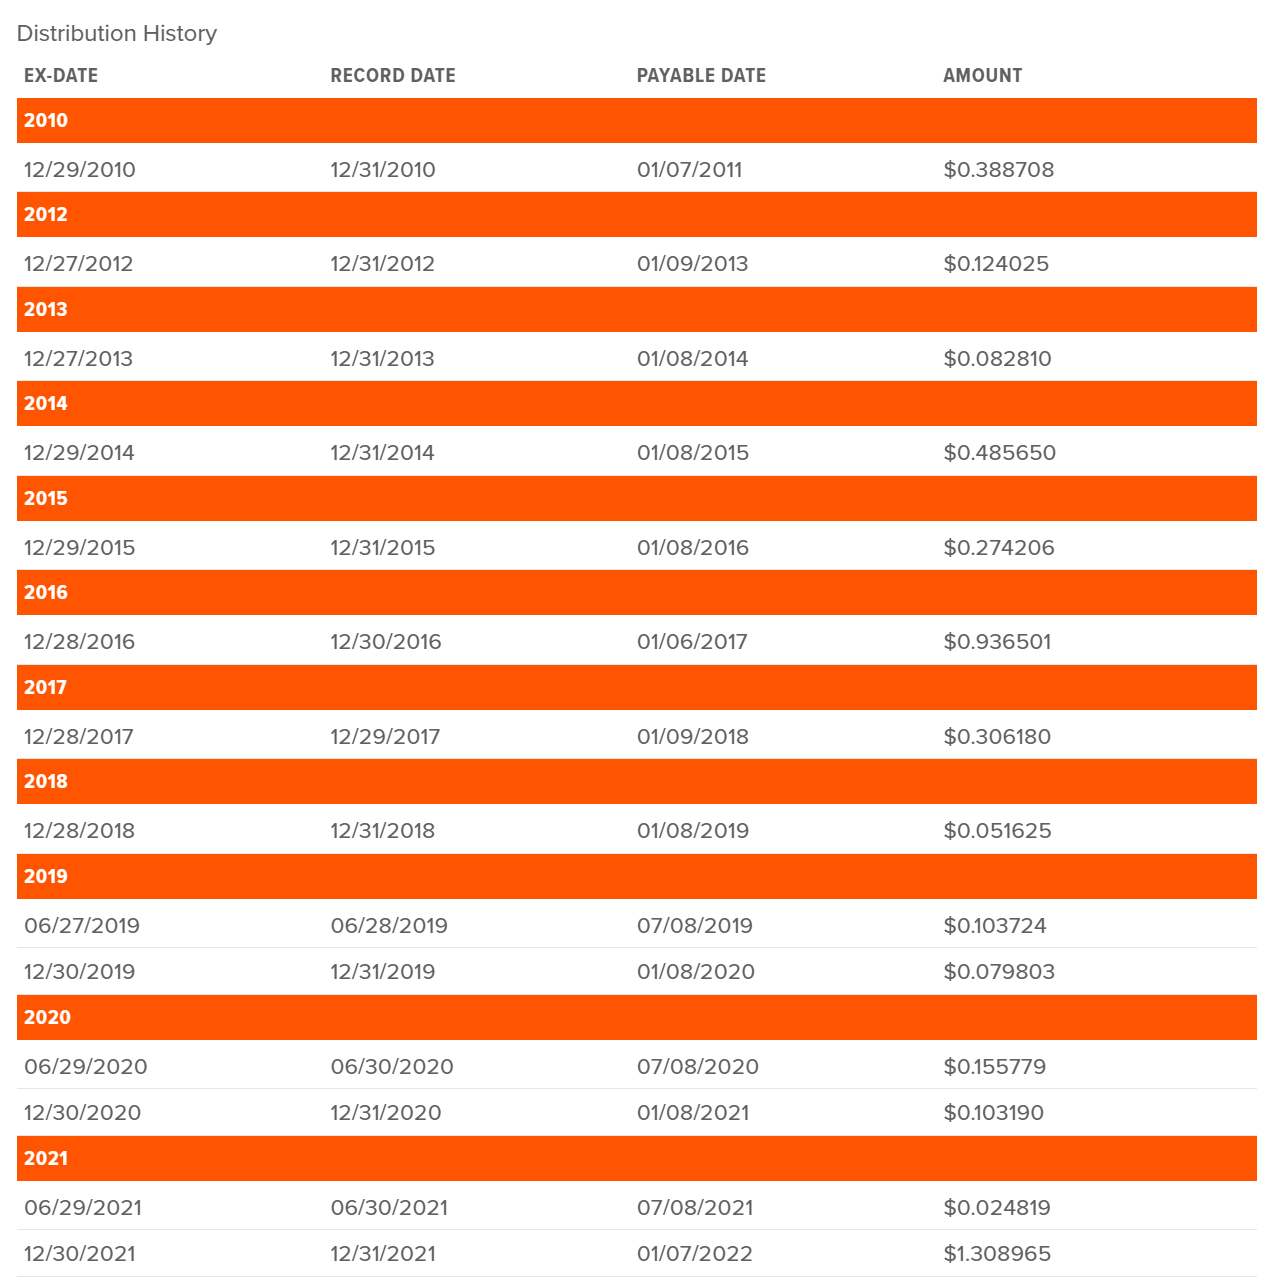
Figure 5 – URA has an erratic distribution history (globalxetfs.com)
Portfolio Composition
The Global X Uranium ETF is a fairly concentrated fund, with the top 10 holdings comprising 59% of the fund’s assets, and the top 3 holdings accounting for 34%. In Figure 6, I have further categorized the portfolio into uranium producers, physical uranium holdings, uranium exploration and developers, nuclear component manufacturers, and others. Overall, I find the fund provides a well-balanced exposure, with 28% allocated to uranium producers, 29% to exploration and development companies, 20% in component manufacturers and 10% in physical uranium.
|
% of Net Assets |
Name |
|
21.35 |
CAMECO CORP |
|
6.75 |
SPROTT PHYSICAL |
|
6.38 |
NAC KAZATOG-REGS |
|
5.26 |
NEXGEN ENERGY LTD |
|
4.11 |
PALADIN ENERGY LTD |
|
3.46 |
MITSUBISHI HEAVY |
|
3.3 |
URANIUM ENERGY CORP |
|
3.08 |
DENISON MINES CORP |
|
3.02 |
ENERGY FUELS INC |
|
2.81 |
YELLOW CAKE PLC |
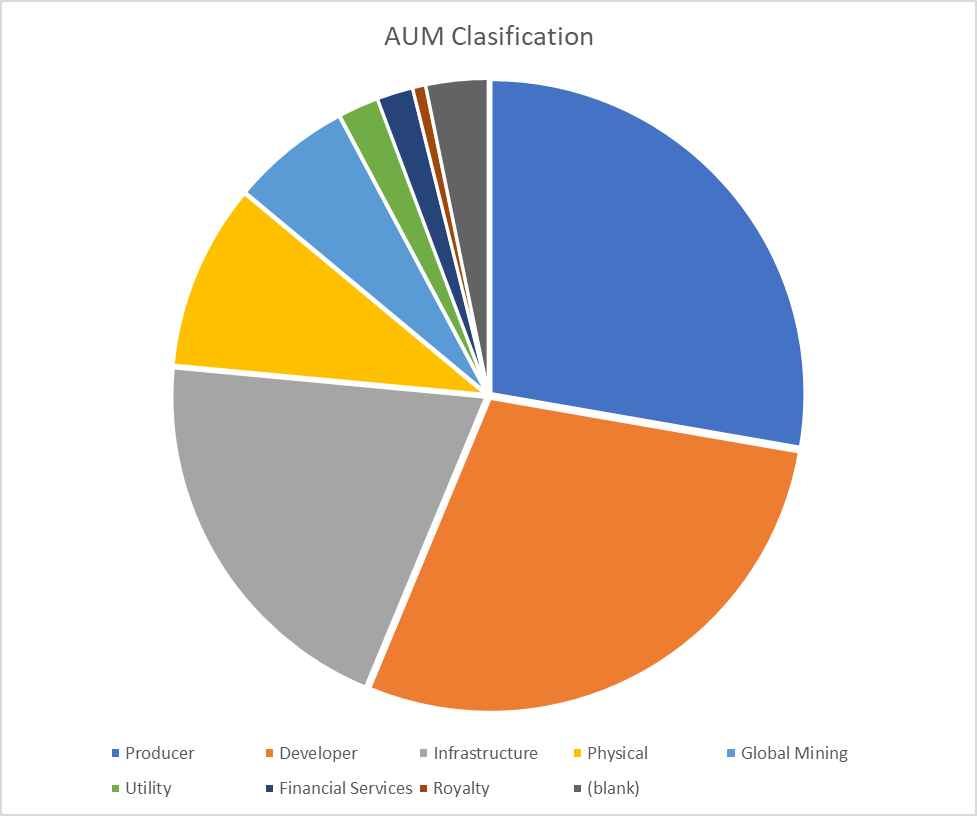
Figure 6 – URA holdings breakdown (globalxetfs.com)
Fund Returns Analysis
Overall, the Global X Uranium ETF has done well, returning annualized 6.2%, 27.9%, and 14.0% on a 1-, 3-, and 5-year basis (Figure 7). The ESG angle is not new, and investors have rewarded URA for its alternative energy exposure. However, the Fund has been in a loss position YTD, falling by 3.9% to May 31, 2022, as global markets have corrected.
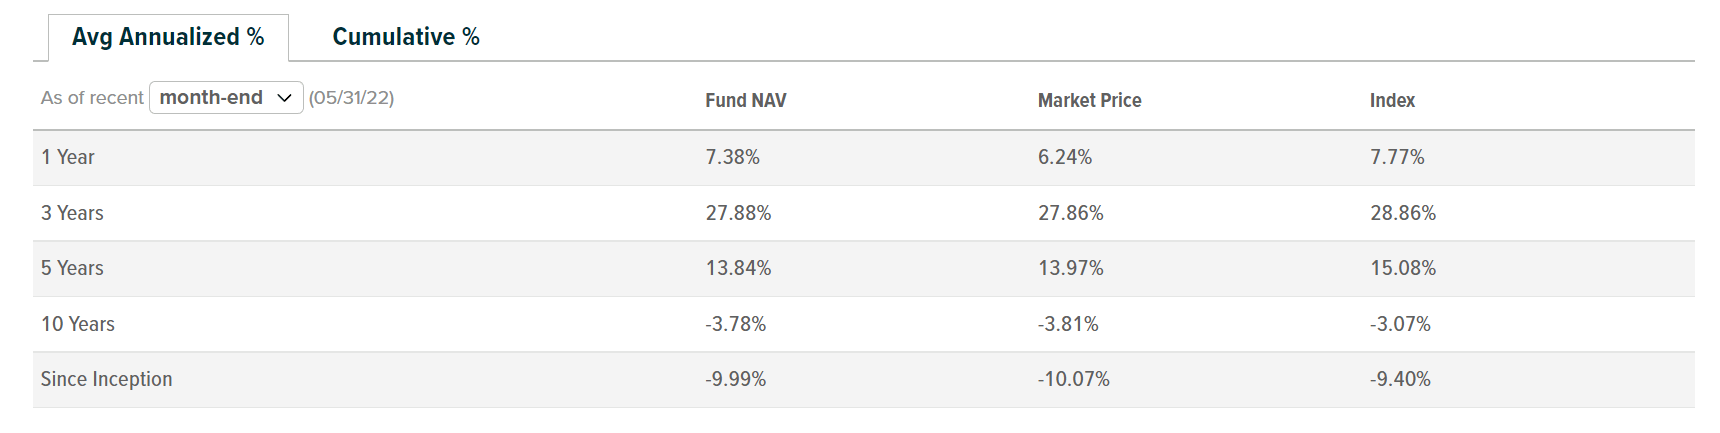
Figure 7 – Global X Uranium ETF Returns (globalxetfs.com)
Comparison against Peers & Benchmark
URA’s fund returns compare well to the S&P 500 Index’s -0.3%, 16.4% and 13.4% for 1-, 3-, and 5-year returns to May 31, 2022.
One word of caution, looking at URA’s returns, there is significant tracking error between the fund and its underlying index, the Solactive Global Uranium & Nuclear Components Total Return Index. For example, on a 5-year basis, the index has returned 15.1% per annum while the fund’s NAV has only increased by 13.8%. The difference cannot be explained by the fund’s 0.69% expense, so perhaps the fund has some hidden costs that are not clearly explained.
As we have mentioned previously, there are two main Uranium focused ETFs: The Global X Uranium ETF and the Sprott Uranium Miners ETF (URNM). URA has a lower expense ratio than URNM, 0.69% vs. 0.85%. Also, URA is a bigger fund, with $1.4 billion in assets vs. URNM’s $780 million. URNM also has less of an operating history, only launching in December 2019 vs. URA’s 10+ years of existence. Return-wise, URNM’s 1-year return to May 31, 2022 was 10.4%, higher than URA’s 6.2%. But without enough return history for URNM, it is hard to compare URA and URNM’s returns and conclude which fund is better from that perspective. Due to URNM’s limited operating history, smaller size, and higher fees, I believe URA is the better investment vehicle for investors.
Key Risks to Owning URA
Further analysis on the top holdings show that over 21% of the fund is invested in a single security, Cameco Corporation. This is a very high concentration for a sector fund. Basically, whatever happens to Cameco will have a big impact on the fortunes of URA investors.
Cameco Corp, based in Saskatoon, is an integrated uranium supplier, offering refining, conversion, and fuel manufacturing services. It is one of the largest pure-play uranium producer in the world, and produces approximately 17% of the world’s uranium. It has 3 main mining operations currently, Cigar Lake in Saskatchewan (50% owned by CCJ), Inkai in Kazakhstan (40% owned by CCJ) and McArthur River (70% owned by CCJ; restarting since February 2022). Any production hiccups or disruptions at one of CCJ’s operations could have a major impact on CCJ and URA’s prices.
Furthermore, as detailed in the position analysis, 29% of the fund is invested in uranium mining developers and explorers. This sub-sector is one of the most volatile in the market as junior mining companies are in constant need of capital to fund exploration and development. Such a large allocation to a volatile sub-sector increases the risk profile of the overall fund, raising the 1-yr volatility of the Global X Uranium ETF to 52%, almost triple the S&P500’s 19%.
Finally, notice that URA has a 10% holding in two physical ETFs, the Sprott Physical Uranium ETF with a 0.96% expense ratio, and Yellow Cake PLC (YCA-LN) with an estimated 0.6% expense ratio (total expenses / NAV). Generally, it is not a good idea to pay management fees on top of management fees. This could be one example of hidden fees that cause the fund to lag the index it is supposed to track.
Fundamental Analysis
Thematically, I believe the URA capitalizes on two major macro tailwinds: Low-carbon energy and global energy security. How does URA look fundamentally?
Fundamentally, the URA ETF trades at a P/E ratio of 19.2 on 2022 earnings. This is roughly in line with the S&P500’s 18.3. However, URA does screen cheap on the Price-to-Book value metric, with a 1.7x value, half of the S&P 500’s 3.5x (Figure 8 vs. Figure 9).
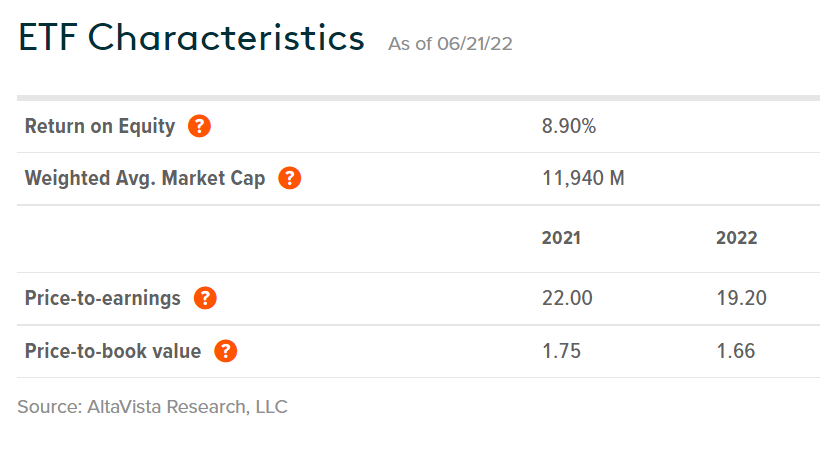
Figure 8 – URA Fundamentals (globalxetfs.com)
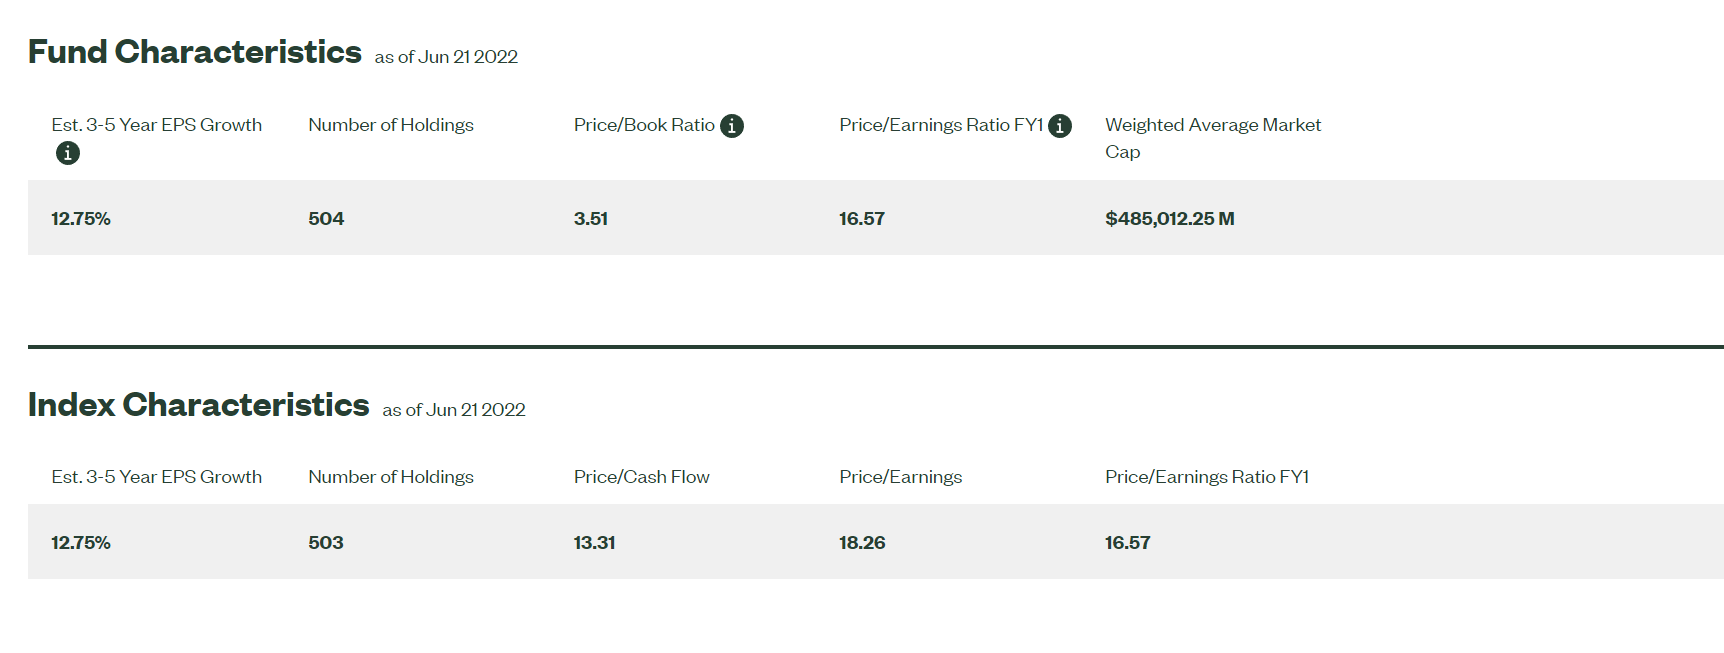
Figure 9 – SPY ETF fundamentals (ssga.com)
Recent Price Action
Recent price action has not been favorable for URA. As mentioned above, the URA is down 3.9% YTD to May 31, 2022. The decline is more dramatic if we measure from YTD highs of $28.49 to the May 31, 2022 price of $21.94, or -23.0%. Why did URA fare so poorly if nuclear energy and uranium should benefit from increased focus on energy security?
I believe the reason is that as mentioned above, 29% of the URA is invested in uranium mining developers and explorers, which are highly dependent on the capital markets to fund their exploration and development activities. When markets are in a downturn and capital markets are shut, these stocks fare especially poorly.
Technical Analysis
Technically, URA is trading at the lower end of a broad range from $18 to $30. It is trading below its 50- and 150-day moving average, indicating that it is currently in a downtrend (Figure 10).
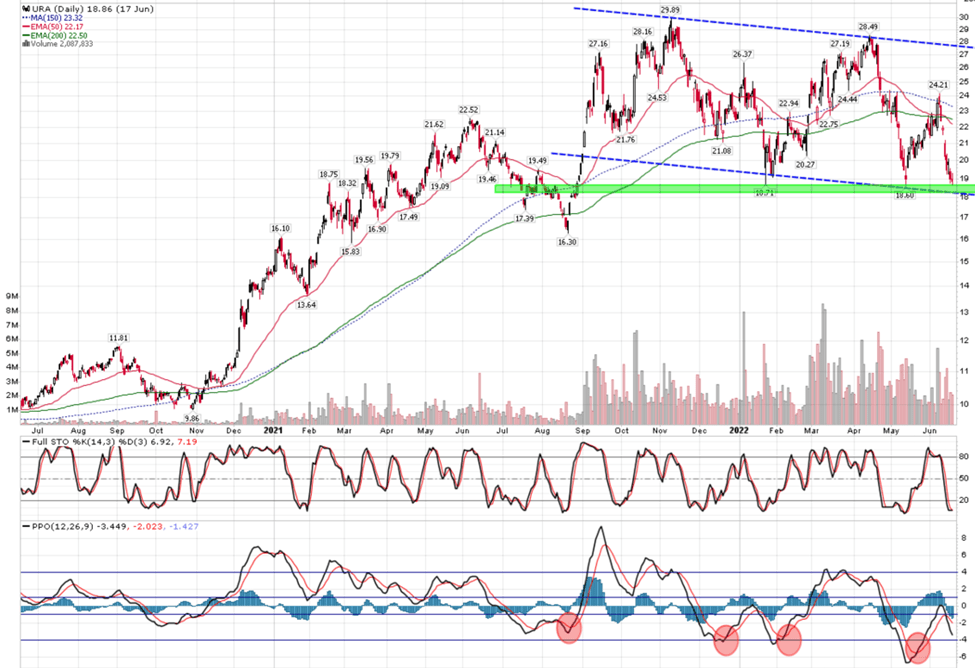
Figure 10 – Technical profile for URA (stockcharts.com)
There appears to be fairly strong support in the $18 to $19 zone, as it has bounced twice before from this area. Since reaching a YTD high of $28.49 in the days after the Russian invasion, it has fallen to $18.86 as of last Friday.
As a technical analyst, I would like to see URA hold support in the $18-19 zone and form a mechanical MACD buy signal that has worked well in the past.
Conclusion
Overall, I like the twin macro themes of ESG and global energy security that should benefit alternative energy such as nuclear power for the foreseeable future. I believe the Global X Uranium ETF provides investors with exposure to these two themes, with diversified exposures in physical uranium, producers and developers, and nuclear component manufacturers. However, given the current weak technical picture, I would recommend investors accumulate slowly or wait until URA successfully tests the $18 support.
Be the first to comment