

Nikolay Pandev/E+ via Getty Images
This article was co-produced with James Marino Sr. of Portfolio Insight.
Created by the author
This article series compiles a list of upcoming ex-dividend dates of stocks in Dividend Radar, a spreadsheet containing stocks with dividend increase streaks of five years or more.
To earn the next dividend, be sure to buy a stock before its ex-dividend date, which usually is one business day before the record date. Unfortunately, if you wait until the ex-dividend date or thereafter, you won’t receive the next dividend payment! Instead, the seller will receive the next dividend.
Upcoming Ex-Dividend Dates
The following table presents a summary of ex-dividend dates for the next two weeks. The table is divided into sections by Ex-Div Date and sorted by Ticker for each date. Yrs are years of consecutive dividend increases, Yield is the new dividend yield for the market close Price on the date listed, and 5-yr DGR is the compound annual growth rate of the dividend over a 5-year period (on a trailing 12-month basis). Note that Payout is the dollar amount payable per share or unit on the Pay Date.
| Company (Ticker) | Yrs | Price | Fwd | 5-Yr | Next | Pay |
| (06/16) | Yield | DGR | Payout | Date | ||
| Ex-Div Date: 06/17 (Last Day to Buy: Thursday, 06/16) | ||||||
| Amphenol (APH) | 11 | $62.96 | 1.27% | 18.1% | 0.2 | 07/13 |
| Ecolab (ECL) | 30 | $146.01 | 1.40% | 6.6% | 0.51 | 07/15 |
| Tootsie Roll Industries (TR) | 56 | $32.22 | 1.12% | 3.0% | 0.09 | 07/07 |
| Ex-Div Date: 06/21 (Last Day to Buy: Monday, 06/20) | ||||||
| Broadcom (AVGO) | 13 | $497.99 | 3.29% | 38.3% | 4.1 | 06/30 |
| Bank First (BFC) | 9 | $71.47 | 1.23% | 7.1% | 0.22 | 07/06 |
| Federal Realty Investment (FRT) | 55 | $94.20 | 4.54% | 1.9% | 1.07 | 07/15 |
| Gladstone Investment (GAIN) | 11 | $12.62 | 7.13% | 4.4% | 0.075 | 06/30 |
| Gladstone Land (LAND) | 8 | $21.46 | 2.54% | 1.5% | 0.046 | 06/30 |
| Restaurant Brands International (QSR) | 10 | $47.28 | 4.57% | 26.4% | 0.54 | 07/06 |
| Toro (TTC) | 19 | $76.02 | 1.58% | 10.9% | 0.3 | 07/13 |
| Ex-Div Date: 06/22 (Last Day to Buy: Tuesday, 06/21) | ||||||
| Getty Realty (GTY) | 10 | $25.29 | 6.48% | 8.6% | 0.41 | 07/07 |
| VICI Properties (VICI) | 5 | $28.56 | 5.04% | N/A | 0.36 | 07/07 |
| Ex-Div Date: 06/23 (Last Day to Buy: Wednesday, 06/22) | ||||||
| Canadian Pacific Railway (CP) | 7 | $68.37 | 0.89% | 14.8% | 0.19 | 07/25 |
| Danaher (DHR) | 8 | $240.25 | 0.42% | 9.9% | 0.25 | 07/29 |
| Equity LifeStyle Properties (ELS) | 18 | $69.86 | 2.35% | 11.2% | 0.41 | 07/08 |
| First Guaranty Bancshares (FGBI) | 8 | $25.93 | 2.47% | 4.9% | 0.16 | 06/30 |
| Hackett (HCKT) | 9 | $18.45 | 2.38% | 9.5% | 0.11 | 07/08 |
| International Flavors & Fragrances (IFF) | 20 | $110.92 | 2.85% | 4.8% | 0.79 | 07/06 |
| Medtronic plc (MDT) | 45 | $87.35 | 3.11% | 7.9% | 0.68 | 07/15 |
| Omega Flex (OFLX) | 5 | $107.96 | 1.11% | N/A | 0.32 | 07/05 |
| DENTSPLY SIRONA (XRAY) | 11 | $34.41 | 1.45% | 7.3% | 0.125 | 07/08 |
| Ex-Div Date: 06/24 (Last Day to Buy: Thursday, 06/23) | ||||||
| Hurco (HURC) | 9 | $24.23 | 2.48% | 9.0% | 0.15 | 07/11 |
| Portland General Electric (POR) | 16 | $45.60 | 3.97% | 6.1% | 0.453 | 07/15 |
| Ex-Div Date: 06/27 (Last Day to Buy: Friday, 06/24) | ||||||
| Canadian Imperial Bank of Commerce (CM) | 5 | $49.64 | 5.20% | 5.7% | 0.83 | 07/28 |
| Ex-Div Date: 06/29 (Last Day to Buy: Tuesday, 06/28) | ||||||
| Ares Commercial Real Estate (ACRE) | 6 | $11.34 | 11.64% | 4.7% | 0.33 | 07/15 |
| Algonquin Power & Utilities (AQN) | 11 | $13.08 | 5.53% | 9.5% | 0.181 | 07/15 |
| Alexandria Real Estate Equities (ARE) | 12 | $130.53 | 3.52% | 6.9% | 1.18 | 07/15 |
| AvalonBay Communities (AVB) | 11 | $185.71 | 3.42% | 3.1% | 1.59 | 07/15 |
| AXIS Capital (AXS) | 19 | $54.35 | 3.16% | 3.1% | 0.43 | 07/15 |
| BancFirst (BANF) | 29 | $92.05 | 1.56% | 13.6% | 0.36 | 07/15 |
| Franklin Resources (BEN) | 42 | $22.86 | 5.07% | 8.5% | 0.29 | 07/15 |
| BRT Apartments (BRT) | 5 | $21.68 | 4.24% | N/A | 0.25 | 07/08 |
| Dillard’s (DDS) | 12 | $278.51 | 0.29% | 21.8% | 0.2 | 08/01 |
| Amdocs (DOX) | 10 | $77.88 | 2.03% | 12.9% | 0.395 | 07/29 |
| EastGroup Properties (EGP) | 11 | $151.48 | 2.90% | 9.6% | 1.1 | 07/15 |
| Essex Property (ESS) | 28 | $253.35 | 3.47% | 5.3% | 2.2 | 07/15 |
| FMC (FMC) | 5 | $104.14 | 2.04% | 25.1% | 0.53 | 07/21 |
| First Industrial Realty (FR) | 10 | $46.63 | 2.53% | 7.2% | 0.295 | 07/18 |
| FirstService (FSV) | 6 | $113.97 | 0.71% | 15.6% | 0.203 | 07/07 |
| Humana (HUM) | 11 | $424.19 | 0.74% | 17.9% | 0.788 | 07/29 |
| Illinois Tool Works (ITW) | 59 | $179.31 | 2.72% | 13.9% | 1.22 | 07/14 |
| Kilroy Realty (KRC) | 5 | $50.02 | 4.16% | -3.8% | 0.52 | 07/13 |
| Kennedy-Wilson (KW) | 11 | $18.58 | 5.17% | 9.3% | 0.24 | 07/07 |
| Lincoln Electric (LECO) | 27 | $122.93 | 1.82% | 9.8% | 0.56 | 07/15 |
| Lennox International (LII) | 13 | $186.23 | 2.28% | 16.4% | 1.06 | 07/15 |
| Mondelez International (MDLZ) | 9 | $59.02 | 2.37% | 13.0% | 0.35 | 07/14 |
| National HealthCare (NHC) | 19 | $66.93 | 3.41% | 3.5% | 0.57 | 08/01 |
| Nucor (NUE) | 49 | $113.13 | 1.77% | 3.8% | 0.5 | 08/11 |
| Regal Rexnord (RRX) | 17 | $127.73 | 1.10% | 11.5% | 0.35 | 07/14 |
| Rexford Industrial Realty (REXR) | 9 | $57.84 | 2.18% | 13.5% | 0.315 | 07/15 |
| STAG Industrial (STAG) | 9 | $30.53 | 4.78% | 0.9% | 0.122 | 07/15 |
| Steel Dynamics (STLD) | 12 | $70.66 | 1.92% | 14.3% | 0.34 | 07/15 |
| Stantec (STN) | 7 | $41.94 | 1.38% | 9.0% | 0.18 | 07/15 |
| Sun Communities (SUI) | 6 | $152.91 | 2.30% | 5.2% | 0.88 | 07/15 |
| Stryker (SYK) | 29 | $195.27 | 1.42% | 10.5% | 0.695 | 07/29 |
| TowneBank (TOWN) | 11 | $27.58 | 3.34% | 9.0% | 0.23 | 07/12 |
| Terreno Realty (TRNO) | 12 | $55.28 | 2.46% | 10.9% | 0.34 | 07/14 |
| TC Energy (TRP) | 7 | $51.54 | 5.49% | 9.8% | 0.9 | 07/29 |
| Willis Towers Watson (WTW) | 6 | $202.18 | 1.62% | 3.4% | 0.82 | 07/15 |
| York Water (YORW) | 25 | $38.51 | 2.03% | 3.9% | 0.195 | 07/15 |
| Ex-Div Date: 06/30 (Last Day to Buy: Wednesday, 06/29) | ||||||
| Air Products and Chemicals (APD) | 40 | $236.15 | 2.74% | 11.6% | 1.62 | 08/08 |
| Cardinal Health (CAH) | 27 | $50.16 | 3.95% | 1.8% | 0.496 | 07/15 |
| CubeSmart (CUBE) | 13 | $40.15 | 4.28% | 9.9% | 0.43 | 07/15 |
| General Dynamics (GD) | 31 | $213.41 | 2.36% | 9.4% | 1.26 | 08/05 |
| Ingredion (INGR) | 12 | $85.41 | 3.04% | 5.9% | 0.65 | 07/26 |
| Morningstar (MORN) | 9 | $224.08 | 0.64% | 13.4% | 0.36 | 07/29 |
| Royal Gold (RGLD) | 20 | $108.94 | 1.29% | 18.0% | 0.35 | 07/15 |
| Raymond James Financial (RJF) | 10 | $86.61 | 1.57% | 9.0% | 0.34 | 07/15 |
| Republic Services (RSG) | 19 | $121.66 | 1.51% | 7.5% | 0.46 | 07/15 |
| State Street (STT) | 11 | $62.10 | 3.67% | 13.2% | 0.57 | 07/11 |
| Sysco (SYY) | 52 | $78.76 | 2.49% | 14.6% | 0.49 | 07/22 |
Previous Post: Upcoming Ex-Dividend Dates: June 10-23, 2022
High-Quality Candidates
We use DVK Quality Snapshots to assess the quality of dividend growth stocks. An elegant and effective system, DVK Quality Snapshots employs five quality indicators and assigns 0-5 points to each quality indicator for a maximum quality score of 25 points.
We assign quality scores to all Dividend Radar stocks with upcoming ex-dates and screen for stocks with quality scores of 23 or higher. There are six such candidates.
Below we present the quality scores, an assessment of fair value (whether Above, At, or Below fair value), and two measures of each stock’s recent performance (1-year and 3-year trailing total returns [TTR]). Key metrics from the previous table are repeated here for convenience.
Created by the author from data in Dividend Radar and using DVK Quality Snapshots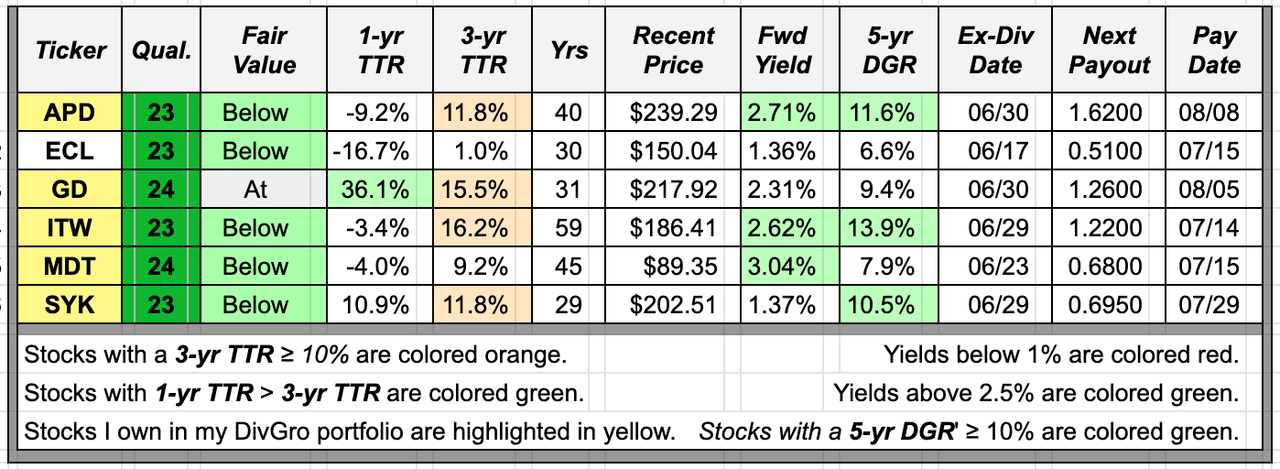
Dividend Radar views fair value as a range. All but one stock are trading at discounted valuations below the fair value range. The exception is GD, which is trading within its fair value range.
TTR adds the returns due to stock price appreciation (or depreciation) and dividend payments over each time frame. Dividend Radar provides 1-year and 3-year TTRs. The summary table highlights 3-year TTRs of 10% or higher in orange and any 1-year TRR that exceeds the 3-year TTR in green (indicating stronger recent performance).
Four of this week’s candidates have 3-year TTRs above 10% but only one of these, GD, also has a 1-year TTR that exceeds its corresponding 3-year TTR.
We also color-code the Fwd Yield and 5-yr DGR columns, preferring forward dividend yields above 2.5% and 5-year dividend growth rates of 10% or higher.
Three candidates yield more than 2.5% (APD, ITW, and MDT), and three have 5-year dividend growth rates above 10% (APD, ITW, and SYK).
An Interesting Candidate
Ideally, we’d like to see green cells in each of the Fair Value, 1-yr TTR, Fwd Yield, and 5-yr DGR columns. That rarely happens, though, so we look for a candidate that offers the best metrics overall, at least based on our current investment objectives.
We’ve covered all of these stocks before, but let’s revisit Dividend King, Dividend Aristocrat, and Dividend Champion, Illinois Tool Works this week.
Founded in 1912 and headquartered in Glenview, Illinois, ITW is a diversified, global company that manufactures and sells industrial products and equipment worldwide. ITW operates through seven segments: Automotive OEM; Test & Measurement and Electronics; Food Equipment; Polymers & Fluids; Welding; Construction Products; and Specialty Products.
ITW is rated Excellent (quality score 23-24):
Created by the author from a personal spreadsheet based on DVK Quality Snapshots
The stock yields only 2.62% at $186.41 per share and has an impressive 5-year DGR of 13.9%.
Over the past 10 years, ITW outperformed the SPDR S&P 500 ETF (SPY), an ETF designed to track the 500 companies in the S&P 500 index:
Portfolio-Insight.com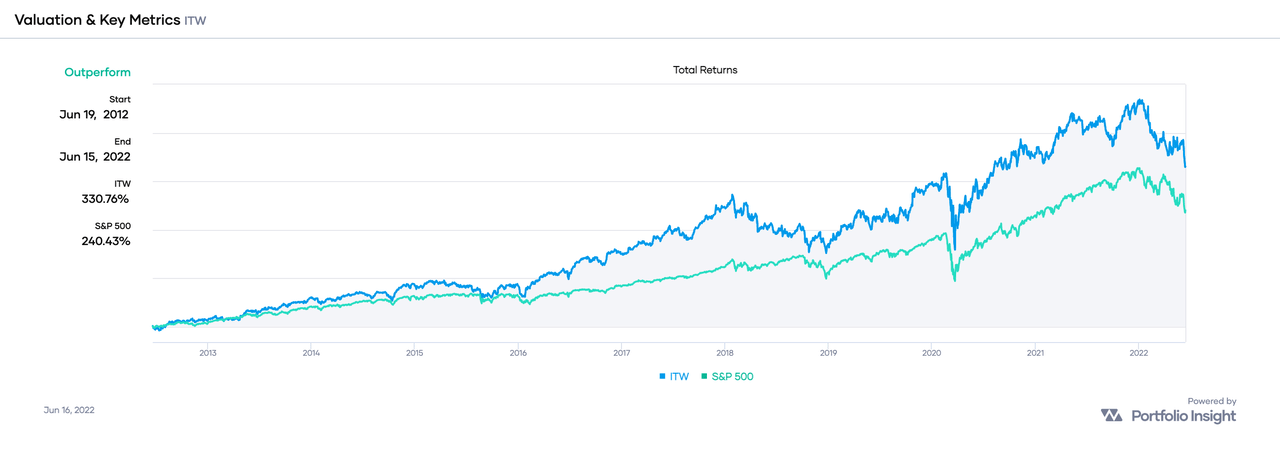
ITW delivered total returns of 331% versus SPY’s 240%, a margin of 1.38-to-1!
If we extend the time frame of comparison to the past 20 years, ITW also outperformed SPY, with total returns of 750% versus SPY’s 449%, a margin of 1.67-to-1!
Here is a chart showing ITW’s dividend growth history through the end of 2021:
Portfolio Insight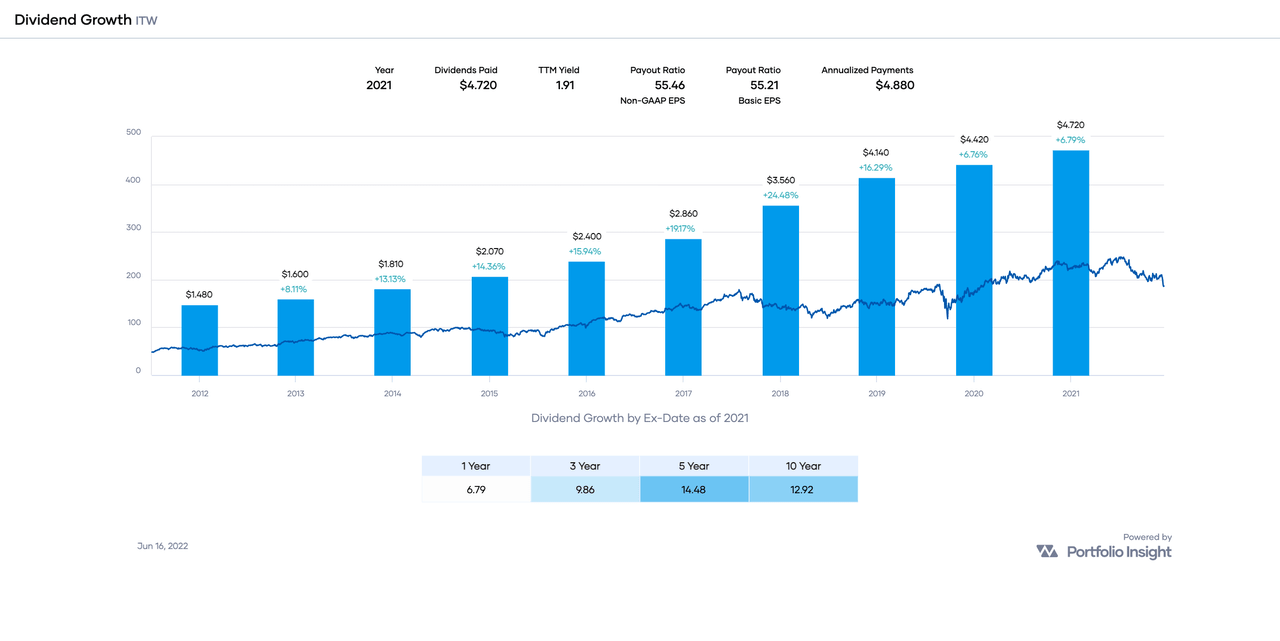
ITW is growing its dividend at a steady and slightly accelerating rate. We can see this by dividing the 5-year DGR by the 10-year counterpart: 14.48 ÷ 12.92 = 1.12. A ratio above 1.00 indicates an acceleration of the DGR. However, note that the last two increases were more modest increases.
ITW’s earnings generally are growing, with increases of 7.20% and 10.37% expected for FY 2022 and FY 2023, respectively:
Portfolio Insight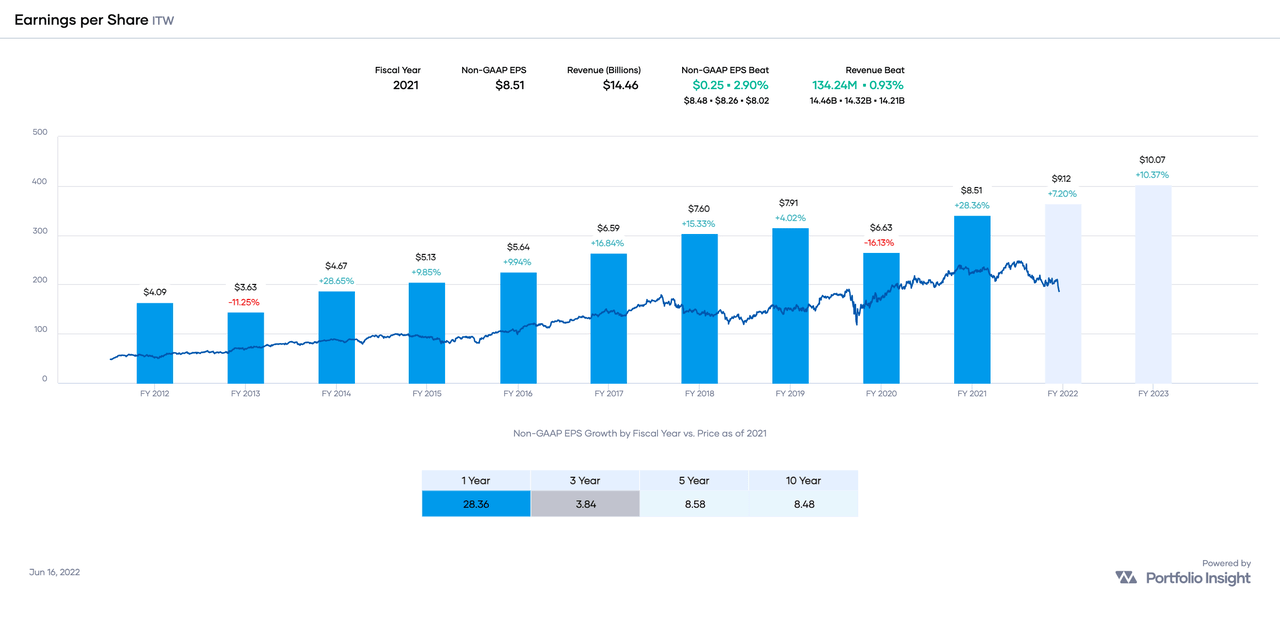
ITW’s payout ratio of 59% is “low for most companies,” according to Simply Safe Dividends:
Simply Safe Dividends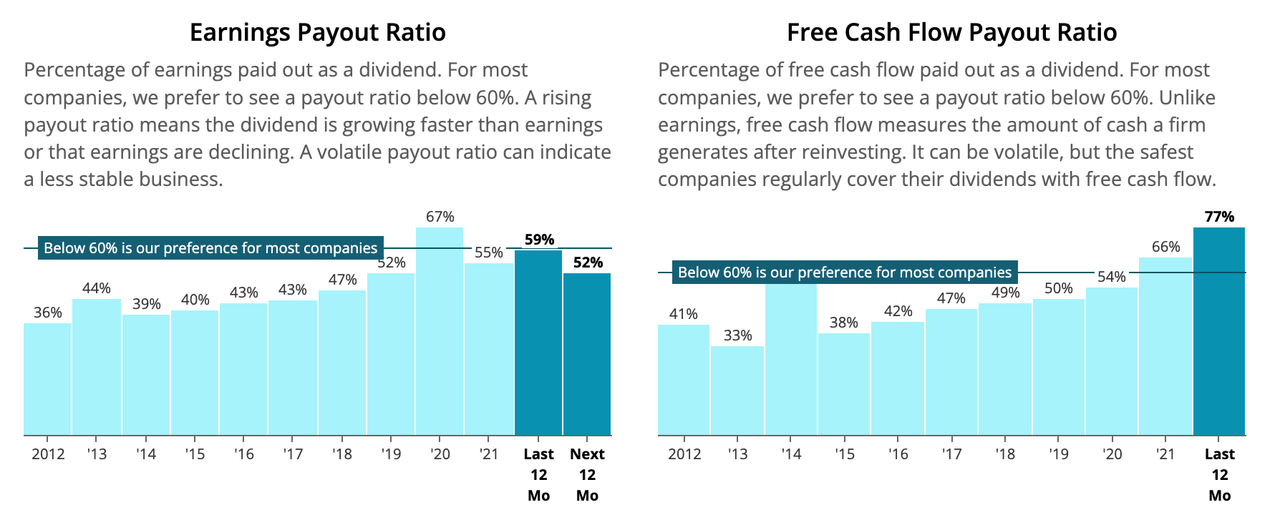
ITW has some room to continue paying and increasing its dividend, but future increases likely will be more modest. Simply Safe Dividends considers ITW’s dividend Very Safe with a Dividend Safety Score of 81.
Let’s now consider ITW’s valuation.
Portfolio Insight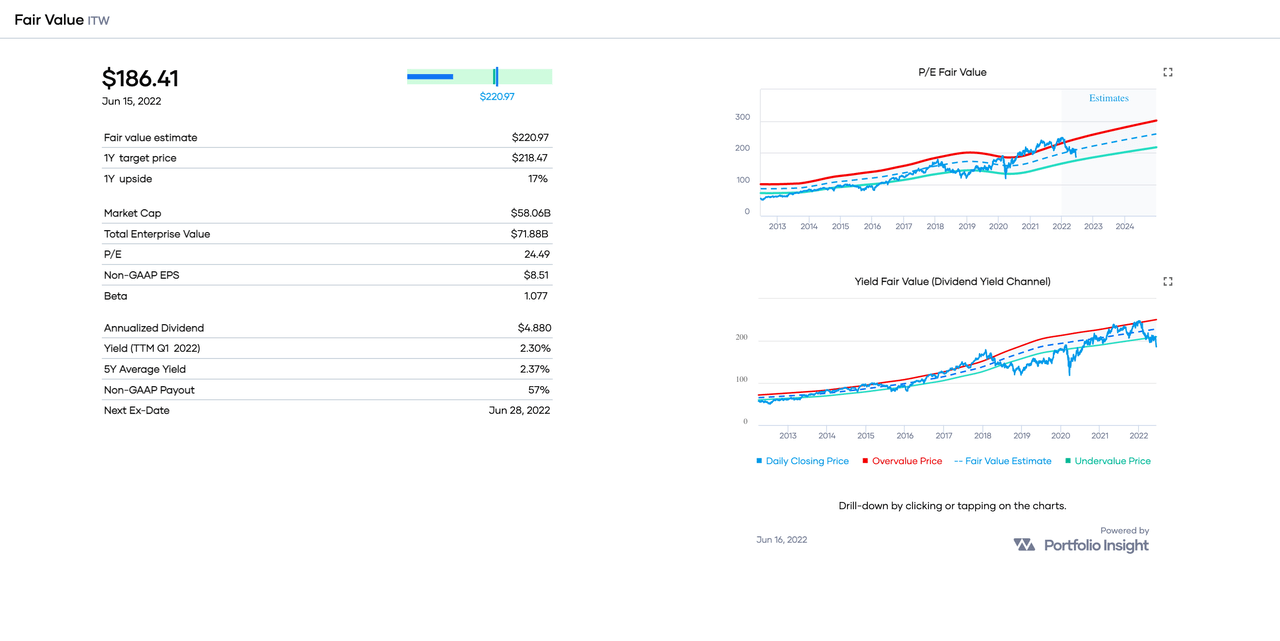
A quick way to estimate fair value is to divide the annualized dividend ($4.88) by the stock’s 5-year average yield (2.37%). That results in a fair value [FV] estimate of $206 based on ITW’s dividend yield history.
For reference, CFRA’s FV is $150, Morningstar’s FV is $205, Finbox.com’s FV is $216, Portfolio Insight’s FV is $221, and Simply Wall St’s FV is $324. That’s quite a range of opinions!
My own FV estimate of ITW is $202.
The average of all these estimates is $220. Given the stock’s current share price of $186.41, it appears that ITW is trading at a discounted valuation of about 15%.
Here are the most recent Seeking Alpha articles covering ITW:
Conclusion: ITW is a high-quality dividend growth stock trading below my fair value estimate of $202. I allow a premium of up to 5% for stocks rated Excellent. Therefore, my Buy Below price for ITW is $212 per share. For conservative investors, a buy below $182 would be more appropriate.
Please note that we’re not recommending ITW or any of the stocks listed in this article. Readers should do their own research on these companies before buying shares.
Be the first to comment