

Mag_Mac/iStock Editorial via Getty Images
This article was co-produced with James Marino Sr. of Portfolio Insight.
In this article series, we summarize upcoming ex-dividend dates for stocks in Dividend Radar, a weekly automatically generated spreadsheet of dividend growth stocks with dividend increase streaks of at least five years.
Created by the author
The ex-dividend date of stocks is usually set one business day before the record date, the cut-off date for determining which shareholders will receive the next dividend payment. You will not receive the next dividend payment if you buy a stock on its ex-dividend date or after. Instead, the seller will receive the next dividend. You will receive the dividend if you buy the stock before the ex-dividend date.
Upcoming Ex-Dividend Dates
The following table summarizes the ex-dividend dates for the next two weeks. The table is divided into sections by Ex-Div Date and sorted by Ticker for each date. Yrs are years of consecutive dividend increases, Yield is the new dividend yield for the market close Price on the date listed, and 5-yr DGR is the compound annual growth rate of the dividend over five years (on a trailing 12-month basis). Note that Payout is the dollar amount payable per share or unit on the Pay Date.
| Company (Ticker) | Yrs | Price | Fwd | 5-Yr | Next | Pay |
| (04/20) | Yield | DGR | Payout | Date | ||
| Ex-Div Date: 04/22 (Last Day to Buy: Thursday, 04/21) | ||||||
| Caterpillar (CAT) | 29 | $235.08 | 1.89% | 7.2% | 1.11 | 05/20 |
| Kaiser Aluminum (KALU) | 11 | $102.12 | 3.02% | 9.6% | 0.77 | 05/13 |
| Lakeland Financial (LKFN) | 8 | $77.61 | 2.06% | 18.5% | 0.4 | 05/05 |
| RMR (RMR) | 6 | $30.59 | 4.97% | 7.7% | 0.4 | 05/19 |
| Royal Bank of Canada (RY) | 7 | $111.22 | 3.42% | 7.2% | 1.2 | 05/24 |
| Star (SGU) | 13 | $11.47 | 4.97% | 6.8% | 0.153 | 05/03 |
| Ex-Div Date: 04/26 (Last Day to Buy: Monday, 04/25) | ||||||
| AptarGroup (ATR) | 29 | $119.50 | 1.27% | 4.2% | 0.38 | 05/18 |
| Clorox (CLX) | 45 | $146.20 | 3.17% | 7.7% | 1.16 | 05/13 |
| Fastenal (FAST) | 23 | $57.02 | 2.17% | 13.5% | 0.31 | 05/25 |
| Ex-Div Date: 04/27 (Last Day to Buy: Tuesday, 04/26) | ||||||
| Bank of New York Mellon (BK) | 12 | $47.02 | 2.89% | 12.5% | 0.34 | 05/11 |
| First Republic Bank (FRC) | 9 | $164.21 | 0.54% | 6.6% | 0.27 | 05/12 |
| Ex-Div Date: 04/28 (Last Day to Buy: Wednesday, 04/27) | ||||||
| Agree Realty (ADC) | 9 | $71.90 | 1.30% | 6.4% | 0.234 | 05/13 |
| AES (AES) | 10 | $24.91 | 2.54% | 6.3% | 0.158 | 05/13 |
| A. O. Smith (AOS) | 29 | $66.30 | 1.69% | 16.7% | 0.28 | 05/16 |
| Ames National (ATLO) | 12 | $24.37 | 4.43% | 4.4% | 0.27 | 05/13 |
| Costco Wholesale (COST) | 18 | $603.53 | 0.52% | 11.9% | 0.9 | 05/13 |
| Enterprise Products Partners (EPD) | 25 | $27.20 | 6.84% | 7.2% | 0.465 | 05/12 |
| Alliant Energy (LNT) | 19 | $65.11 | 2.63% | 6.5% | 0.428 | 05/16 |
| Morgan Stanley (MS) | 9 | $90.61 | 3.09% | 26.7% | 0.7 | 05/13 |
| NiSource (NI) | 6 | $32.10 | 2.93% | 6.3% | 0.235 | 05/20 |
| National Retail Properties (NNN) | 33 | $48.13 | 4.40% | 3.2% | 0.53 | 05/16 |
| Northwest Natural (NWN) | 66 | $51.50 | 3.75% | 0.5% | 0.483 | 05/13 |
| PNM Resources (PNM) | 11 | $47.87 | 2.90% | 8.1% | 0.348 | 05/13 |
| STAG Industrial (STAG) | 9 | $42.15 | 3.46% | 0.9% | 0.122 | 05/16 |
| Unum (UNM) | 14 | $33.78 | 3.55% | 8.6% | 0.3 | 05/20 |
| Virtus Investment Partners (VRTS) | 5 | $209.74 | 2.86% | 20.9% | 1.5 | 05/13 |
| Ex-Div Date: 04/29 (Last Day to Buy: Thursday, 04/28) | ||||||
| Ally Financial (ALLY) | 6 | $44.25 | 2.71% | 32.8% | 0.3 | 05/16 |
| Aon plc (AON) | 11 | $333.22 | 0.61% | 9.1% | 0.56 | 05/13 |
| Bank of Montreal (BMO) | 7 | $117.41 | 3.57% | 6.5% | 1.33 | 05/26 |
| Casey’s General Stores (CASY) | 23 | $215.83 | 0.65% | 8.0% | 0.35 | 05/16 |
| Hingham Institution for Savings (HIFS) | 15 | $344.52 | 0.64% | 10.9% | 0.57 | 05/11 |
| Realty Income (O) | 28 | $74.93 | 3.96% | 3.4% | 0.247 | 05/13 |
| Ex-Div Date: 05/02 (Last Day to Buy: Friday, 04/29) | ||||||
| Main Street Capital (MAIN) | 11 | $43.65 | 5.91% | 0.9% | 0.215 | 05/13 |
| Ex-Div Date: 05/03 (Last Day to Buy: Monday, 05/02) | ||||||
| VSE (VSEC) | 9 | $41.19 | 0.97% | 9.5% | 0.1 | 05/18 |
| Ex-Div Date: 05/04 (Last Day to Buy: Tuesday, 05/03) | ||||||
| Entergy (ETR) | 8 | $125.84 | 3.21% | 2.7% | 1.01 | 06/01 |
| Independent Bank (IBCP) | 8 | $22.07 | 3.99% | 18.8% | 0.22 | 05/16 |
| Constellation Brands (STZ) | 7 | $258.78 | 1.17% | 13.7% | 0.8 | 05/19 |
| Constellation Brands (STZ.B) | 7 | $286.74 | 0.96% | 13.9% | 0.72 | 05/19 |
| Ex-Div Date: 05/05 (Last Day to Buy: Wednesday, 05/04) | ||||||
| Franklin Financial Services (FRAF) | 8 | $33.10 | 3.87% | 8.6% | 0.32 | 05/25 |
| Intel (INTC) | 8 | $48.11 | 3.03% | 6.2% | 0.365 | 06/01 |
| Lamb Weston (LW) | 6 | $69.15 | 1.42% | 38.3% | 0.245 | 06/03 |
| Sirius XM (SIRI) | 5 | $6.41 | 1.40% | 29.6% | 0.022 | 05/25 |
| Walmart (WMT) | 49 | $159.63 | 1.40% | 1.9% | 0.56 | 05/31 |
Previous Post: Upcoming Ex-Dividend Dates: April 18-27, 2022
High-Quality Candidates
We use DVK Quality Snapshots to assess the quality of dividend growth stocks. This elegant and practical system employs five quality indicators and assigns 0-5 points to each quality indicator for a maximum quality score of 25 points.
By assigning quality scores to all Dividend Radar stocks with upcoming ex-dates, we could screen for the highest-quality candidates. This week, four stocks have quality scores of 22 or higher.
We present the quality scores, an assessment of fair value (whether Above, At, or Below fair value), and two measures of each stock’s recent performance (1-year and 3-year trailing total returns [TTR]). Key metrics from the previous table are repeated here for convenience:
Created by the author from data in Dividend Radar and using DVK Quality Snapshots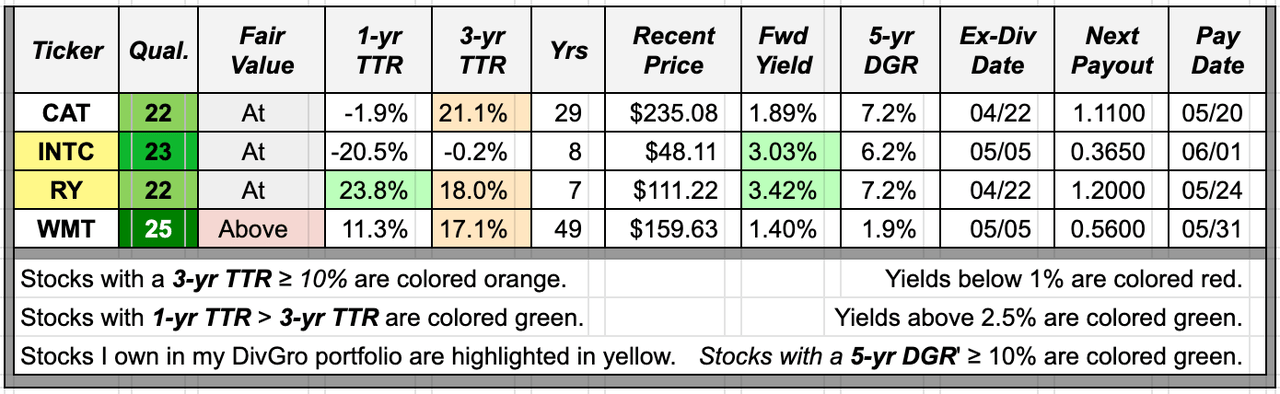
Dividend Radar views fair value as a range. Three stocks are fairly valued as they are trading within the fair value range (CAT, INTC, and RY), while one stock is trading at a premium valuation above the fair value range (WMT).
TTR adds the returns due to stock price appreciation (or depreciation) and dividend payments over each time frame. Dividend Radar provides 1-year and 3-year TTRs. The summary table highlights 3-year TTRs of 10% or higher in orange and each 1-year TRRs that exceeds the 3-year TTR in green (indicating stronger recent performance).
Three of this week’s candidates have 3-year TTRs above 10% (CAT, RY, and WMT), but only one of those also has a 1-year TTRs that exceeds its 3-year TTRs (RY).
We also color-code the Yield and 5-yr DGR columns, preferring dividend yields above 2.5% and 5-year dividend growth rates of 10% or higher.
Two candidates yield more than 2.5% (INTC and RY), and none have 5-year dividend growth rates above 10%.
An Interesting Candidate
Ideally, we’d like to see green cells in the Fair Value, 1-yr TTR, Yield, and 5-yr DGR columns. That rarely happens, though, so we look for a candidate that offers the best metrics overall, at least based on our current investment objectives.
We haven’t focused on Dividend Champion CAT yet, so let’s do so this week!
Caterpillar (CAT) was founded in 1925 and is headquartered in Deerfield, IL. The company manufactures construction and mining equipment, diesel and natural gas engines, industrial gas turbines, and diesel-electric locomotives. CAT provides technology for construction, transportation, mining, forestry, energy, logistics, electronics, financing, and electric power generation.
CAT is rated Fine (quality score 19-22):
Created by the author from a personal spreadsheet based on DVK Quality Snapshots.
The stock yields only 0.55% at $496.05 per share but has a spectacular 5-year DGR of 20.3%!
Over the past ten years, CAT underperformed the SPDR S&P 500 ETF (SPY), an ETF designed to track the 500 companies in the S&P 500 index:
Portfolio-Insight.com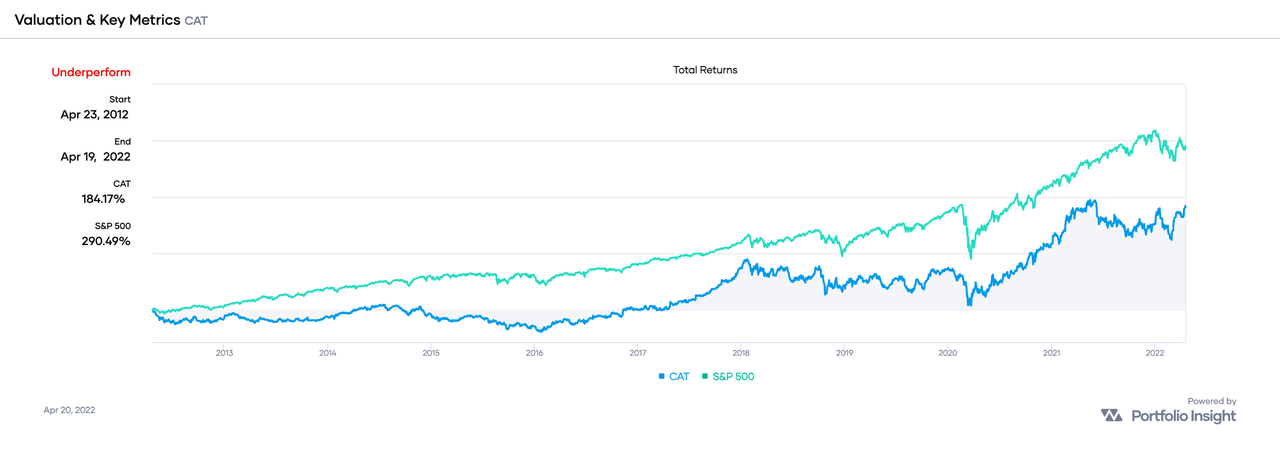
CAT delivered total returns of 184% versus SPY’s 294%, a margin of 0.63-to-1.
However, if we extend the comparison time frame to the past 20 years, CAT easily outperformed SPY, with total returns of 1,306% versus SPY’s 479%. That’s a margin of 2.73-to-1.
Here is a chart showing CAT’s dividend growth history through the end of 2021:
Portfolio Insight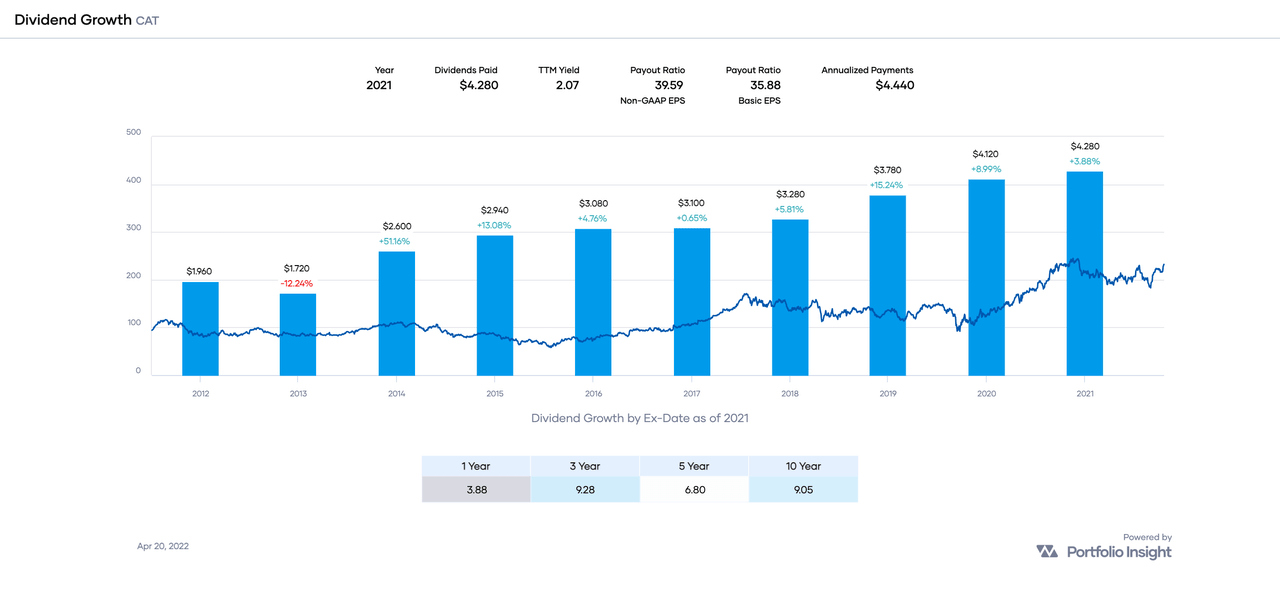
CAT is growing its dividend at a reasonable rate, with a 5-year dividend growth rate [DGR] of 6.8%. But the DGR is decelerating somewhat, particularly in recent years.
The company’s EPS history is not so consistent and shows some cyclicality, though earnings estimates for FY 2022 through FY 2024 look very promising!
Portfolio Insight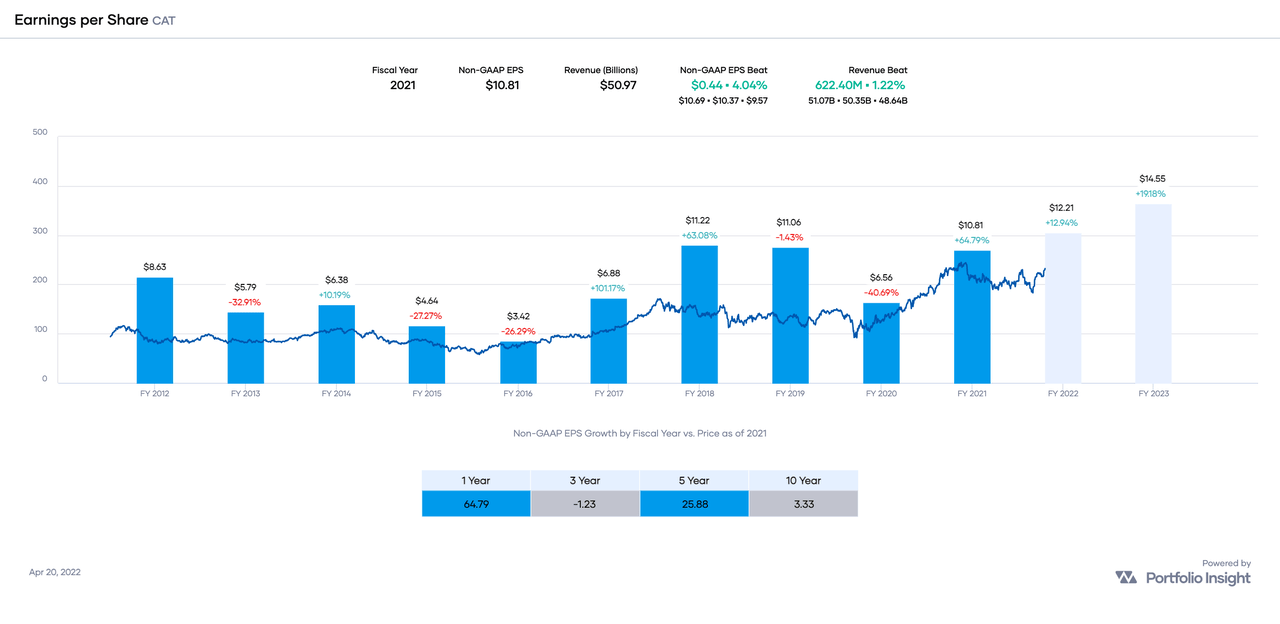
CAT’s payout ratio of 40% is “edging high for heavy equipment makers,” according to Simply Safe Dividends:
Simply Safe Dividends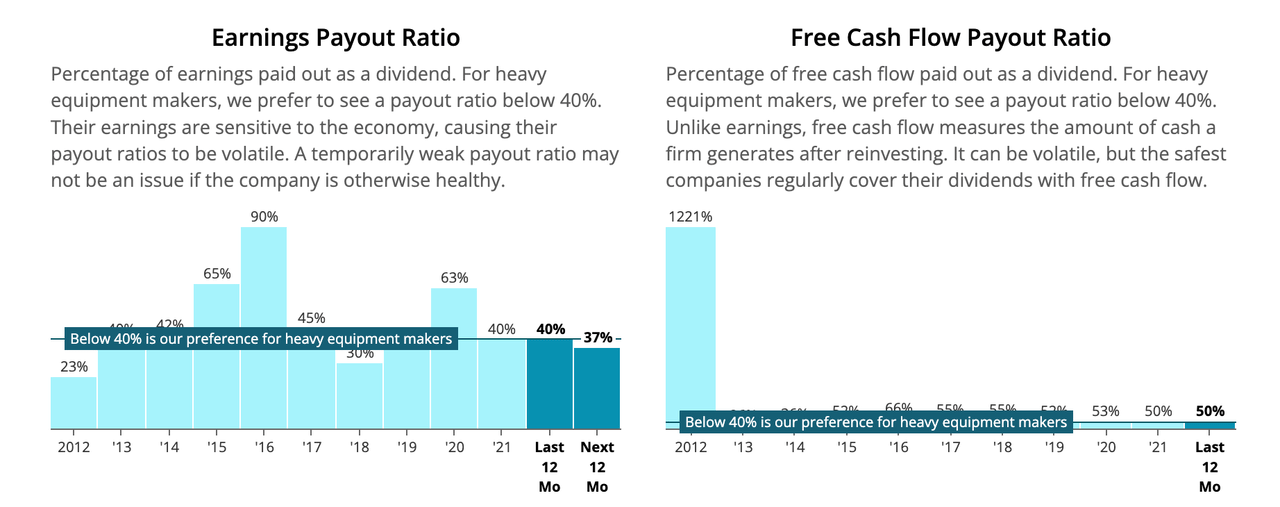
Simply Safe Dividends considers CAT’s dividend Very Safe with a Dividend Safety Score of 93.
Let’s now consider CAT’s valuation.
Portfolio Insight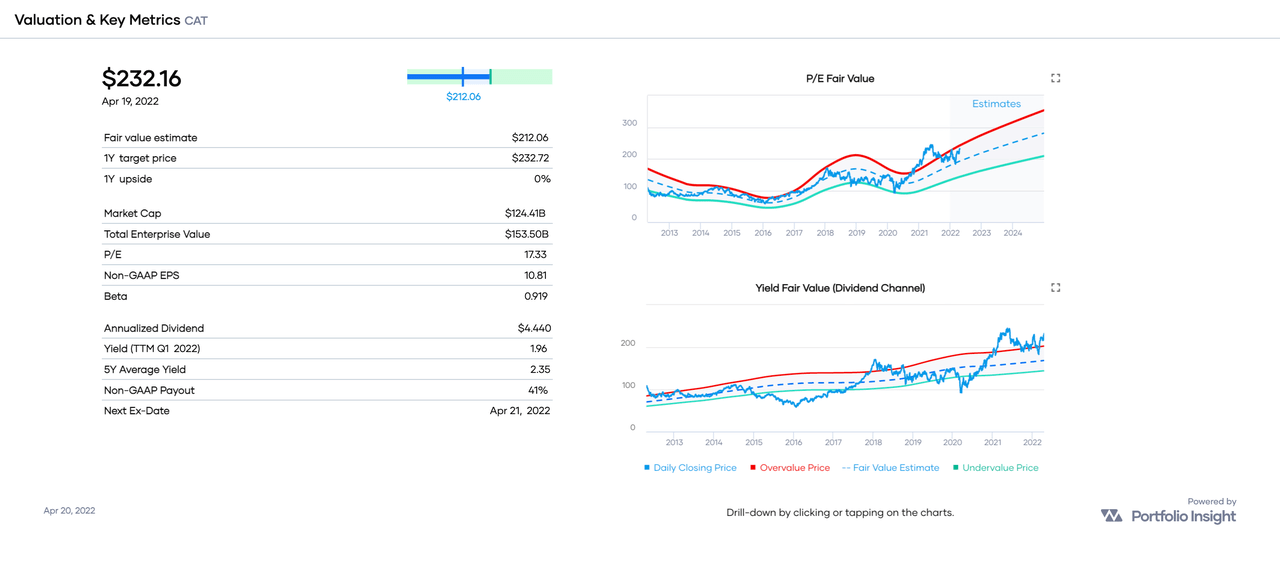
A quick way to estimate fair value is to divide the annualized dividend ($4.44 by the stock’s 5-year average yield (2.35%). That results in a fair value [FV] estimate of $189 based on CAT’s dividend yield history.
For reference, Morningstar’s FV is $184, Portfolio Insight’s FV is $212, CFRA’s FV is $218, Finbox.com’s FV is $250, and Simply Wall St’s FV is $399. That’s quite a range of opinions!
My own FV estimate of CAT is $221.
The average of all these estimates is $239. Given the stock’s current share price of $235.08, CAT is trading at about fair value.
Here are the most recent Seeking Alpha articles covering CAT:
Conclusion
CAT is a high-quality dividend growth stock trading above my fair value estimate of $221. I require a discounted valuation relative to my fair value estimate for stocks rated Fine, so my Buy Below price for CAT is $221 per share. For conservative investors, a buy below $199 would be more appropriate.
Be the first to comment