

USD/ZAR ANALYSIS
- South African fiscal woes to be exposed in tomorrow’s national budget speech
- SA Q4 unemployment figures tick higher
- Technical analysis shows indecision on USD/ZAR daily chart
RAND FUNDAMENTAL BACKDROP
WILL GLOBAL FACTORS PERSIST AS THE DOMINANT INFLUENCE OVER THE RAND?
This week should shed more light on Rand mechanics since global risk sentiment along with the U.S. Dollar that has taken over as the primary market mover for the USD/ZAR pair since early/mid-2020. Local fundamental issues have been overshadowed by these external factors but for how long?
Tomorrow’s national budget speech shall highlight many of these issues however, it will be interesting to monitor the Rands medium-term reaction with several U.S. specific events scheduled over the next few weeks.
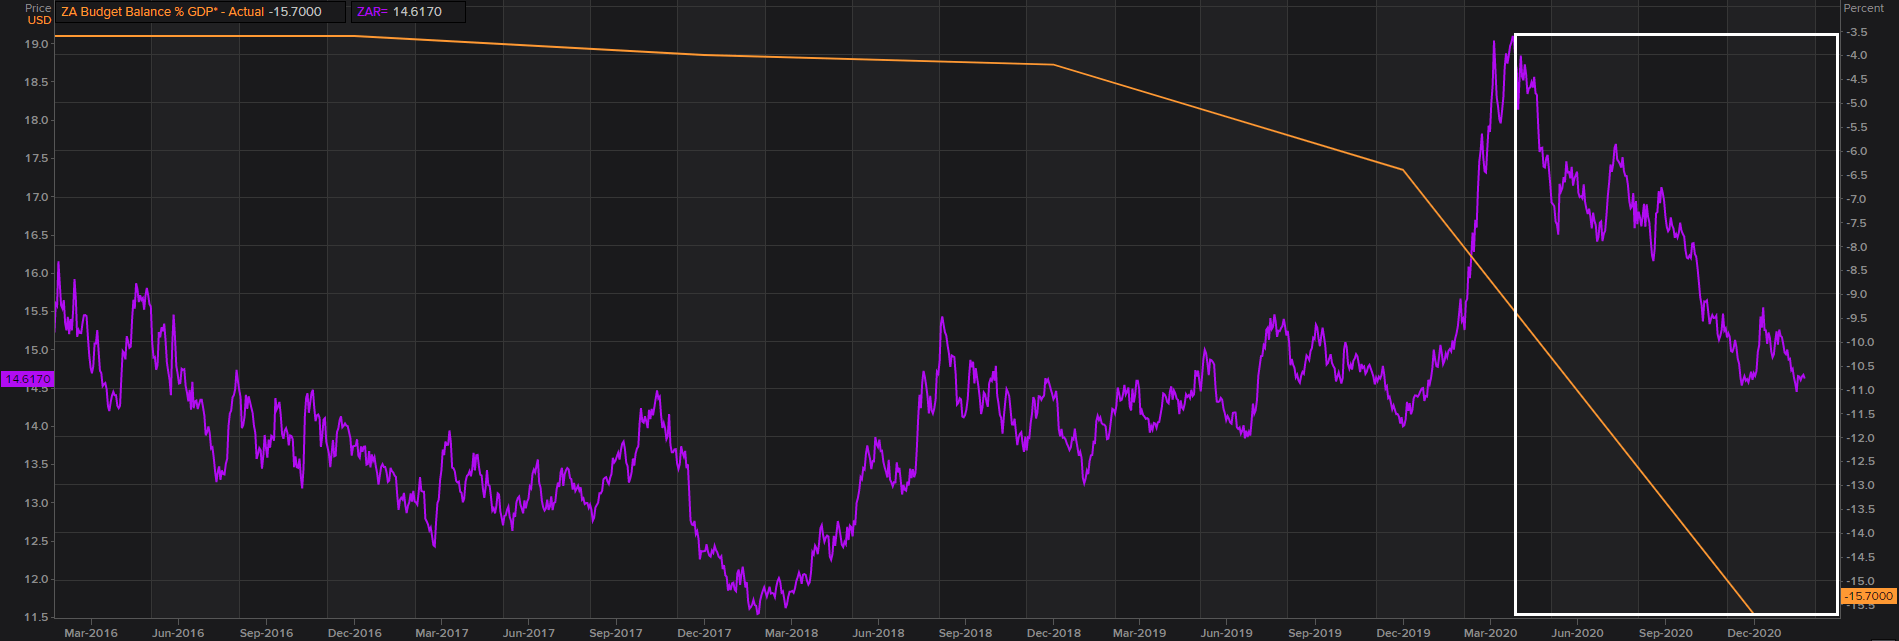
The chart below shows the poor fiscal balance as a percentage of GDP (orange) figures which underlines the inability for the South African government to meet its financing needs. This leads to the management of public funds which is well-known to be mismanaged in several key areas.
The impact on the Rand as shown below (white box) has recently been altered as the ZAR has exhibited great strength despite a declining budget balance % GDP figure. Focus will be on how the USD/ZAR pair reacts to the budget speech and how much of an impact it will have relative to global factors.
BUDGET BALANCE % GDP VS USD/ZAR
Chart prepared by Warren Venketas, Refinitiv
ECONOMIC ANNOUNCEMENTS
Unemployment statistics show that the 2020 Q4 unemployment rate increased to 32.5% from 30.8% for 2020 Q3. This is largely due to lockdown restrictions and limited global trade and demand showing primarily in finance and mining sectors. This had a slight post impact on the Rand toward the 14.7632 handle.

Source: Stats SA
Fed Chair Jerome Powell will address Congress later today (15:00GMT) to discuss the Fed’s stance on inflation and interests rates going forward. It is expected that he will maintain his position of sustaining low interest rates which could lead to further USD/ZAR downside.

Source: DailyFX economic calendar

Recommended by Warren Venketas
Trading Forex News: The Strategy
TECHNICAL ANALYSIS
Starts in:
Live now:
Dec 21
( 18:12 GMT )

Keep up to date with price action setups!
Trading Price Action
USD/ZAR DAILY CHART
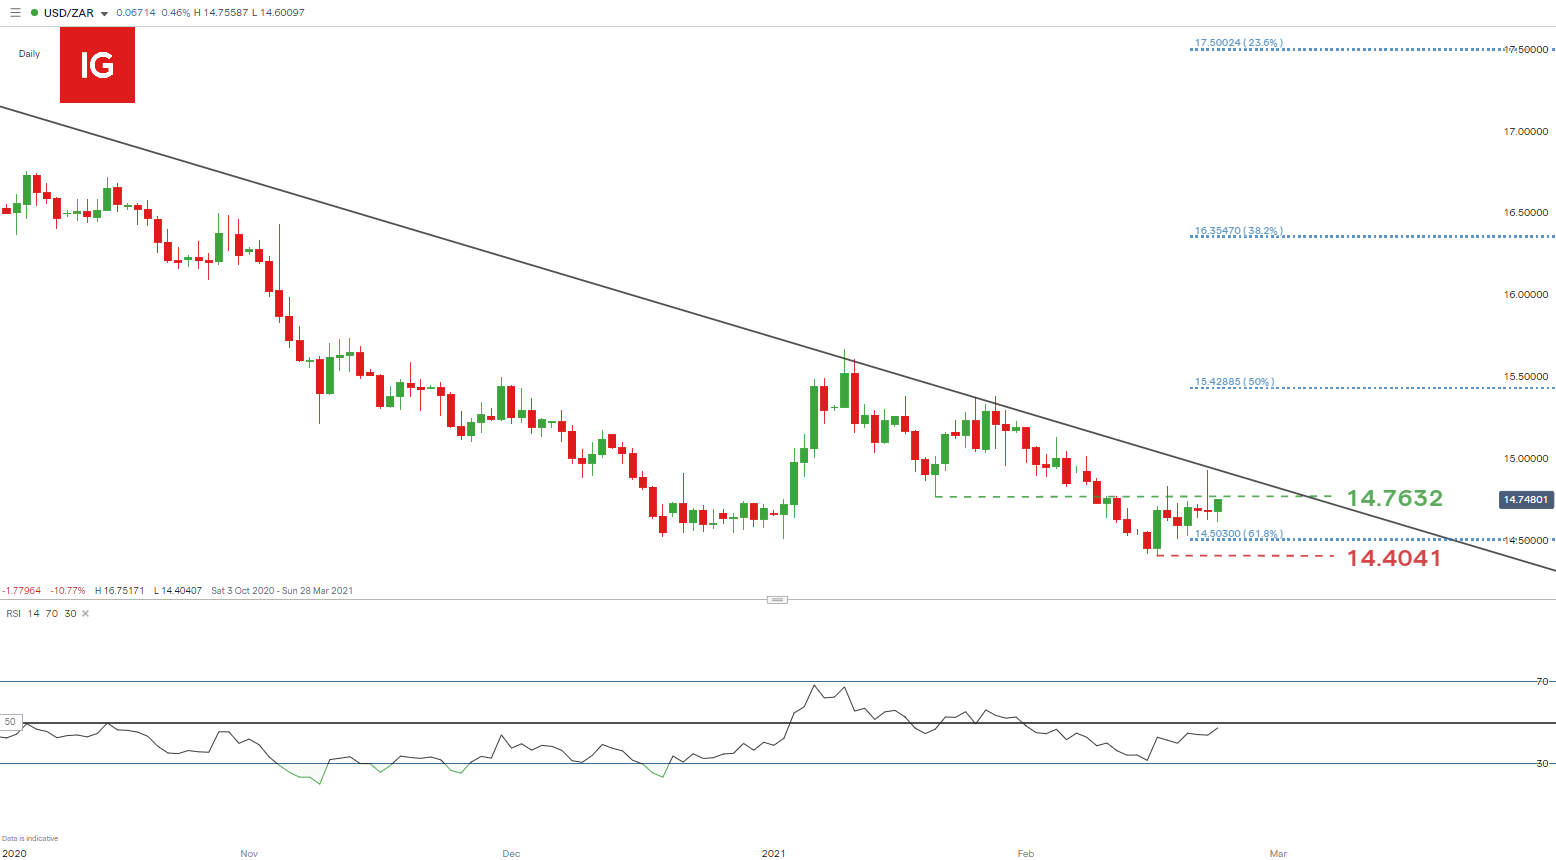
Chart prepared by Warren Venketas, IG
Yesterday’s long upper wick on the USD/ZAR daily chart showed price rejection around the longer-term resistance trendline (black) which was established back in September 2020. This key area of confluence will be a key focus for any upside going forward. This candle formation along with prior doji prints similarly suggest market indecision which falls in line with upcoming economic announcements.
Price action currently sits between the 14.7632 resistance and 14.5000 psychological support zones. With expected volatility throughout the week, these two levels will likely be breached depending on economic data and announcements.
The Relative Strength Index (RSI) sits below the 50 level and is indicative of bearish momentum. Recent upside bias has been shown of recent but could be dissipating as bulls fail to hold on to gains.
USD/ZAR: KEY TECHNICAL POINTS TO CONSIDER
- Trendline resistance
- 14.5000 support
- 14.7632 near term resistance
- RSI remains bearish
— Written by Warren Venketas for DailyFX.com
Contact and follow Warren on Twitter: @WVenketas
Be the first to comment