

US Dollar, Gold, Oil Talking Points:
- Gold (XAU/USD) takes strain above $1,900
- Oil continues to fall as Russia Ukraine talks adopt a more optimistic stance
- US Dollar retracts, risk-on sentiment limits gains
- S&P 500, NASDAQ (US Tech 100), DJI (Wall Street 30) climb. Is risk-on sentiment back?
Will an Agreement Between Russia and Ukraine Weigh on the US Dollar?
Throughout the first quarter of the year, the US Dollar has remained supported by it’s safe-haven appeal as an element of ‘risk-off sentiment’ limited equity gains.
Amid heightened fundamental risks and rising inflationary pressures, the Federal Reserve (US Central Bank) has adopted a more aggressive approach to monetary tightening as it remains committed to reducing price pressure without disrupting economic growth.
Visit the DailyFX Educational Center to discover the impact of politics on global markets
Although the conflict between Russia and Ukraine has provided an additional catalyst for both price action and monetary policy, Gold and Oil have fallen in today’s trading session,enabling equities to aim higher. For Gold and Oil, the respective levels of $1,900 (Gold) and $100 p/b (Oil) remain as key levels of support while USD strength loses traction.
Gold Technical Outlook:
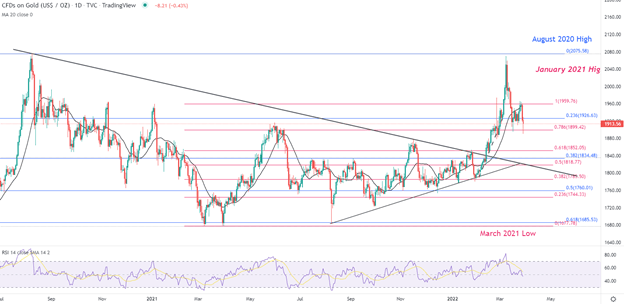
As XAU/USD remains committed to reclaiming the August 2021 high of $2,075, a hold above $1,900 will likely support the bullish trajectory pertaining to the yellow metal, with resistance holding firm at $1,959.
From a technical standpoint, key Fibonacci levels of historical moves continue to provide both support and resistance for price action, forming a zone of confluency between $1,899 and $2,000 which has historically held both bulls and bears at bay.
Gold (XAU/USD) Daily Chart
Chart prepared by Tammy Da Costa using TradingView
Oil Outlook
For Oil, the commodity constraints ensuing from the Covid-19 pandemic and bans against Russian oil have seen an extraordinary move in energy prices as both Brent and WTI rose above the $100 mark. With prices resting above this level of support, an optimistic shift in sentiment and lockdowns in Shanghai have weighed on Oil, hindering the ability for WTI to rise above $120,00, currently holding as resistance.
Although there has been a temporary shift in sentiment, technical levels continue to provide additional levels of support and resistance for both the intermediate and longer-term move.
Oil (WTI) Daily Chart
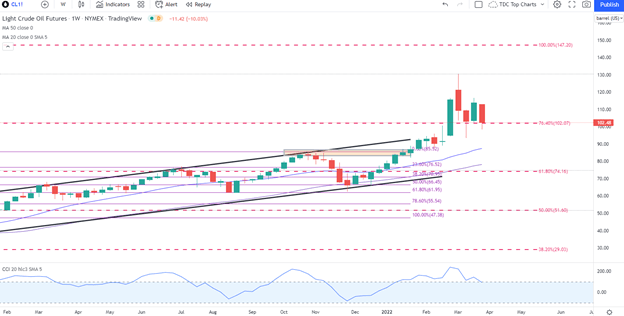
Chart prepared by Tammy Da Costa using TradingView
US Indices Build Confidence as Stocks Rise
Meanwhile, global equities have continued to benefit from the return of ‘risk-on sentiment’, supporting S&P (US 500), NASDAQ and the DJI (Wall Street 30).
For the S&P, prices remain within the key Fibonacci levels of 4551 and 4669 respectively, the key Fibonacci levels of the 2021- 2022 move.
As price action remains above the 20-day MA (moving average), a break below 4551 could see the 4500 coming into play with the next level of support holding at 4385.7 (the 38.2% retracement of the above-mentioned move).
S&P 500 (US 500) Daily Chart
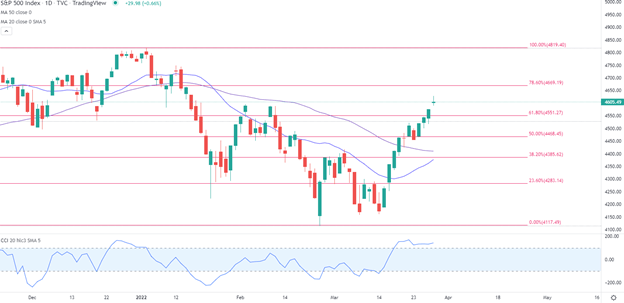
Chart prepared by Tammy Da Costa using TradingView
— Written by Tammy Da Costa, Analyst for DailyFX.com
Contact and follow Tammy on Twitter: @Tams707
Be the first to comment