

DAX, FTSE 100 Talking Points:
- DAX 40 breaks resistance, pushing prices towards pre-war levels
- FTSE 100 reclaims 7,200 as price action tests the 200-day MA
- Fed rate decision and FOMC meeting minutes pose an additional threat equities
Visit the DailyFX Educational Center to discover the impact of politics on global markets
DAX, FTSE Recover Ahead of FOMC
EU and UK stocks have remained resilient ahead of the Fed rate decision as a recovery in the Chinese equity market and lower oil prices boosted risk sentiment.
Following the effects of the Coronavirus pandemic, soaring energy prices (which leads to higher food, electricity and production costs), ballooned balance sheets and rising debt has placed additional pressure on policy makers to raise rates and to consider a more aggressive path for quantitative tightening in an effort to tackle inflation and reduce government debt.
With markets currently pricing in the expectation for the Fed to announce a 25 basis point rate hike, DAX, FTSE and other global indices are currently testing pre-war levels as geopolitical risks persist.
DailyFX Economic Calendar
However, with the war between Russia and Ukraine now posing an additional threat to the global economic recovery, a potential 50 basis point rate hike or changes in the economic projections may provide an additional catalyst for stocks for the imminent move.
DAX (Germany 40) Technical Analysis:
The DAX Index has managed to break through prior resistance turned support at the 14,079 Fibonacci level, allowing prices to rise back above 14,400, at least temporarily. With prices currently testing the 61.8% Fib level at 14,470, while the MACD remains below the zero line while pointing higher.
DAX (Germany 40) Daily Chart
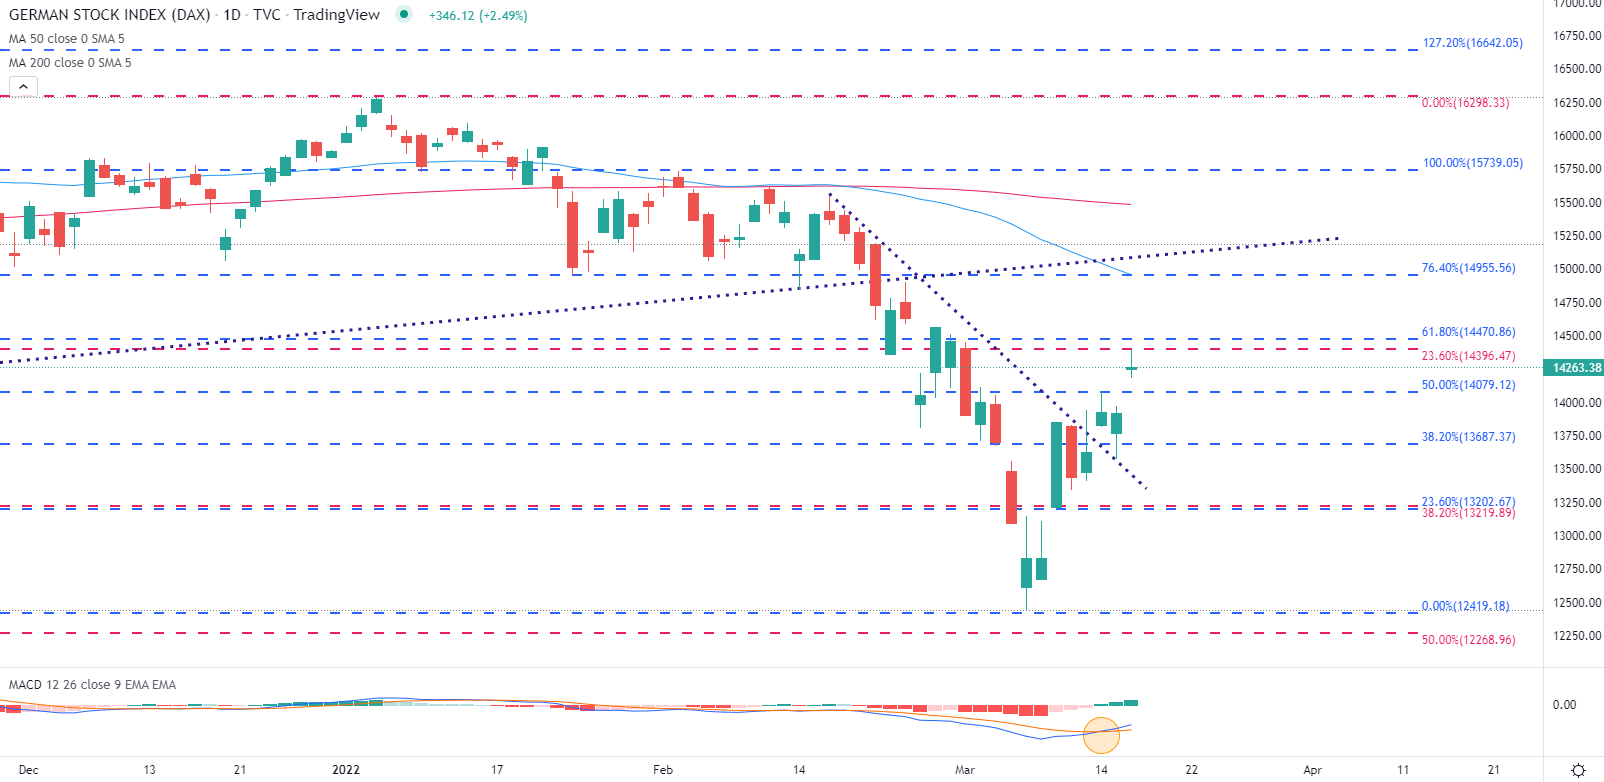
Chart prepared by Tammy Da Costa using TradingView
DAX40 Levels to Watch
Support:
- S1: 14,400
- S2: 14,000
- S2:13,687 (38.2% Fib of Feb – March move)
Resistance:
- R1: 14,470 (61.8% Fib of Feb – March move)
- R2: 14,961 (50-day MA)
- R3: 15,483 (200-day MA)
FTSE 100 Technical Analysis
Meanwhile, the FTSE has managed to reclaim the 7,200 level, allowing prices to rise back above the 200-day SMA (simple moving average) which continues to provide support at 7,225. As bulls aim to drive price action back towards the 7,400 spot, a crossover of the MACD (moving average convergence/divergence) suggests that while the downtrend currently remains intact, sellers may be losing steam.
FTSE 100 Daily Chart
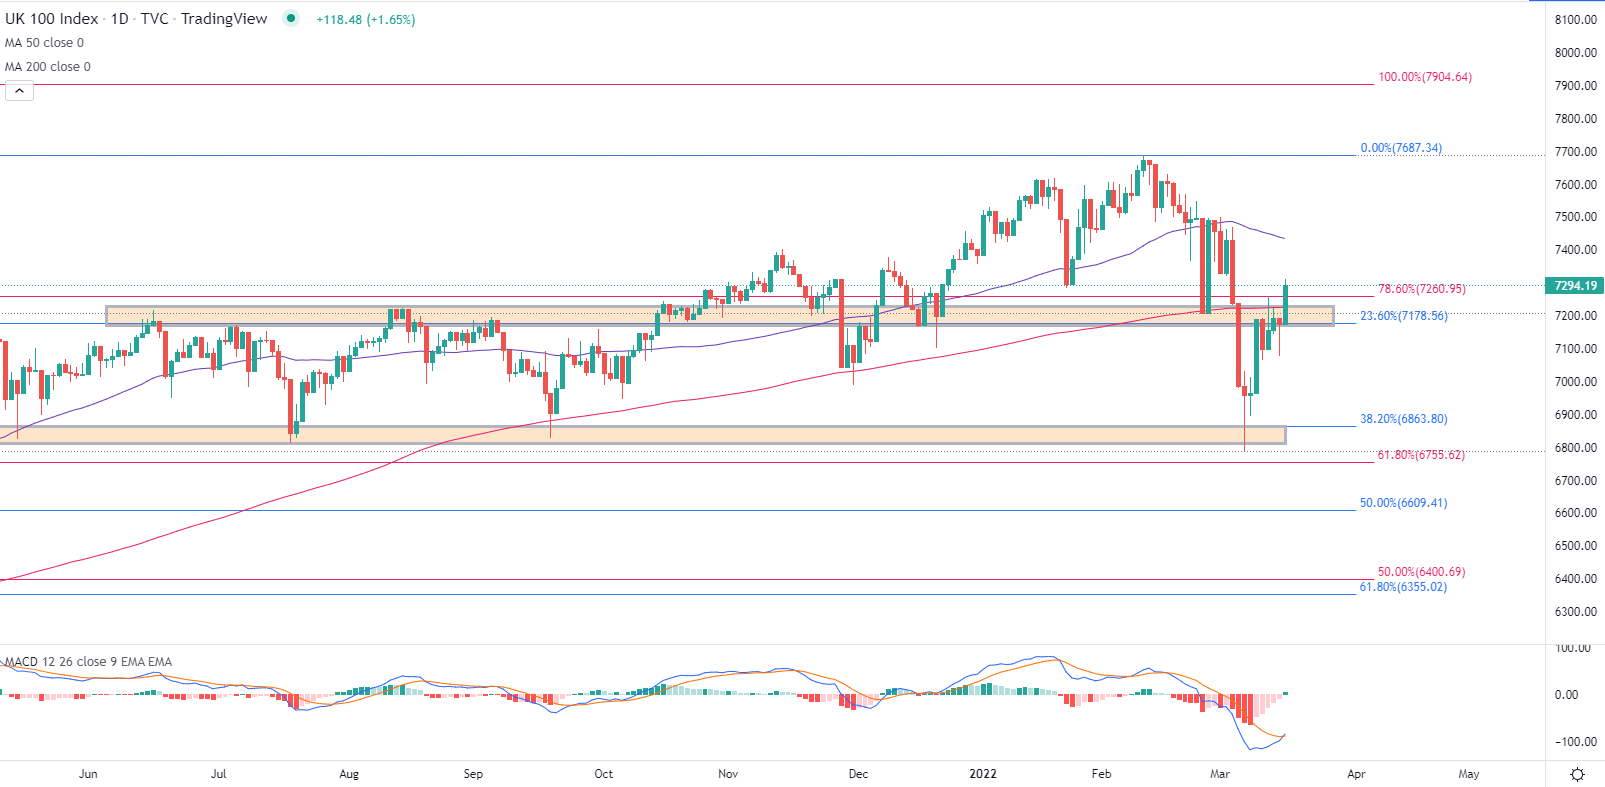
Chart prepared by Tammy Da Costa using TradingView
FTSE100 LEVELS TO WATCH
Support:
- S1: 7,200
- S2: 7,000
- S2: 6,864 (Fib level)
Resistance:
- R1: 7,300 (Key psych level)
- R2: 7,434 (50-day MA)
- R3: 7,600
— Written by Tammy Da Costa, Analyst for DailyFX.com
Contact and follow Tammy on Twitter: @Tams707
Be the first to comment