

amriphoto/E+ via Getty Images
Throughout human history, few commodities have been as important as wood. We use it in almost all aspects of life, ranging from housing, to packaging, to everyday products used around the home, and more. So, it stands to reason that there might be some interesting companies that create such products that make for interesting investment prospects. One firm for investors to consider is UFP Industries (NASDAQ:UFPI). In recent years, the business has grown at a rapid pace and created a significant amount of shareholder value. Unfortunately, there is some uncertainty over how fast the firm should grow moving forward, driven in large part by the number of acquisitions that it has engaged in in order to facilitate us growth. In the best case, shares of the company look deeply undervalued. And even in the worst case, they probably are not more expensive than fairly valued. As such, this could make for an interesting play for growth-oriented investors who don’t want to pay a hefty premium for the growth that they receive.
A look into UFP Industries
UFP Industries is a fairly large enterprise. According to management, the company owns and operates 216 facilities worldwide. The vast majority of these are located in the US, with a handful split between the UK and Canada. The company also has operations in the UK, Italy, India, China, Japan, and Australia. Of course, as the location of its facilities suggests, the bulk of the company’s revenue does come from the US. In all, only 5% of its revenue comes from international operations.
At present, UFP Industries operates three different segments. The first of these is its UFP Retail Solutions. This segment is responsible for manufacturing and selling a variety of brands to retail clients, including big box stores and buying co-ops. Brands include Deckorators wood decking and Outdoor Essentials. According to management, this segment is responsible for 39.9% of the company’s sales and 27.6% of its profits. Next in line is the UFP Construction segment. This accounts for 24.6% of the company’s revenue and 31.8% of its profits. It largely provides wood and wood-related products to single-family, multi-family, and commercial property manufacturers. It also provides full-service, turnkey project management solutions for its clients. Then, we have the UFP Industrial side of the business. This part of the company provides structural packaging solutions, such as wood, steel, and mixed material crates, related components, and more, to its major clients. This particular segment accounted for 31.6% of the company’s revenue and 30.4% of its profits. Other operations that don’t fall into these segments make up the remaining 3.9% of sales and 10.2% of profits based on results from the first quarter of the company’s 2022 fiscal year.
Author – SEC EDGAR Data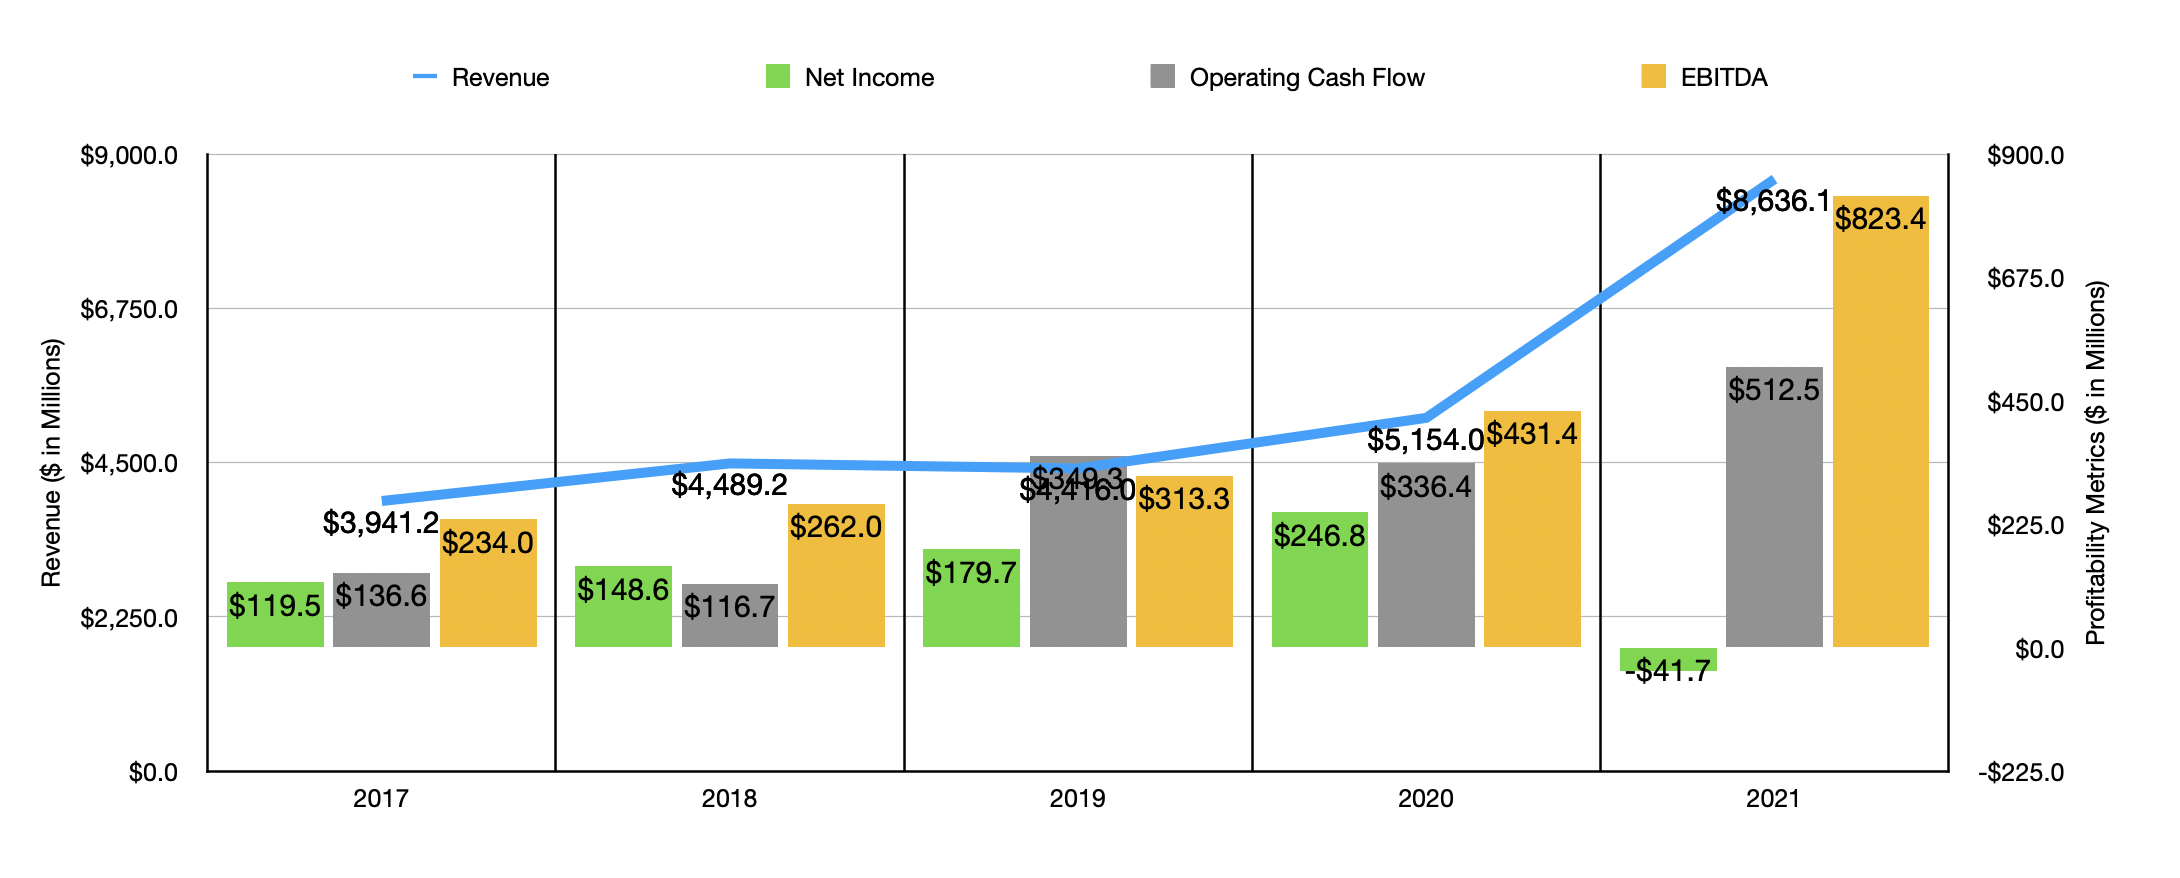
In recent years, the growth exhibited by UFP Industries has been impressive. The company went from generating $3.94 billion in revenue in its 2017 fiscal year to $8.64 billion in 2021. Despite the COVID-19 pandemic, sales still increased by 16.7% from 2019 through 2020. Growth has continued into the 2022 fiscal year, with revenue in the first quarter coming in at $2.49 billion. That is 36.4% higher than the $1.03 billion the company generated the same time a year earlier. Naturally, much of this growth has been achieved through acquisition-based activities. In 2020, for instance, the company acquired assets that would add on $101 million of combined sales to its top line. Throughout 2021, it made acquisitions that would add on $1.28 billion in revenue per year. The largest of these was a company that generates $698 million a year and that boasts 17 manufacturing facilities in its portfolio. The company continued to make purchases into the current fiscal year. In its quarterly report for its first quarter, it made purchases that will add $675.5 million in annual revenue to its books in exchange for cash consideration of $241.1 million. It is worth mentioning how much recent high prices on wood products have impacted the company. Of the nearly 68% rise in revenue the company saw in 2021 compared to 2020, only 24% was driven by increased volumes brought on by acquisitions. A paltry 4% was due to organic growth. By comparison, higher pricing made up 40% of the increase the company experienced.
Author – SEC EDGAR Data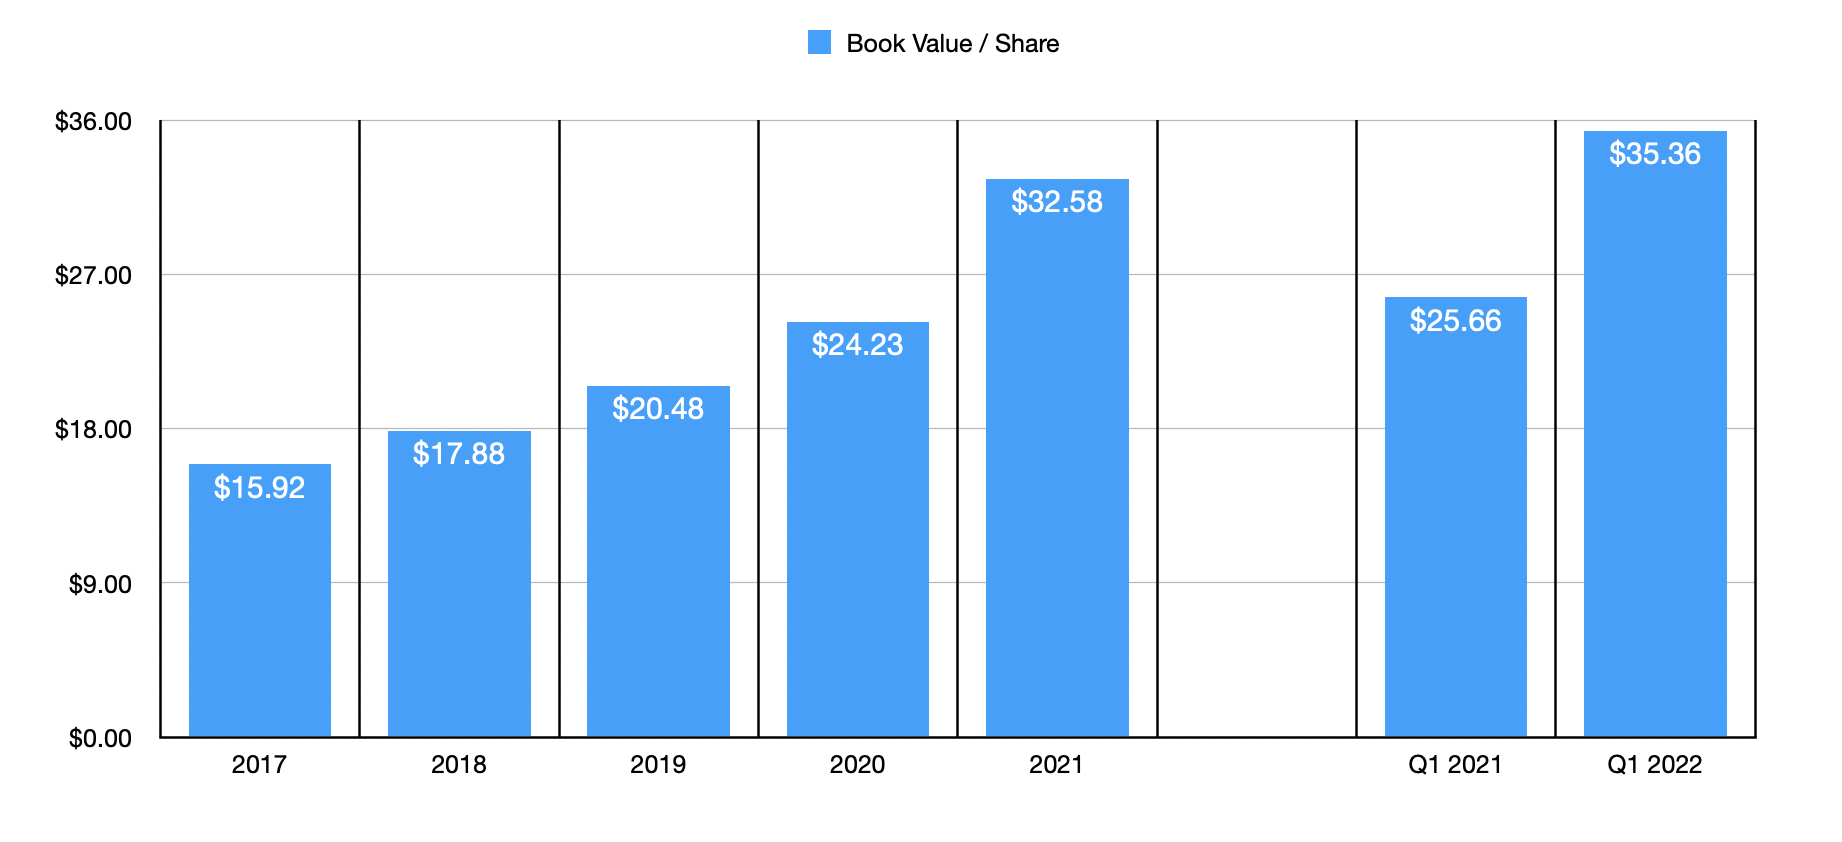
While the revenue trajectory of the company has been consistent, some of the profitability metrics of the business have been a bit more volatile. For instance, take operating cash flow. In 2017, this metric came in at $136.6 million. It declined in 2018 to $116.69 million. Then, in 2019, it surged to $349.29 million. In 2020, it dipped slightly to $336.48 million before shooting up further to $535.6 million last year. Fortunately, net income has been more consistent. It rose every year, climbing from $105.50 million in 2016 to $253.88 million in 2020. EBITDA, meanwhile, has grown from $234 million in 2017 to $823.4 million last year. This kind of bottom line growth should not be surprising given the large increase in selling price the company has seen from its products. Price improvements without a corresponding increase in costs can have a huge impact on companies with low margins. For instance, based on 2021 results, a 1% improvement in the company’s net profit margin would increase its bottom line by $86.36 million, or by 16.1% compared to the net income the business reported for that year. It is also worth mentioning that the company’s book value of equity has risen over time, climbing from $15.92 per share in 2017 to $24.23 per share in 2020. It then saw a further rise to $32.58 last year.
Author – SEC EDGAR Data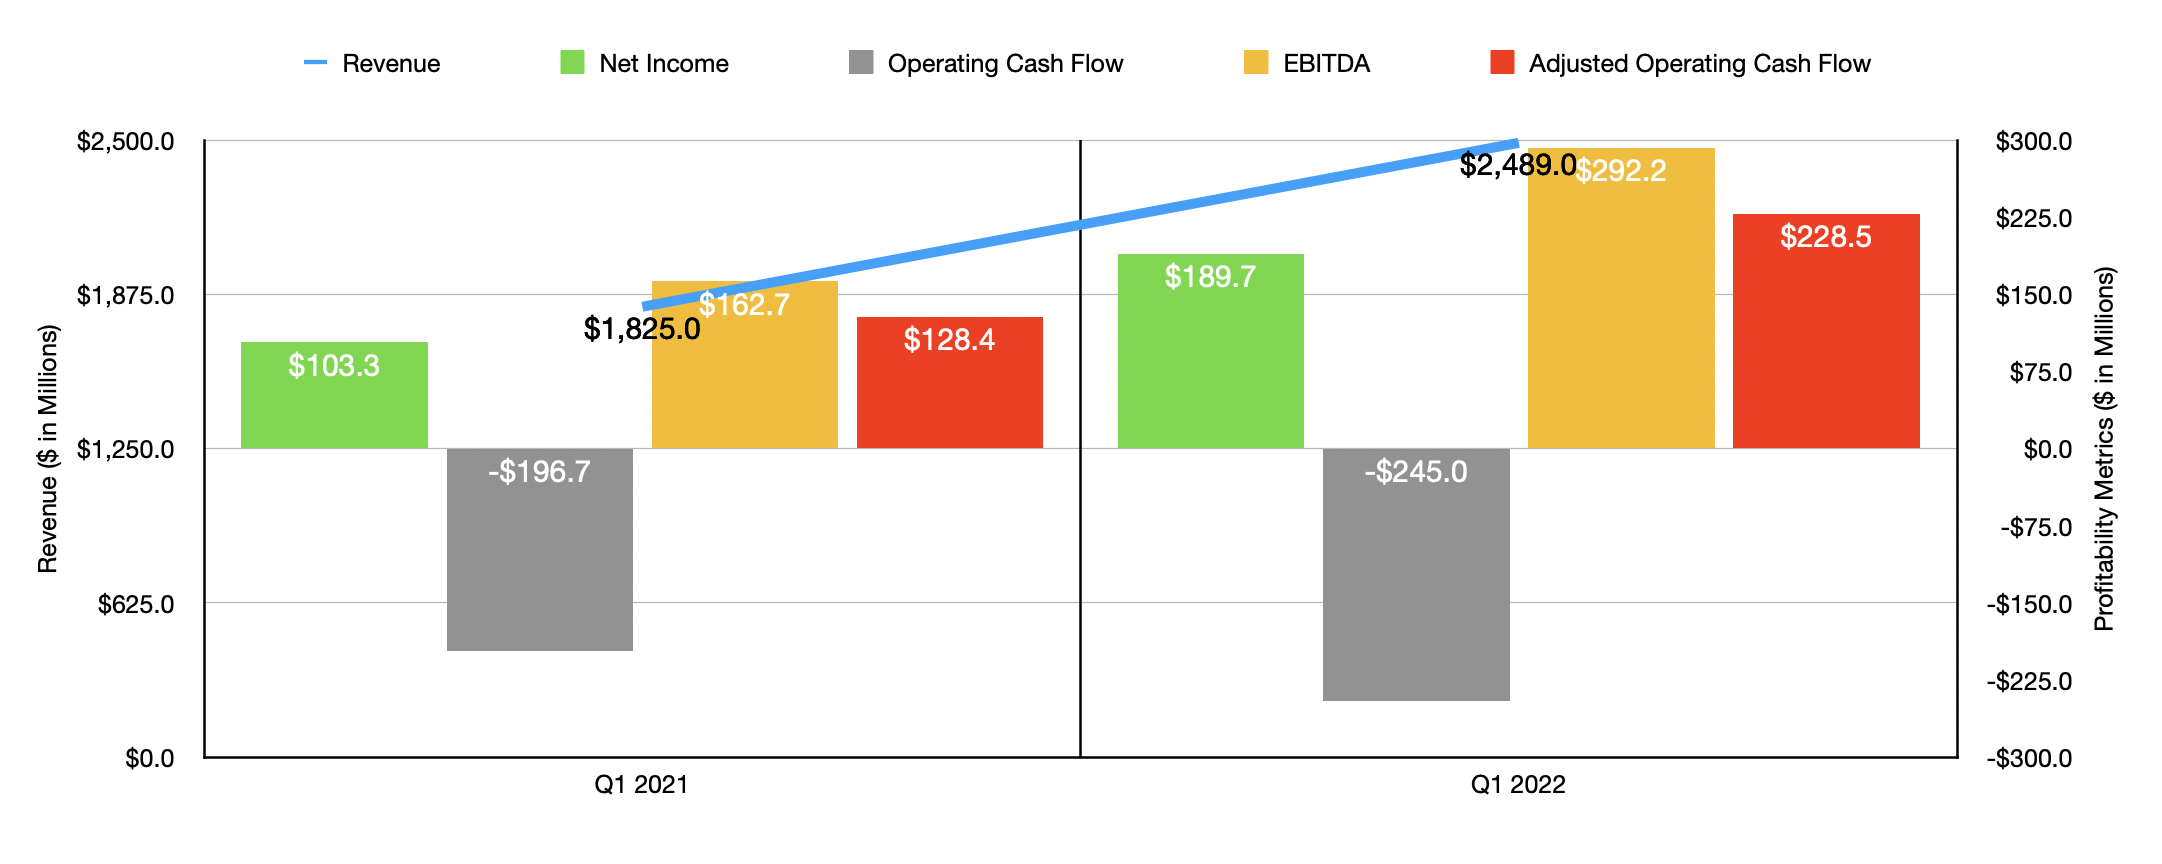
This kind of volatility has continued into the current fiscal year. Operating cash flow at the company went from negative $196.7 million in the first quarter of the company’s 2021 fiscal year to negative $245 million in the first quarter of 2022. If we adjust for changes in working capital, however, cash flow would have gone from $128.4 million to $228.5 million. Net income, meanwhile, rose significantly. In the first quarter of 2021, it came in at $103.3 million. Then, in the first quarter of this year, it clocked a figure of $189.7 million. UFP Industries’ book value of equity has continued to rise this year, hitting $35.36 per share in the first quarter of 2022. That represents an increase of 37.8% over the $25.66 per share reported for the first quarter one year earlier.
Pricing such a fast-growing business is a real challenge. In part, because you don’t know what kind of activities the company will undertake to further spur growth and what those activities will cost it. So, I decided to take this from a three-pronged perspective. Valuing the company off of 2021 results would give us a price-to-earnings multiple for the business of 7.9. The price to operating cash flow multiple would come in at 8.2, while the EV to EBITDA multiple would be even lower at 5.6. If we annualize results seen in the first quarter of this year, the numbers look even better, with multiples of 4.4, 4.6, and 3.1, respectively. Of course, investors need to be wary of assuming that the future will look much like the recent past has been. Elevated prices for its products may not persist, especially if we go into a recession. If, instead, we assume that financial performance reverts to 2020 levels (which would completely ignore all of the acquisitions management completed), then these multiples would be 17.1, 12.6, and 10.6, respectively. While not amazing, those are still very investable numbers.
Author – SEC EDGAR Data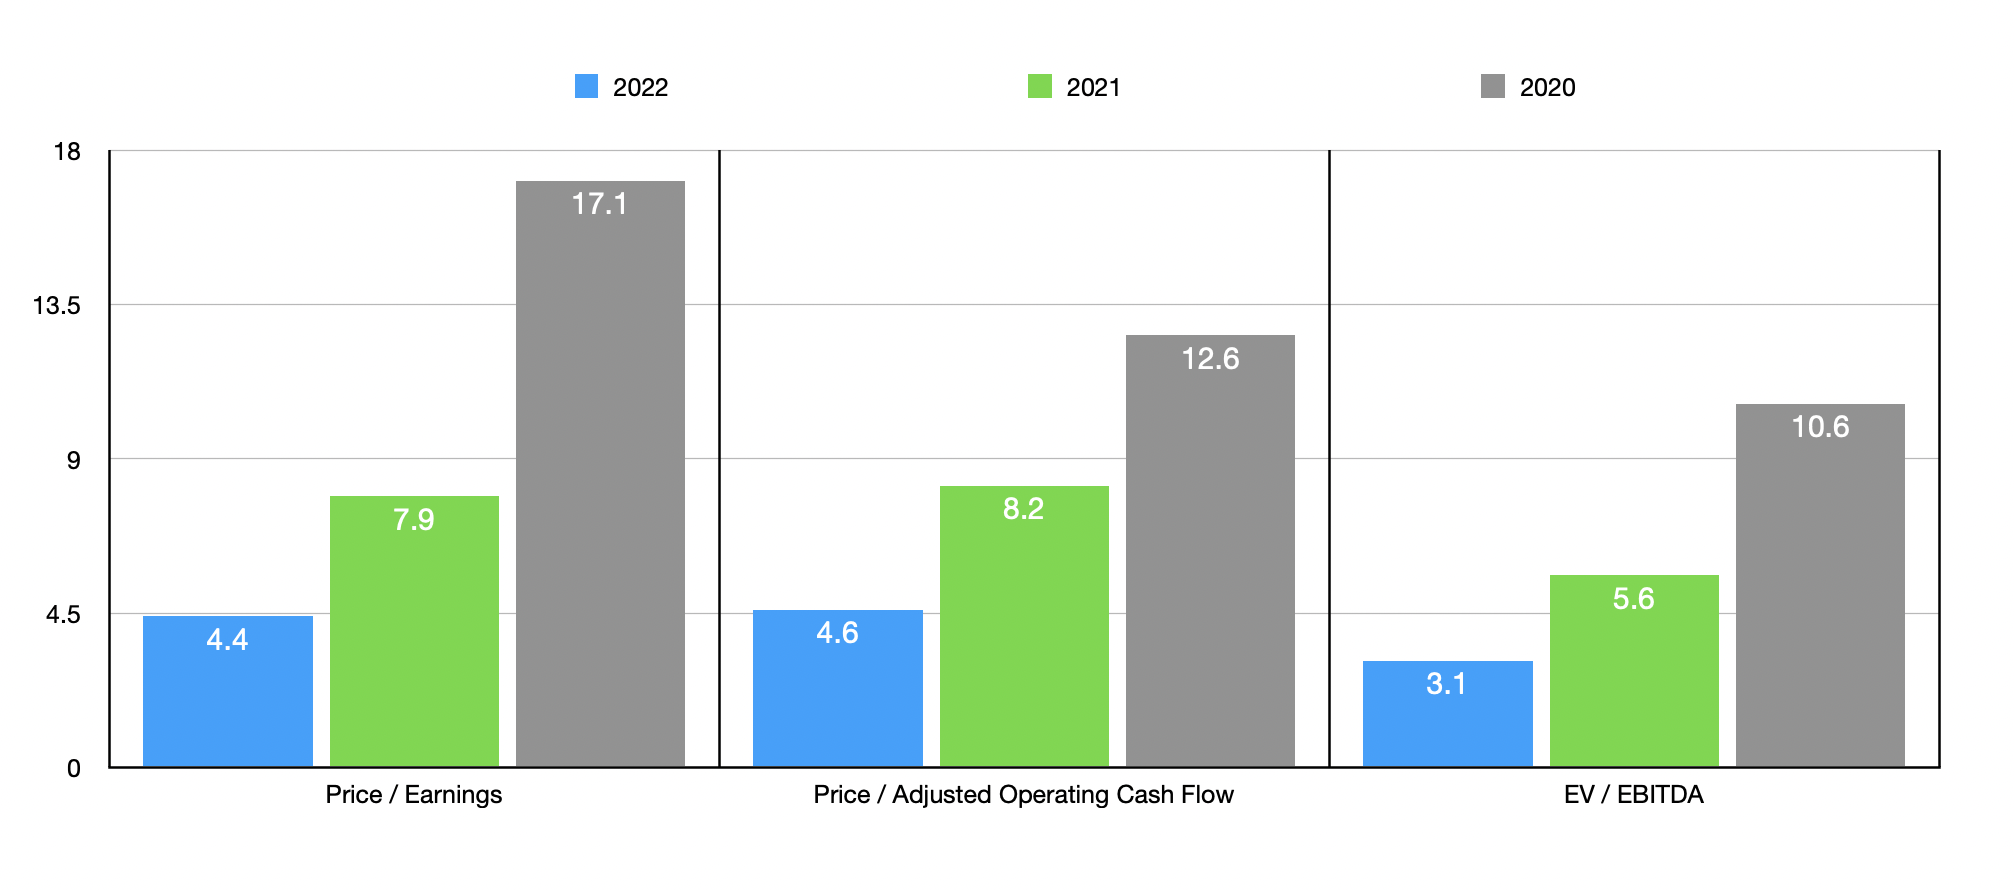
As part of this analysis, I then decided to compare the company to the five similar companies. On a price to operating cash flow basis, the companies ranged from a low of 12.1 to a high of 34.6. Using the figures from 2021, all five companies were cheaper than our target. I then did the same thing with the EV to EBITDA approach, giving me a range of 7.6 to 33.8. In both cases, UFP Industries was the cheapest of the bunch. Using the price-to-earnings approach, meanwhile, the range was from 10.9 to 33.3. Once again, UFP Industries was the cheapest of the firms.
| Company | Price / Earnings | Price / Operating Cash Flow | EV / EBITDA |
| UFP Industries | 7.9 | 8.2 | 5.6 |
| Simpson Manufacturing (SSD) | 13.7 | 23.9 | 8.4 |
| Armstrong World Industries (AWI) | 19.3 | 20.0 | 11.0 |
| Zurn Water Solutions (ZWS) | 33.3 | 34.6 | 33.8 |
| Hayward Holdings (HAYW) | 15.6 | 14.3 | 10.5 |
| Resideo Technologies (REZI) | 10.9 | 12.1 | 7.6 |
Takeaway
Valuing companies is sometimes easy. But more often than not, it is tricky. UFP Industries fits into the latter category. Frankly, we can’t know what the future will hold for the business. More likely than not, growth will continue near term and financial performance will expand nicely. In this likely scenario, shares of the firm look very cheap. But even if we assume that the company reverts to what it saw in 2020 and stays there, shares look fairly attractive. At worst, they could be considered fairly valued, but I would say that is a stretch. All of this leads me to believe that investors who are interested in an attractive long-term prospect should consider this firm as a viable enterprise to invest in.
Be the first to comment