

FINTWIT ANALYSIS
- COVID-19 concerns cause WTI Crude to fall as markets recalibrate.
- Challenging environment sees Alibaba miss estimates forecasts look positive.
- TRY slumps as Turkey continues to ease monetary policy, EM’s suffer.
PANDEMIC FEARS HALT WTI PRICE ACTION AFTER FALL IN U.S. CRUDE OIL INVENTORIES
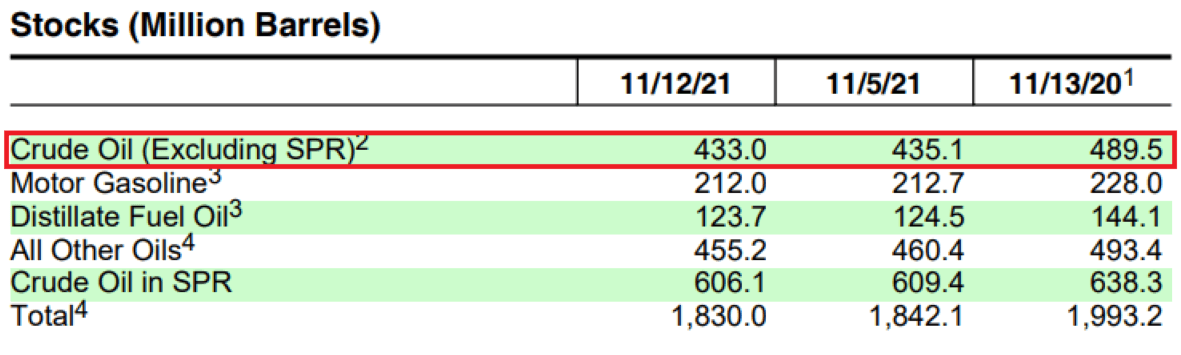
U.S. crude (WTI) oil resumes its decline after hopes of an upside reversal were fueled by a surprising decline in U.S. stocks (see table below).
U.S. WEEKLY PETROLEUM STATUS REPORT (INVENTORIES):
Source: IEA
Reemergence of COVID-19 in Europe (see graphic below) via Austria and Germany pressed the Austrian government to impose a lockdown along with the worlds first national vaccine directive. While Germany may push back on such an extreme decision to make vaccination compulsory, markets have quickly reacted to these uncertainties. Crude oil saw falling prices as markets hesitation around global demand and economic growth shine through.
EUROPEAN NEW COVID-19 CASES:
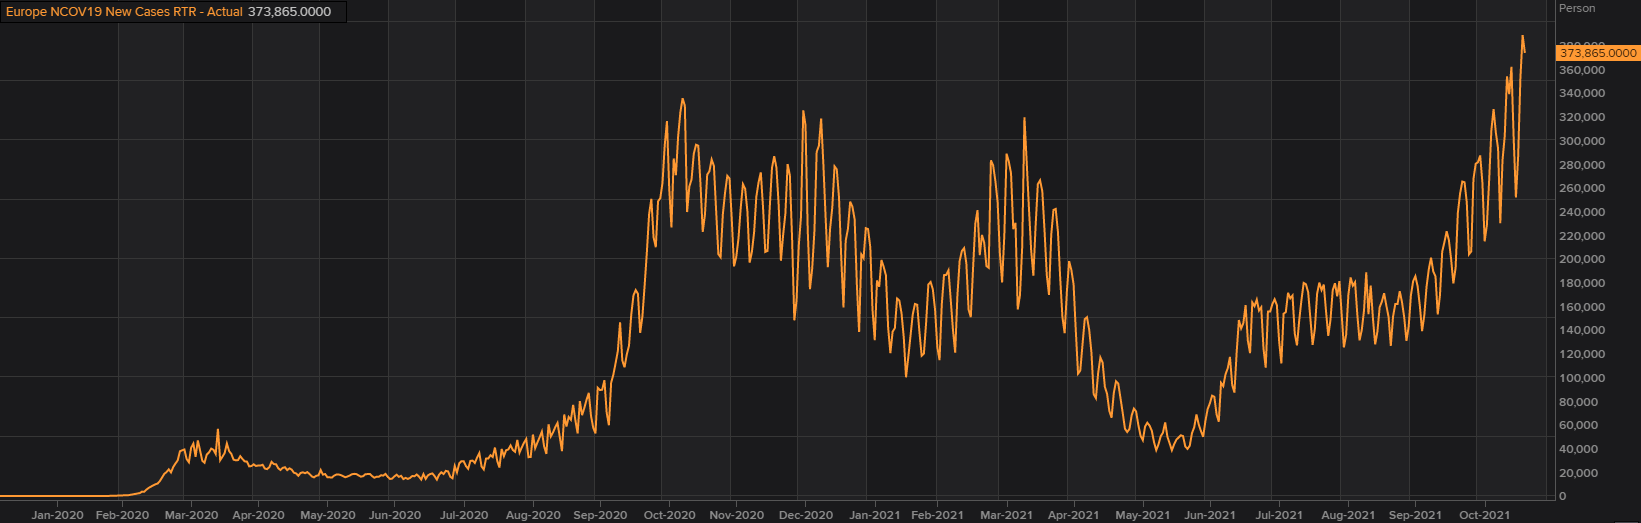
Chart prepared by Warren Venketas, Refinitiv
U.S. WTI CRUDE OIL (CLc1) DAILY CHART
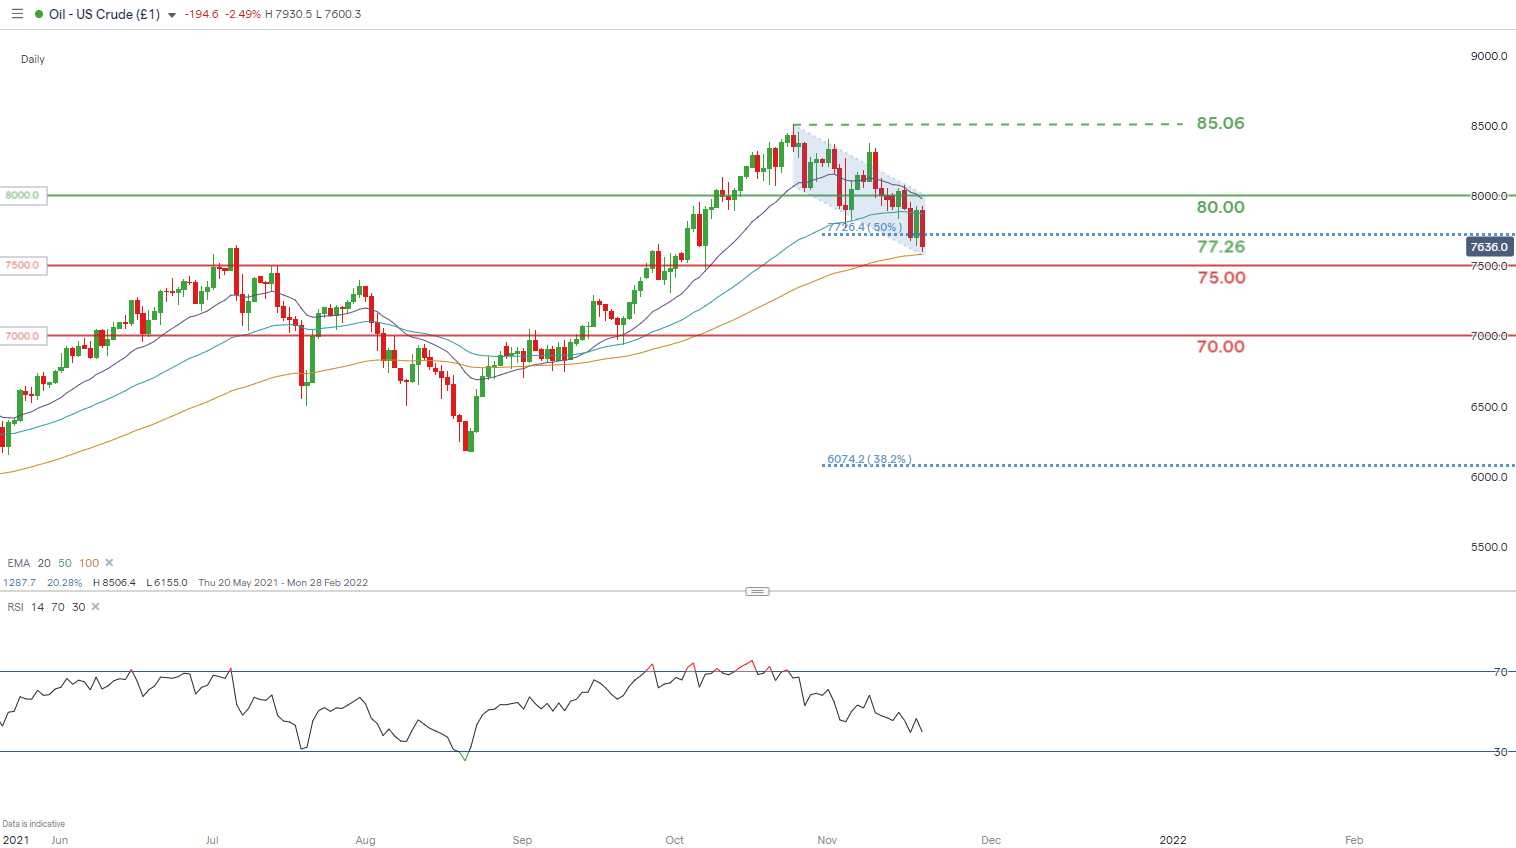
Chart prepared by Warren Venketas, IG
U.S. WTI crude has been on a steady downward trajectory now representative of a bull flag pattern (blue). This pattern is traditionally associated with bullish continuation should prices break above flag resistance. Should COVID-19 fears soften, we could see this unfold.
Price action exposes bearish pressure on the 100-day EMA (yellow) and consequently the 75.00 psychological handle.
The Relative Strength Index (RSI) is supportive of sustained downside momentum and has further room until it breaches oversold territory. This could coincide with the 75.00 level after which we may see a flag break to the upside.
Key resistance levels:
Key support levels:
- 100-day EMA (yellow)
- $75.00
ALIBABA FALLS SHORT OF ESTIMATES BUT FAR FROM DISSAPOINTING
Despite Alibaba trading almost 38% lower year-to-date on the back of several headwinds including Chinese government regulation, the tech giant has maintained decent financials. Contrary to the falling share price this week, Alibaba’s revenue (red) presented a slight slowdown QoQ. This is comparatively commensurate with its peers including Amazon (see graphic below).
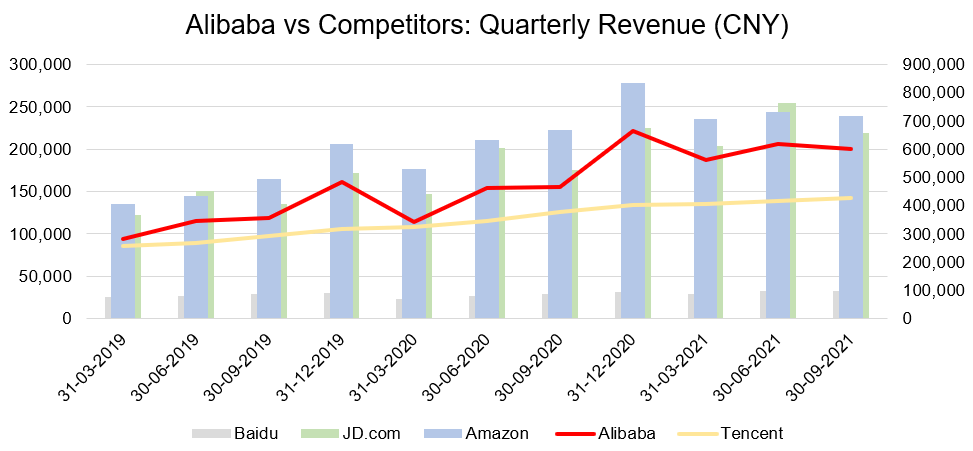
Chart prepared by Warren Venketas, Refinitiv
Drops in revenue were consistent since late 2020 due to COVID-19 lockdowns which prompted a surge in online shopping. Keeping in mind that economies are mostly free of lockdowns and the high base figures in 2020, Alibaba’s latest quarterly financials are impressive. The fundamentals remain solid however after the record $2.8bn fine it received in April, crackdown by the Chinese government, second consecutive estimate miss and the rise of JD.com have drawn investors away. This being said, Chinese tech in general has seen a drop off in share price while U.S. tech stocks continue to grind higher. Buying opportunities may be presenting themselves for Chinese tech as the gravity of Chinese regulation dissipates.
HANG SENG TECH INDEX DIVERGENCE FROM U.S. FANG INDEX:
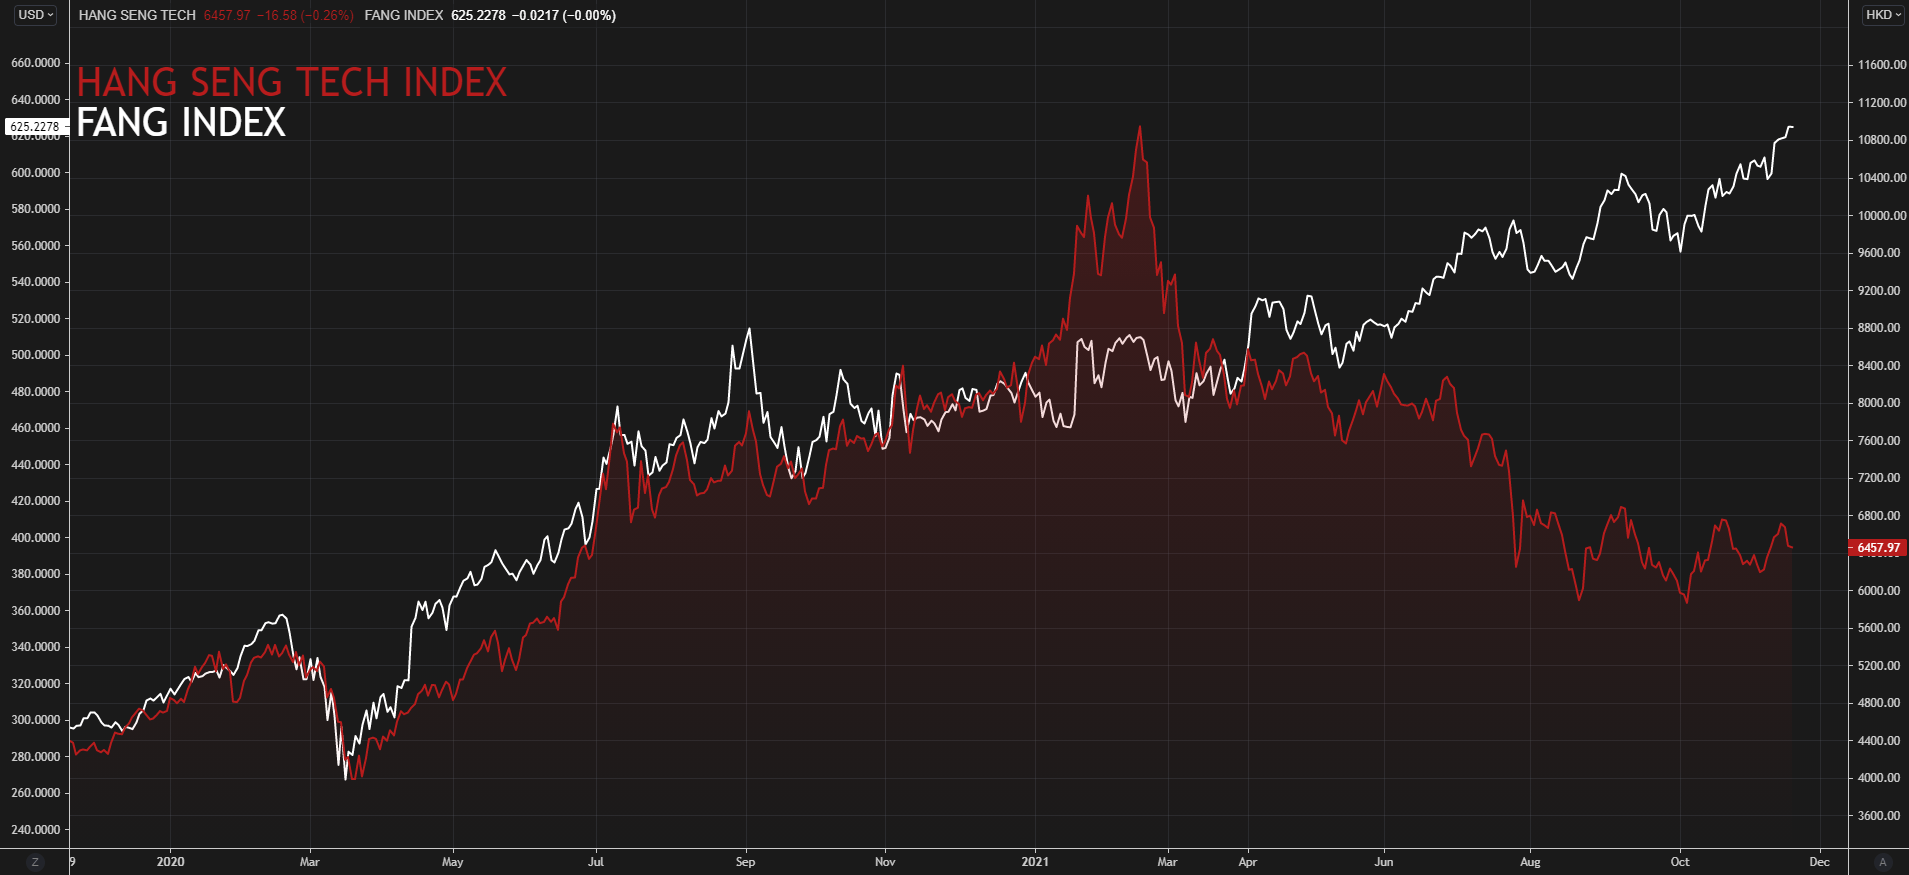
Chart prepared by Warren Venketas, Refinitiv
Boost your stock market knowledge with our articles on the types of stocks available, how equities impact the economy, and getting started with stock trading.
Headwinds facing Alibaba:
- Increased competition.
- Slowing Chinese growth forecast.
- Regulation on Chinese tech companies.
Alibaba upside factors:
- Good fundamentals.
- Undervalued.
- User growth.
ALIBABA WEEKLY CHART
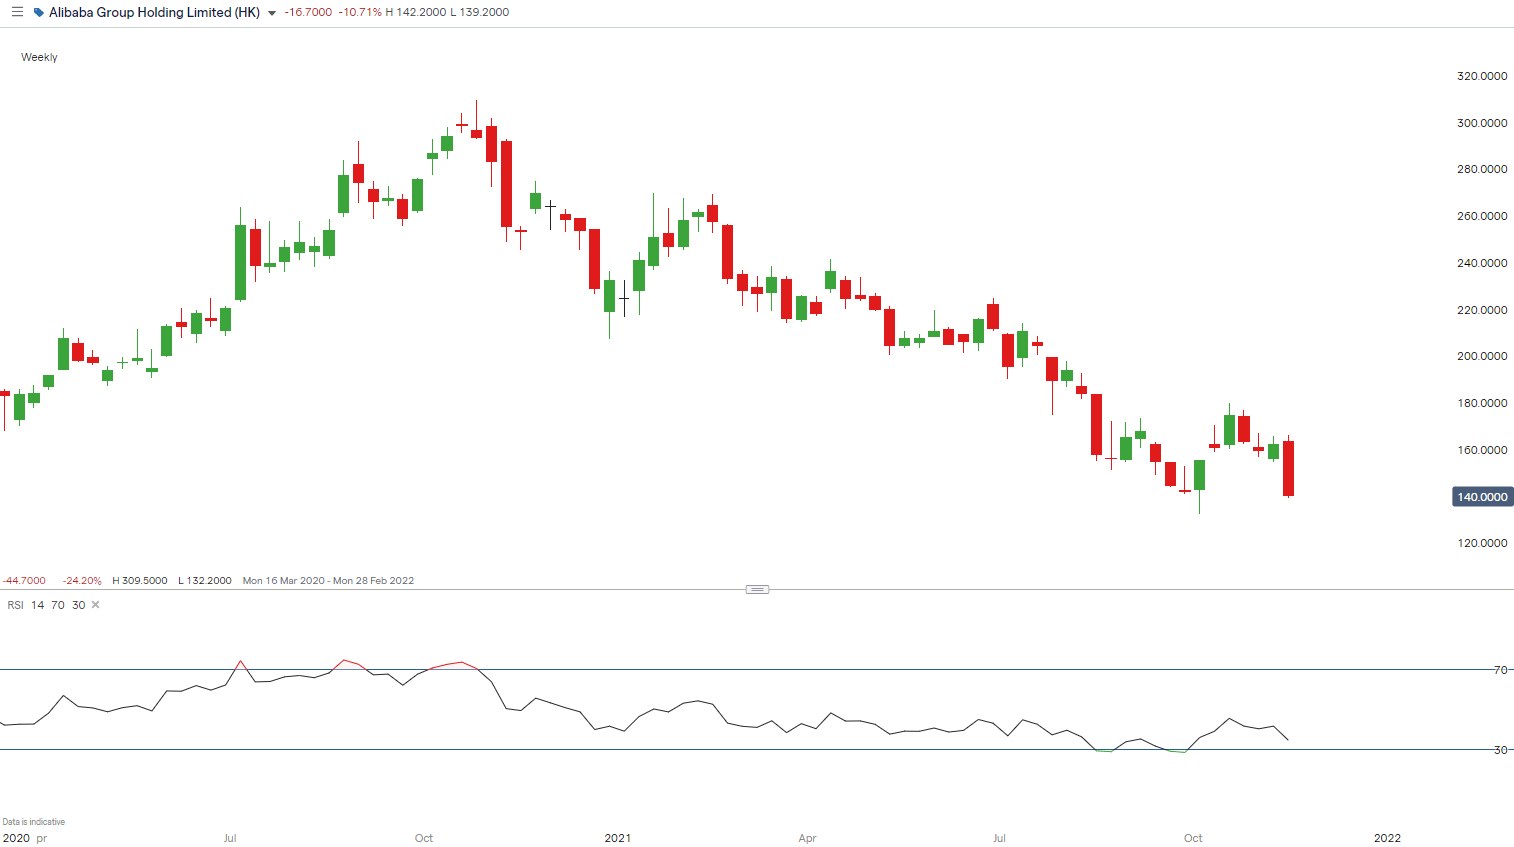
Chart prepared by Warren Venketas, IG
TURKEY’S RATE DECISION HURTS EM’S
The Central Bank of Turkey (CBT) cut rates as expected by 100bps to encourage economic growth while maintaining the transitory inflation viewpoint. CBT mentioned ending the cutting cycle in December which could point to another cut before year end. The Lira is extremely vulnerable to additional downside which can spread to other Emerging Market (EM) currencies. The chart below shows the high positive correlation between EM currencies and the Turkish Lira. The instability associated with the TRY has filtered through to other EM’s and even hurt the South African Rand yesterday after a SARB rate hike.
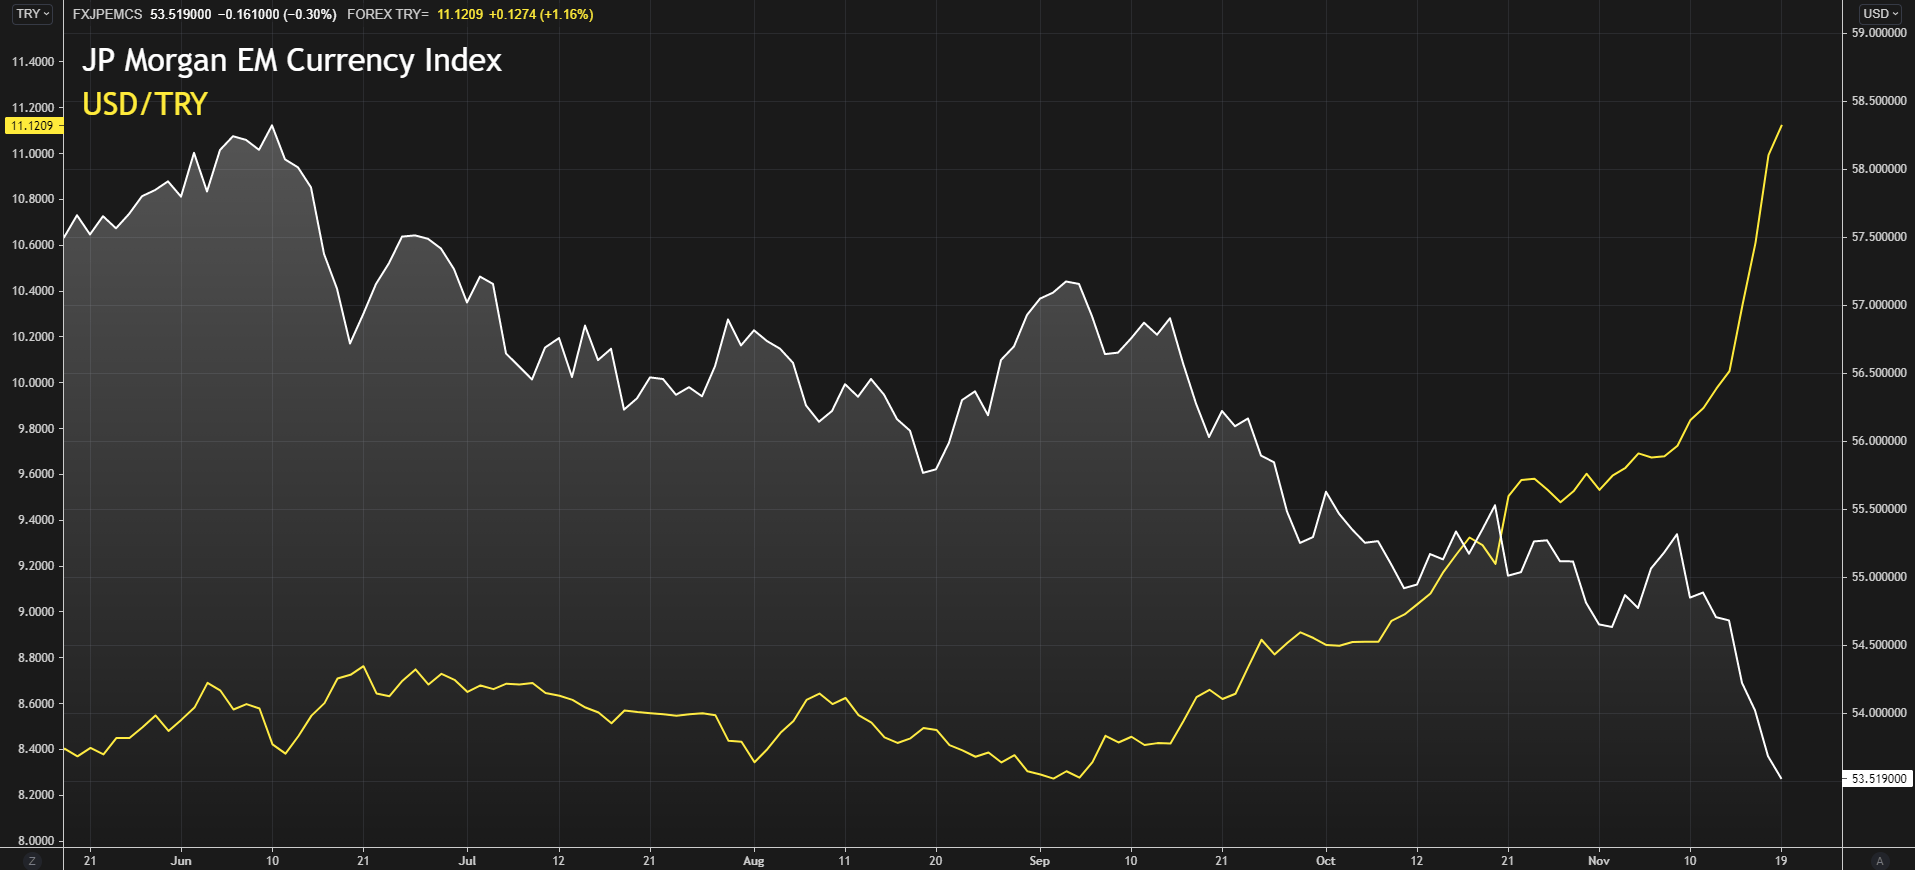
Chart prepared by Warren Venketas, Refinitiv
An uptick in COVID-19 concerns from Europe (Austrian lockdown) has seen EM’s extended their fall this week and could likely push through to next week depending on additional data.
USD/TRY DAILY CHART
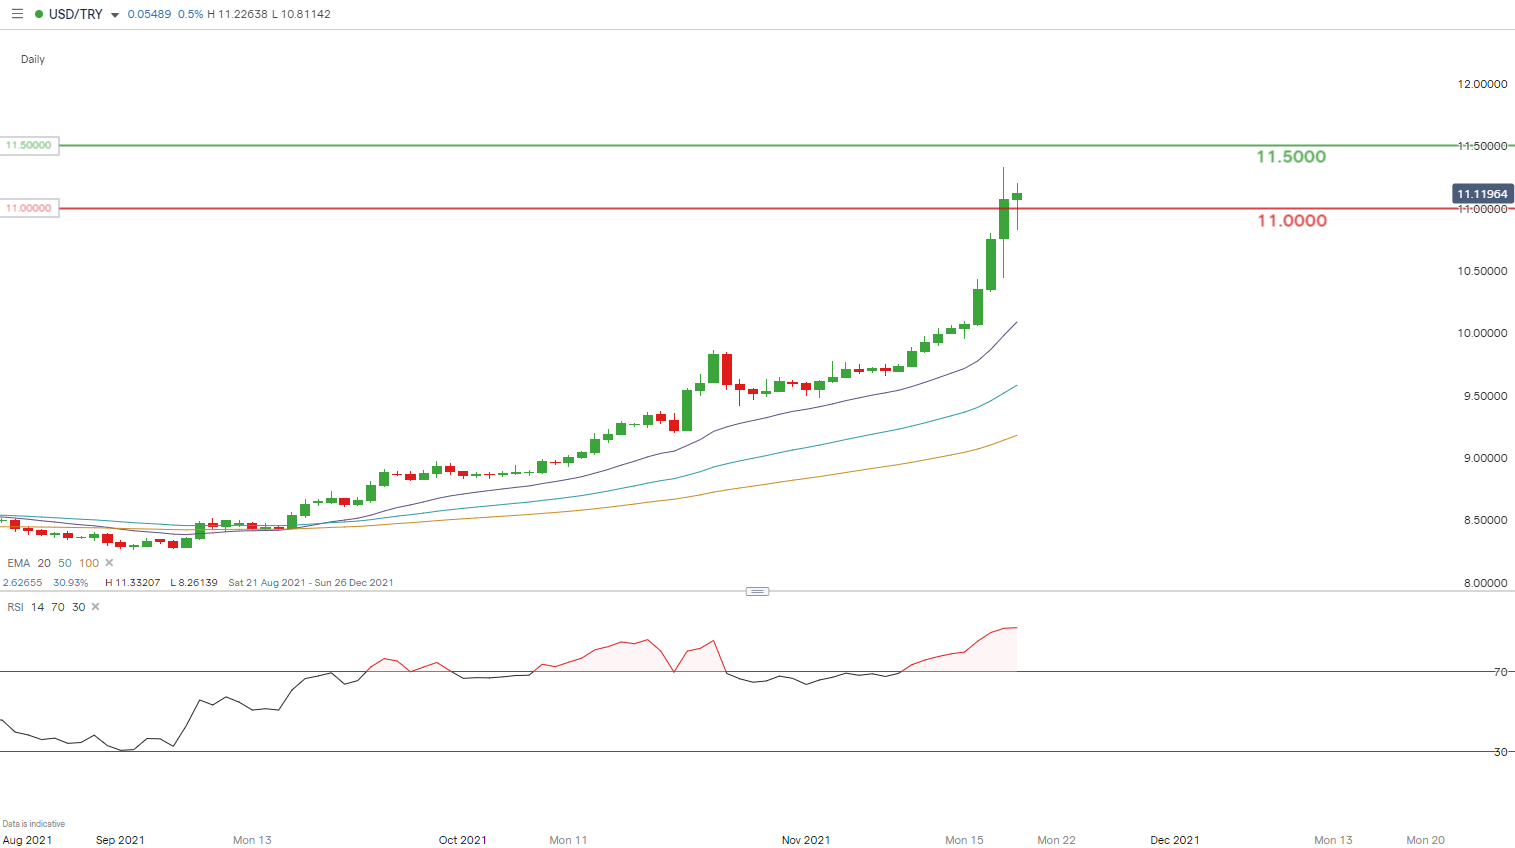
Chart prepared by Warren Venketas, IG
The USD/TRY daily chart above shows the pair reaching all-time-highs yesterday and may push higher towards 11.5000 should COVID-19 contagion fears persist.
The Relative Strength Index (RSI) lingers in the overbought zone and may suggest a potential correction lower along with reversion to the mean however, political risk in Turkey makes estimates difficult at this point.
Contact and follow Warren on Twitter: @WVenketas
Be the first to comment