

By Philip Lawlor, managing director, Global Markets Research
Global equities posted the strongest monthly gains in years (if not decades) in April, recouping much of their pandemic-driven losses since late February. Markets rode hopes that sustained central-bank liquidity support and moves to end lockdowns in many countries could soon help kick-start economic activity – even as incoming data grew increasingly grimmer.
US stocks led the April relief rally: the Russell 1000 rose 13.2% for the month, and the US small cap Russell 2000 did even better, rising 13.7%. Both were well ahead of developed-market peers and the FTSE All-World ex US, which gained 7.7% for the month. The year-to-date COVID-19 toll has been far less severe for US stocks than for equity markets elsewhere.
Global equity total returns – April and YTD 2020 (local currency, %)
Source: FTSE Russell. Data as of April 30, 2020. Past performance is no guarantee to future results. Please see the end for important disclosures.
Healthcare overweight gives Russell 2000 an edge
April also marked a major reversal in fortunes for the Russell 2000, which had lagged its large-cap counterpart in both the March meltdown and early in the rebound as investors gravitated to companies with bigger, more stable businesses and solid balance sheets. The April rebound pared the Russell 2000’s YTD loss to 21.1%, roughly halving the large performance gap with the Russell 1000 that had opened up this year.
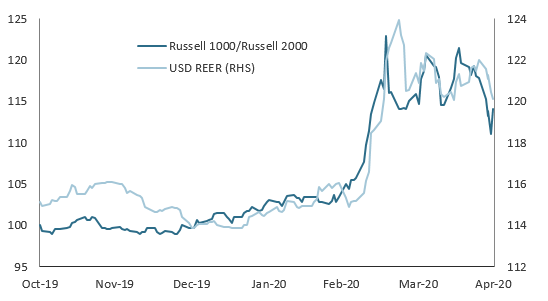
The relative performance between US large and small cap stocks has followed big risk-on/risk-off swings in the US dollar. At this height of year’s pandemic panic, both large caps and the dollar gained from the massive investor flight to safety. But as these risk-off extremes have subsided, the stocks of smaller, more domestically oriented stocks that are in a better position to benefit from fiscal stimulus efforts and the Fed bond-buying (particularly of high-yield debt) gained favor.
Russell 1000 relative to Russell 2000 (TR, rebased) vs. USD real effective exchange rate
Source: FTSE Russell. April 30, 2020. Past performance is no guarantee of future results. Please see the end for important legal disclosures.
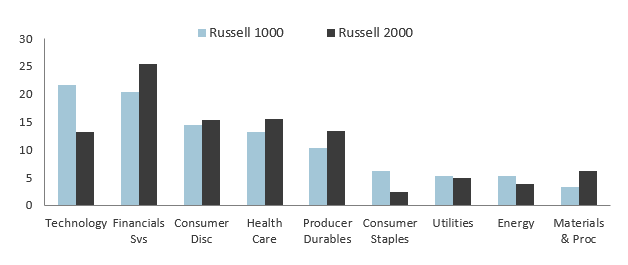
The strong US performance played on the strengths of each Russell index’s sector strengths. The Russell 1000 has a far bigger exposure than its small-cap counterpart to the technology heavyweights (i.e., the FAANGs) that have disproportionately powered the April rally. In turn, the Russell 2000’s edge came from its overweights in outperforming healthcare and consumer discretionary stocks.
The small-cap index’s exposures also tilt more toward cyclically sensitive industries such as financial services, materials and heavy-equipment producers that tend to perform better in periods of rising risk appetite.
Sector weights (%)
Source: FTSE Russell. April 30, 2020. Past performance is no guarantee of future results. Please see the end for important legal disclosures.
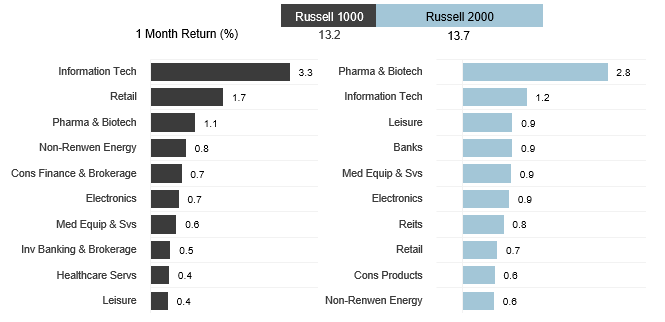
The chart below dissects the two performances even further: on an industry-weighted basis, the information technology sub-group was the Russell 1000’s top performer, contributing a quarter of the index’s total April returns, while the pharmaceutical and biotech sub-group was the Russell 2000’s top performer, accounting for 20% of its gains for the month (medical equipment added another 7%).
Top 10 industry-weighted contributions to total April 2020 returns (%)
Source: FTSE Russell. April 30, 2020. Past performance is no guarantee of future results. Please see the end for important legal disclosures.
© 2020 London Stock Exchange Group plc and its applicable group undertakings (the “LSE Group”). The LSE Group includes (1) FTSE International Limited (“FTSE”), (2) Frank Russell Company (“Russell”), (3) FTSE Global Debt Capital Markets Inc. and FTSE Global Debt Capital Markets Limited (together, “FTSE Canada”), (4) MTSNext Limited (“MTSNext”), (5) Mergent, Inc. (“Mergent”), (6) FTSE Fixed Income LLC (“FTSE FI”), (7) The Yield Book Inc (“YB”) and (8) Beyond Ratings S.A.S. (“BR”). All rights reserved.
FTSE Russell® is a trading name of FTSE, Russell, FTSE Canada, MTSNext, Mergent, FTSE FI, YB and BR. “FTSE®”, “Russell®”, “FTSE Russell®”, “MTS®”, “FTSE4Good®”, “ICB®”, “Mergent®”, “The Yield Book®”, “Beyond Ratings®” and all other trademarks and service marks used herein (whether registered or unregistered) are trademarks and/or service marks owned or licensed by the applicable member of the LSE Group or their respective licensors and are owned, or used under licence, by FTSE, Russell, MTSNext, FTSE Canada, Mergent, FTSE FI, YB or BR. FTSE International Limited is authorised and regulated by the Financial Conduct Authority as a benchmark administrator.
All information is provided for information purposes only. All information and data contained in this publication is obtained by the LSE Group, from sources believed by it to be accurate and reliable. Because of the possibility of human and mechanical error as well as other factors, however, such information and data are provided “as is” without warranty of any kind. No member of the LSE Group nor their respective directors, officers, employees, partners or licensors make any claim, prediction, warranty or representation whatsoever, expressly or impliedly, either as to the accuracy, timeliness, completeness, merchantability of any information or of results to be obtained from the use of FTSE Russell products, including but not limited to indexes, data and analytics, or the fitness or suitability of the FTSE Russell products for any particular purpose to which they might be put. Any representation of historical data accessible through FTSE Russell products is provided for information purposes only and is not a reliable indicator of future performance.
No responsibility or liability can be accepted by any member of the LSE Group nor their respective directors, officers, employees, partners or licensors for (a) any loss or damage in whole or in part caused by, resulting from, or relating to any error (negligent or otherwise) or other circumstance involved in procuring, collecting, compiling, interpreting, analysing, editing, transcribing, transmitting, communicating or delivering any such information or data or from use of this document or links to this document or (b) any direct, indirect, special, consequential or incidental damages whatsoever, even if any member of the LSE Group is advised in advance of the possibility of such damages, resulting from the use of, or inability to use, such information.
No member of the LSE Group nor their respective directors, officers, employees, partners or licensors provide investment advice and nothing contained in this document or accessible through FTSE Russell Indexes, including statistical data and industry reports, should be taken as constituting financial or investment advice or a financial promotion.
Past performance is no guarantee of future results. Charts and graphs are provided for illustrative purposes only. Index returns shown may not represent the results of the actual trading of investable assets. Certain returns shown may reflect back-tested performance. All performance presented prior to the index inception date is back-tested performance. Back-tested performance is not actual performance, but is hypothetical. The back-test calculations are based on the same methodology that was in effect when the index was officially launched. However, back- tested data may reflect the application of the index methodology with the benefit of hindsight, and the historic calculations of an index may change from month to month based on revisions to the underlying economic data used in the calculation of the index.
This publication may contain forward-looking assessments. These are based upon a number of assumptions concerning future conditions that ultimately may prove to be inaccurate. Such forward-looking assessments are subject to risks and uncertainties and may be affected by various factors that may cause actual results to differ materially. No member of the LSE Group nor their licensors assume any duty to and do not undertake to update forward-looking assessments.
No part of this information may be reproduced, stored in a retrieval system or transmitted in any form or by any means, electronic, mechanical, photocopying, recording or otherwise, without prior written permission of the applicable member of the LSE Group. Use and distribution of the LSE Group data requires a licence from FTSE, Russell, FTSE Canada, MTSNext, Mergent, FTSE FI, YB and/or their respective licensors.
Editor’s Note: The summary bullets for this article were chosen by Seeking Alpha editors.
Be the first to comment