

alvarez/E+ via Getty Images
The Weather
Last week
Last week (ending Jan. 28), the number of heating degree days (HDDs) increased by 5% w-o-w (from 218 to 230). The total “energy demand” (as measured in total degree days or TDDs) was 12% above last year’s level and as much as 18% above the 30-year average.
This week
This week (ending Feb. 4), the weather conditions in the contiguous United States have been warming up. I estimate that the number of nationwide HDDs will drop by 9% w-o-w (from 230 to 210). The average daily consumption of natural gas (in the contiguous United States) should be somewhere between 113 bcf/d and 116 bcf/d. The total “energy demand” (measured in TDDs) should increase by 12% y-o-y, while the deviation from the norm will moderate but will remain positive (+9.8%).
Next week
Next week (ending Feb. 1), the weather conditions are currently expected to warm up. In absolute terms, however, the weather is projected to remain relatively cold. The number of nationwide heating degree days (HDDs) is currently projected to drop by 7% w-o-w (from 210 to 195). The total “energy demand” (measured in TDDs) should plunge by 17% y-o-y – primarily due to base effects. However, the deviation from the norm will remain positive (+5.3%).
U.S. Energy Demand (TDDs) (NOAA, ECMWF, Bluegold Trader)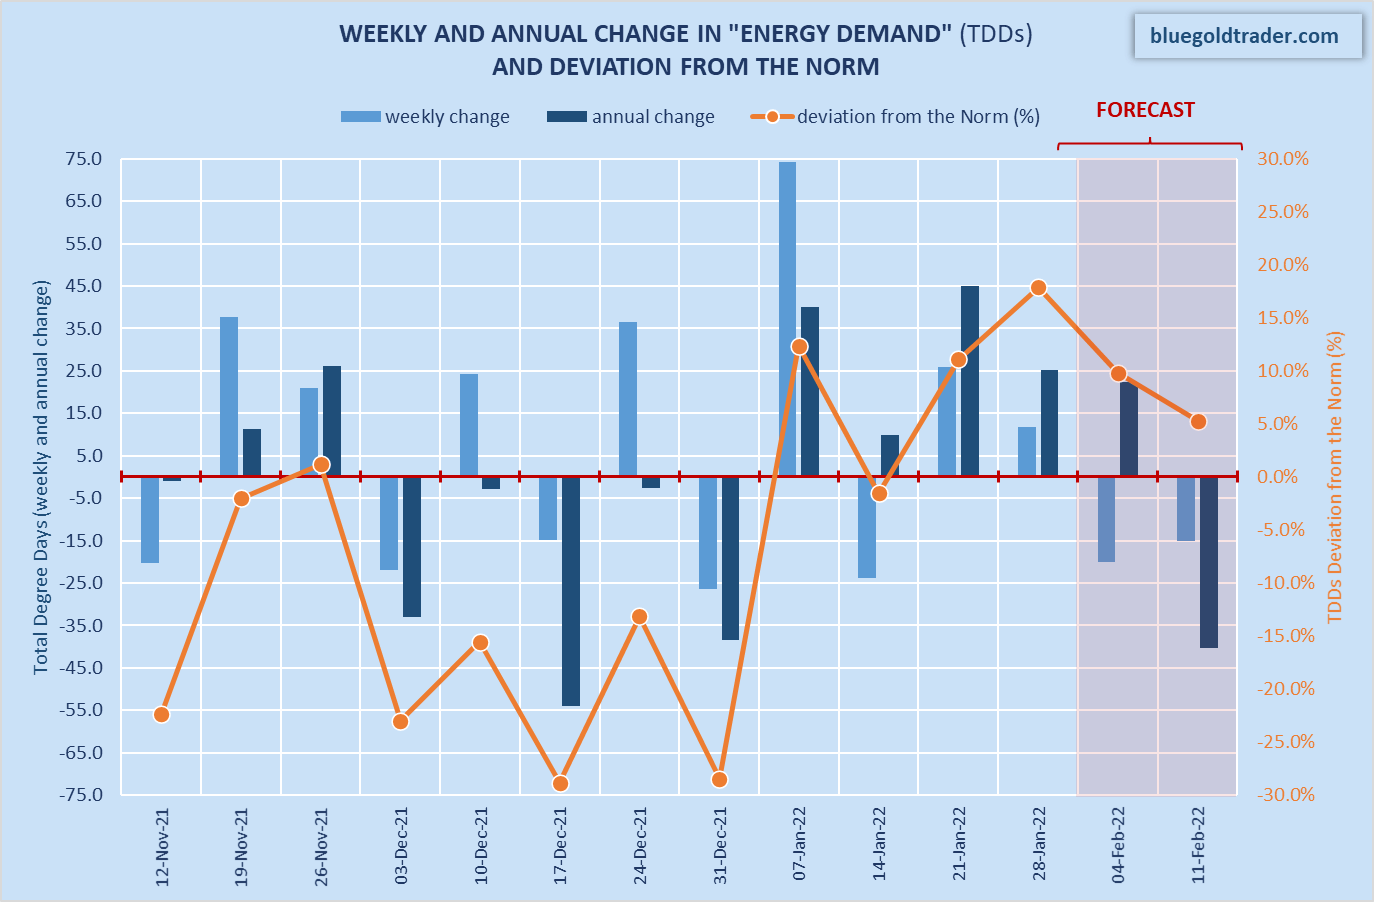
Market Variables
The latest numerical weather prediction models (Wednesday’s short-range 00z runs) agree that over the next 15 days, TDDs will remain mostly above the norm. However, there is a major disagreement between the models in terms of scale. The latest GFS model (00z run) is projecting 107.1 bcf/d of potential natural gas consumption (on average, over the next 15 days) while the ECMWF model (00z run) is projecting 103.4 bcf/d over the same period.
In relative terms, the latest short-range weather models were slightly bearish (vs. the previous update). Specifically, ECMWF 00z Ensemble has “removed” some 9 bcf of potential natural gas consumption compared to yesterday’s 12z results. In absolute terms, projected short-range TDDs are 12.9% below last year’s level but 7.9% above the norm.
U.S. Short-Range Weather Forecast (NOAA, ECMWF, Bluegold Trader)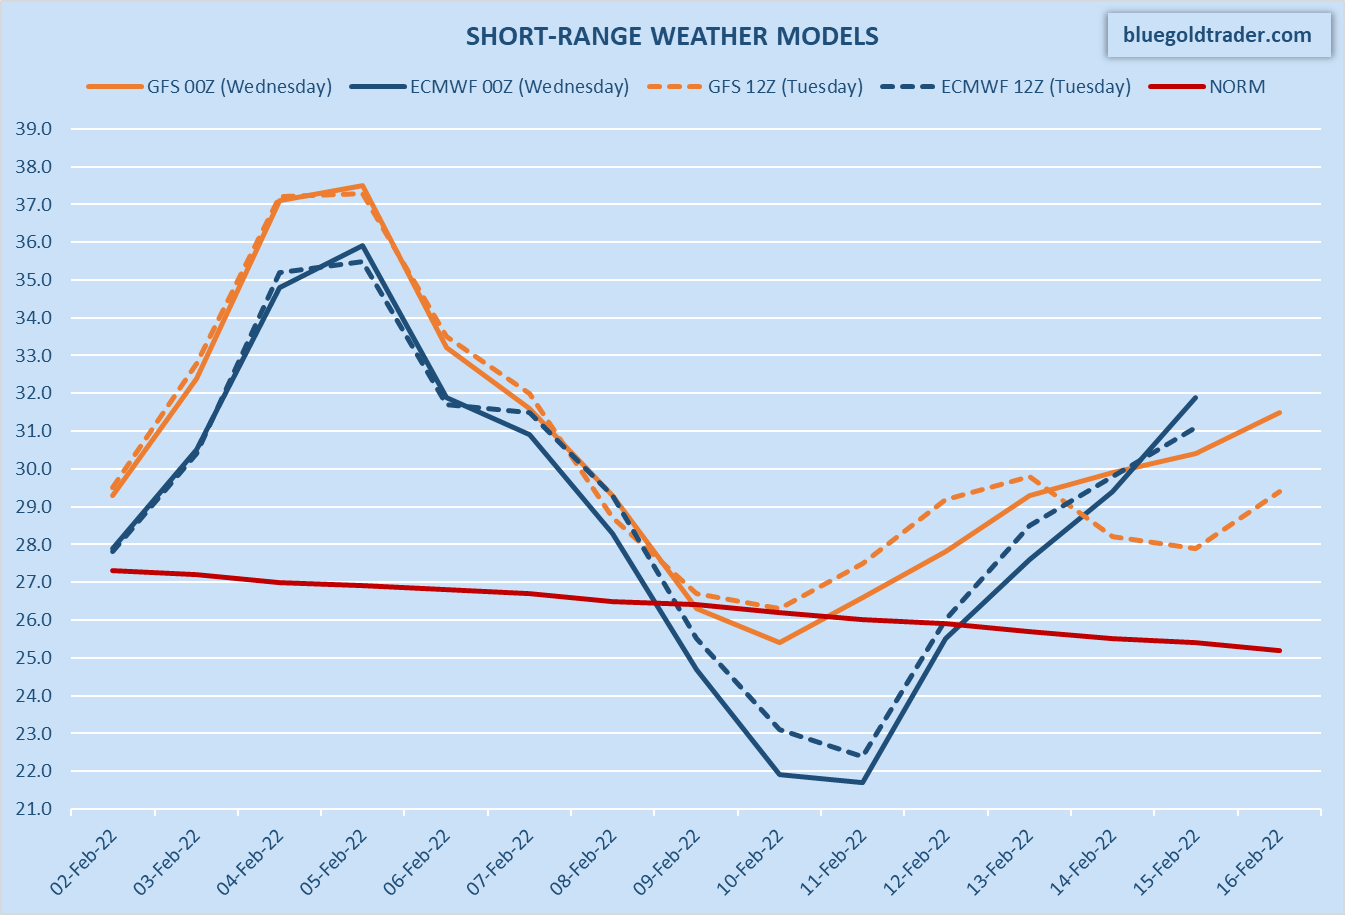
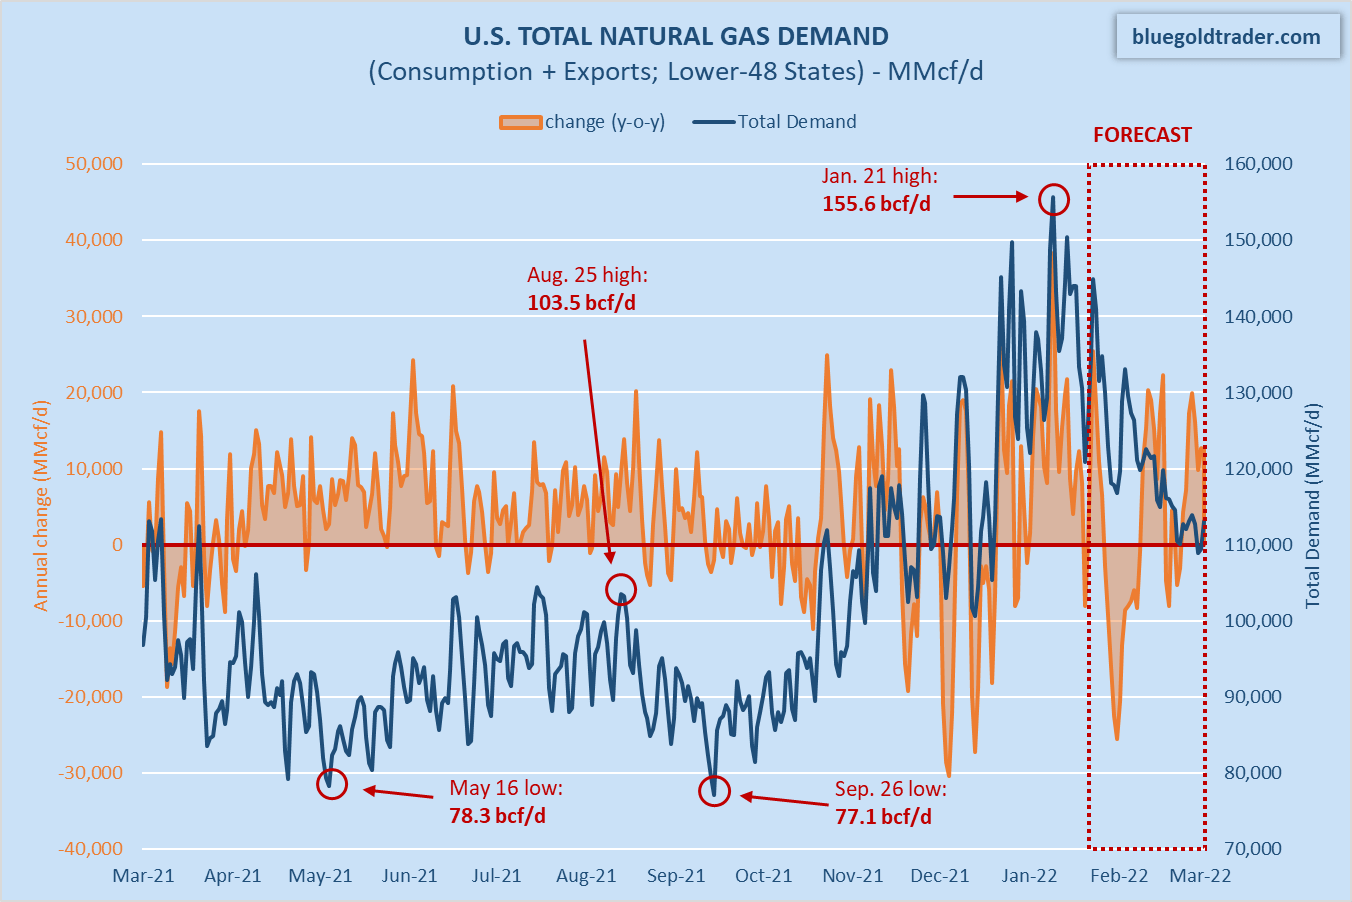
Over the next 30-day period, total natural gas demand (consumption + exports) is expected to average 124 bcf/d (adjusted for probability), 1.5 bcf/d more than a year ago. A seasonal high in daily consumption was reached on January 21 (136.3 bcf/d). Please remember that domestic consumption is an extremely volatile market variable because it is primarily driven by the weather forecast, which is highly unpredictable.
U.S. Natural Gas Consumption (Bluegold Trader) U.S. Natural Gas Demand (Bluegold Trader)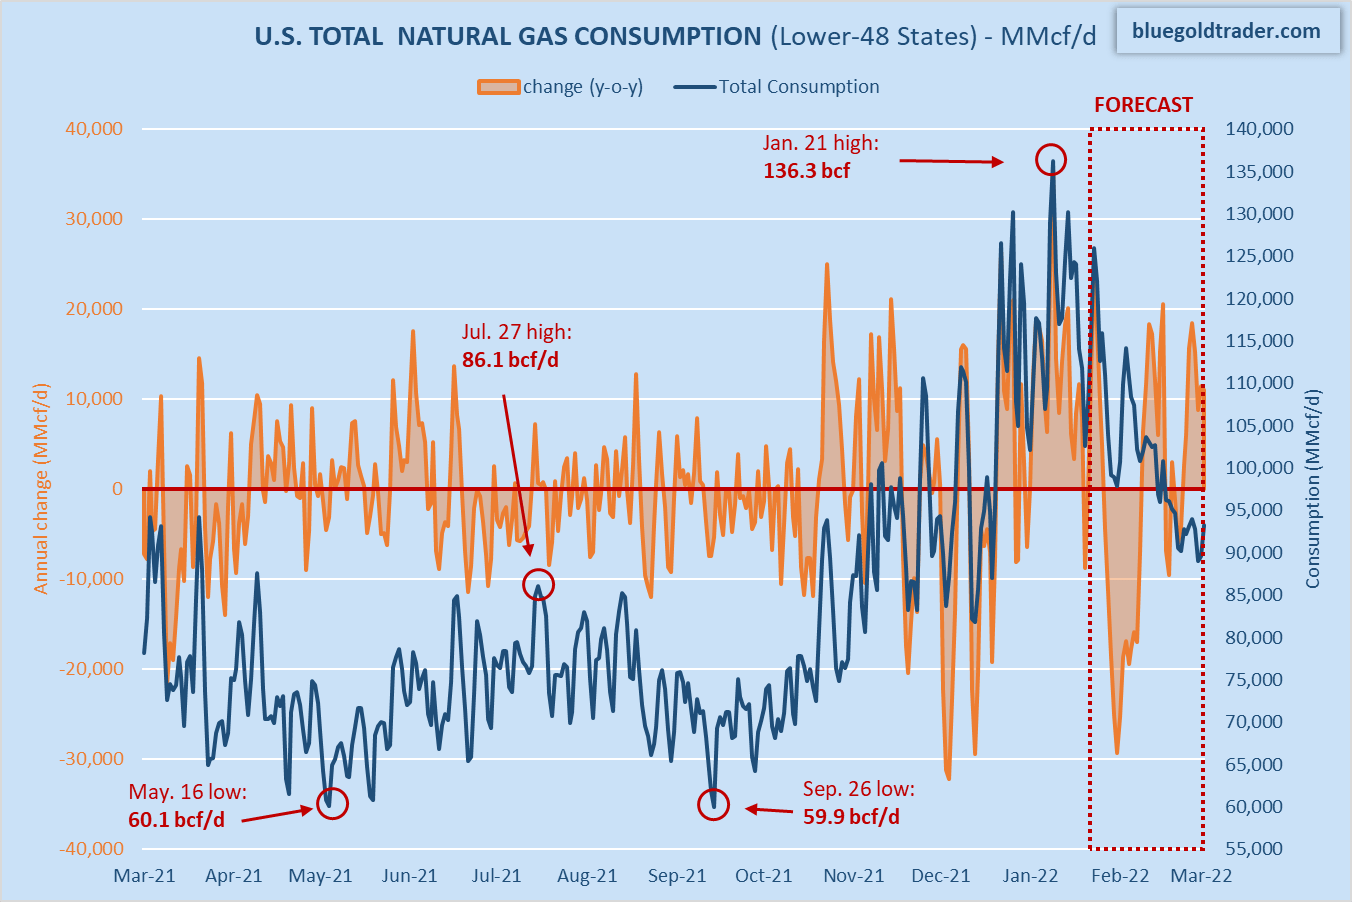
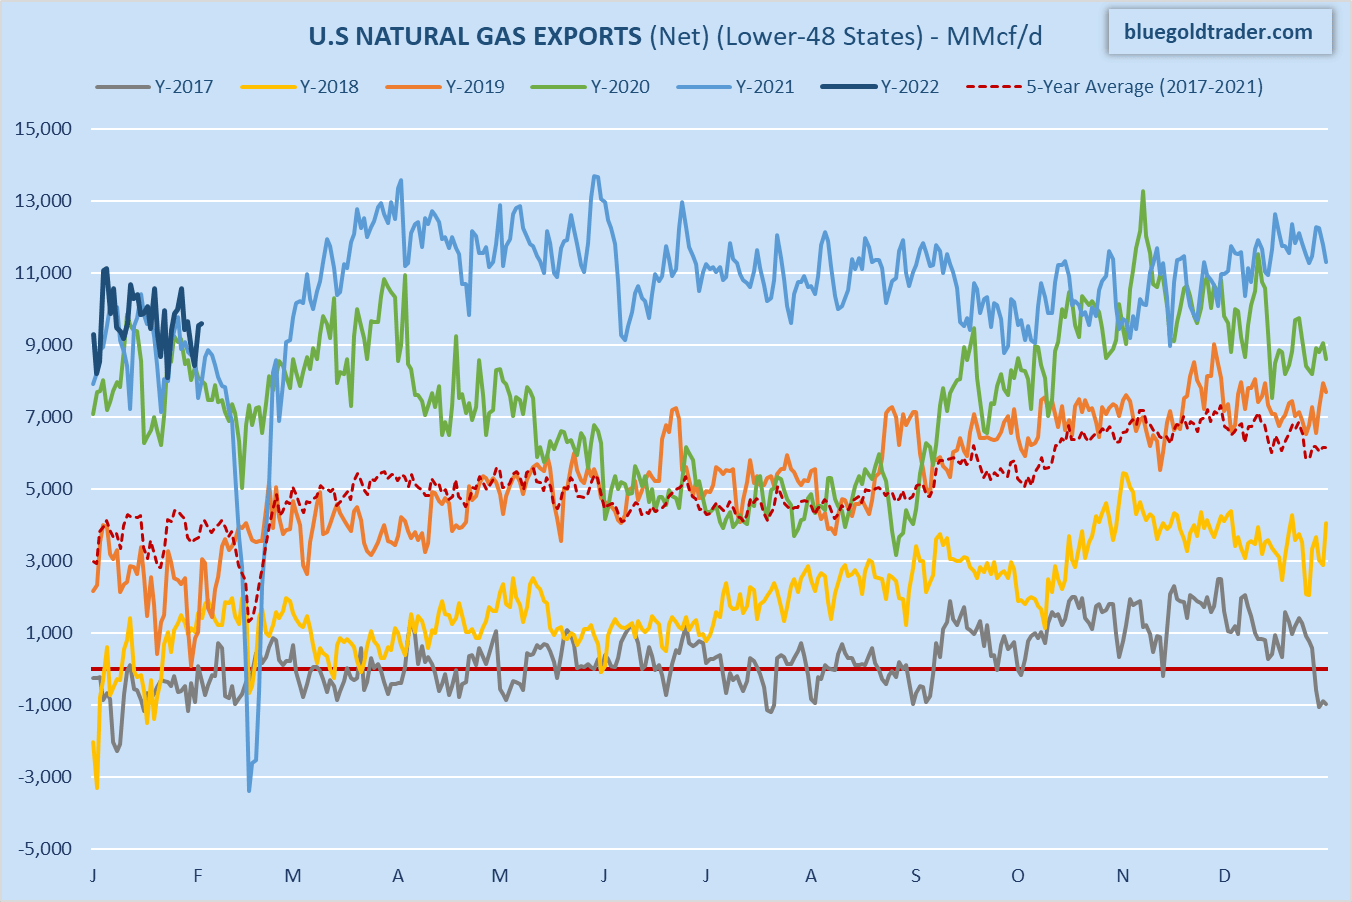
I estimate that dry gas production currently stands at 91.8 bcf/d (-2.2 bcf/d from yesterday). Production is likely to trend lower until Feb. 5 (due to pipeline freeze-offs). Net exports (calculated as “exports minus imports”) are estimated at 9.6 bcf/d (+1.6 bcf/d y-o-y).
U.S. Dry Gas Production (Bluegold Trader) U.S. Net Natural Gas Exports (Bluegold Trader)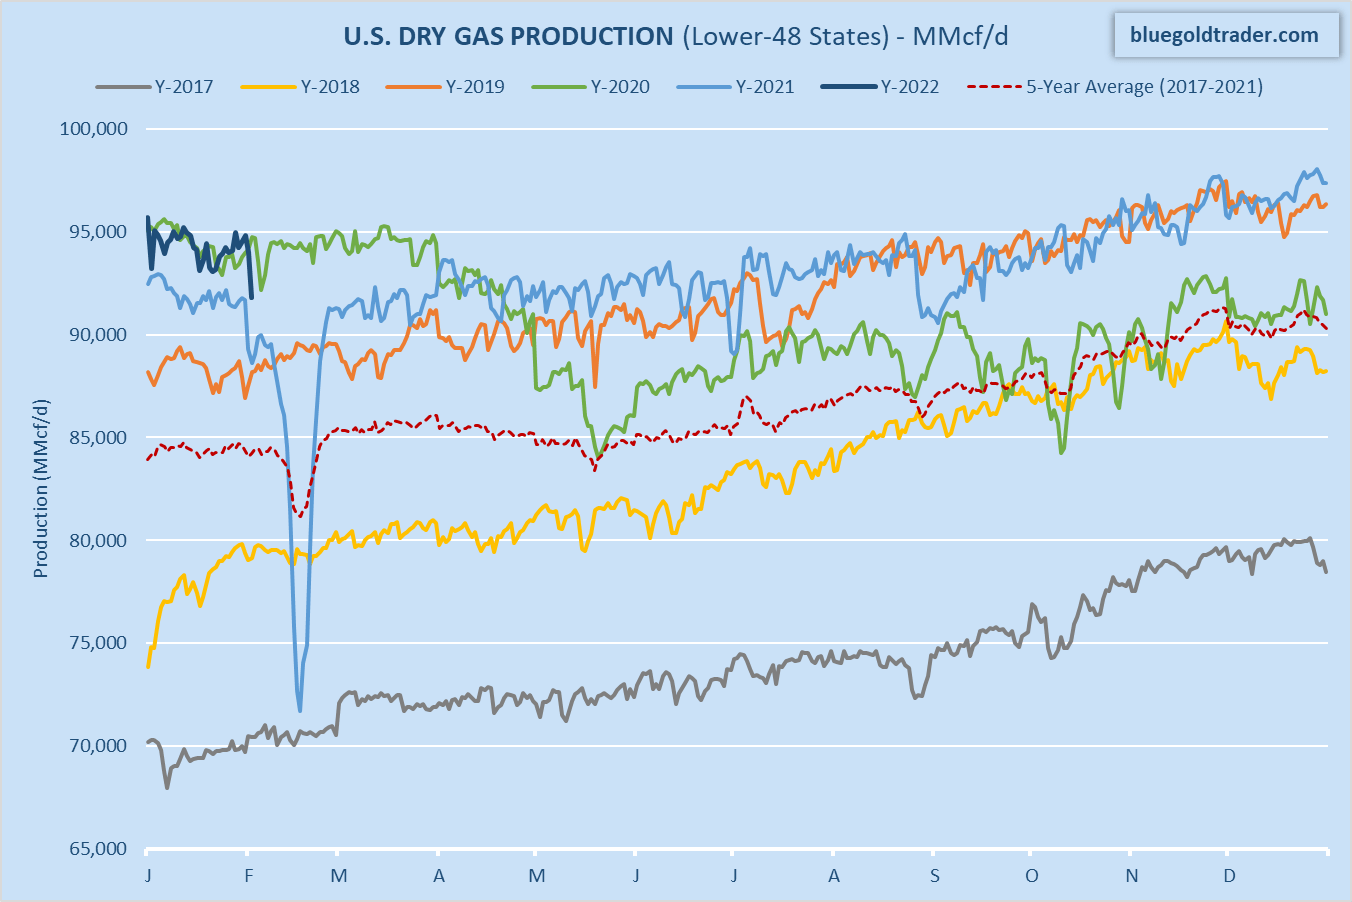
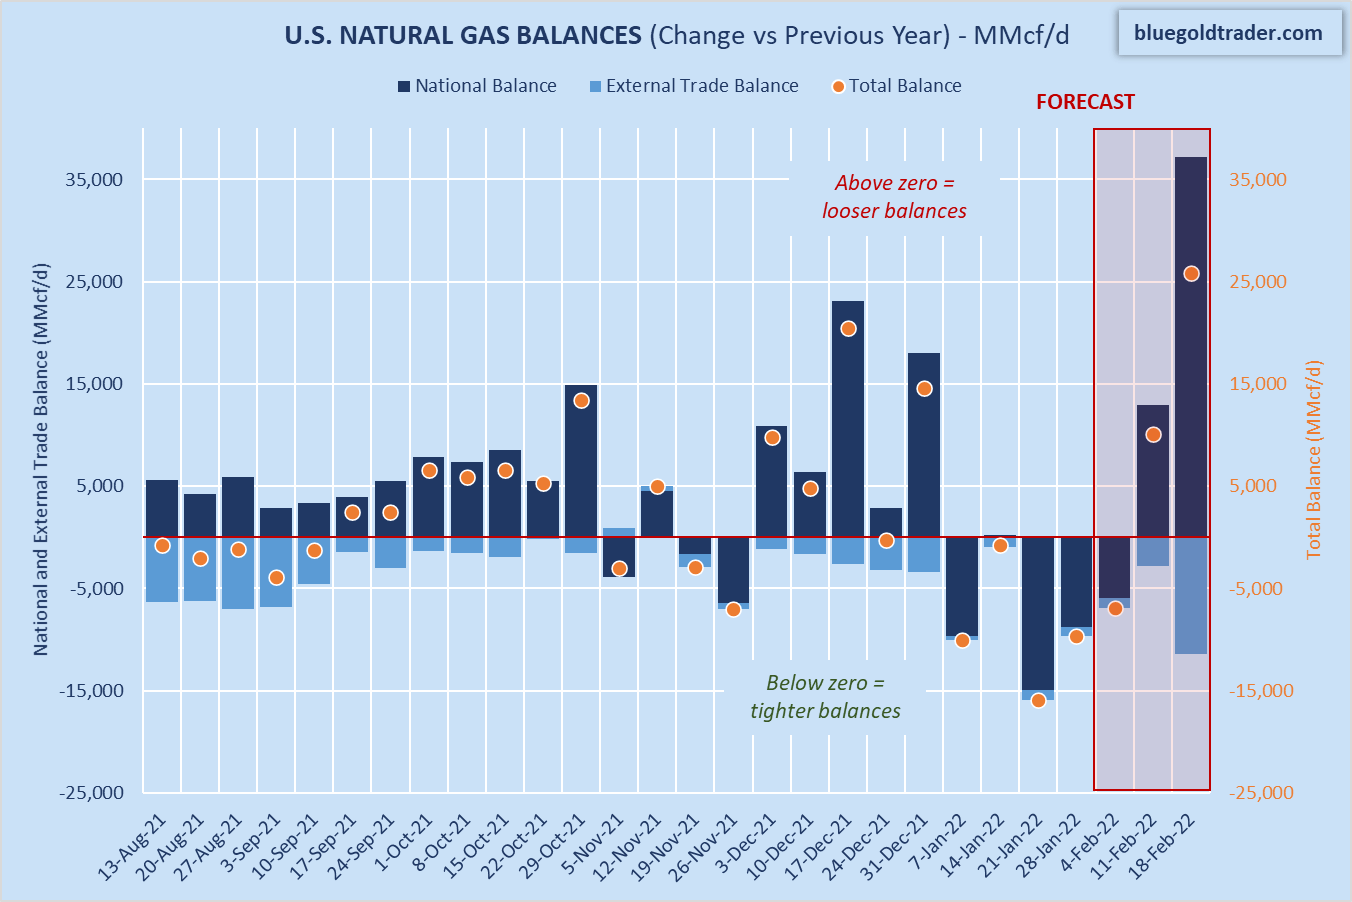
Over the next two weeks (Feb. 11 – Feb. 18), I currently expect total supply (production + imports) to average 103.3 bcf/d (+10.8 bcf/d y-o-y) and I expect total demand (consumption + exports) to average 129 bcf/d (-7.2 bcf/d y-o-y). The total balance should be looser vs. a year ago at around +18 bcf/d y-o-y (see the charts below). Please note, however, that looser balance is primarily the result of the base effects (last year, the balance was abnormally tight due to the extremely cold weather in Texas).
U.S. Natural Gas Supply and Demand Growth (Bluegold Trader) U.S. Natural Gas Supply Demand Balance (Bluegold Trader)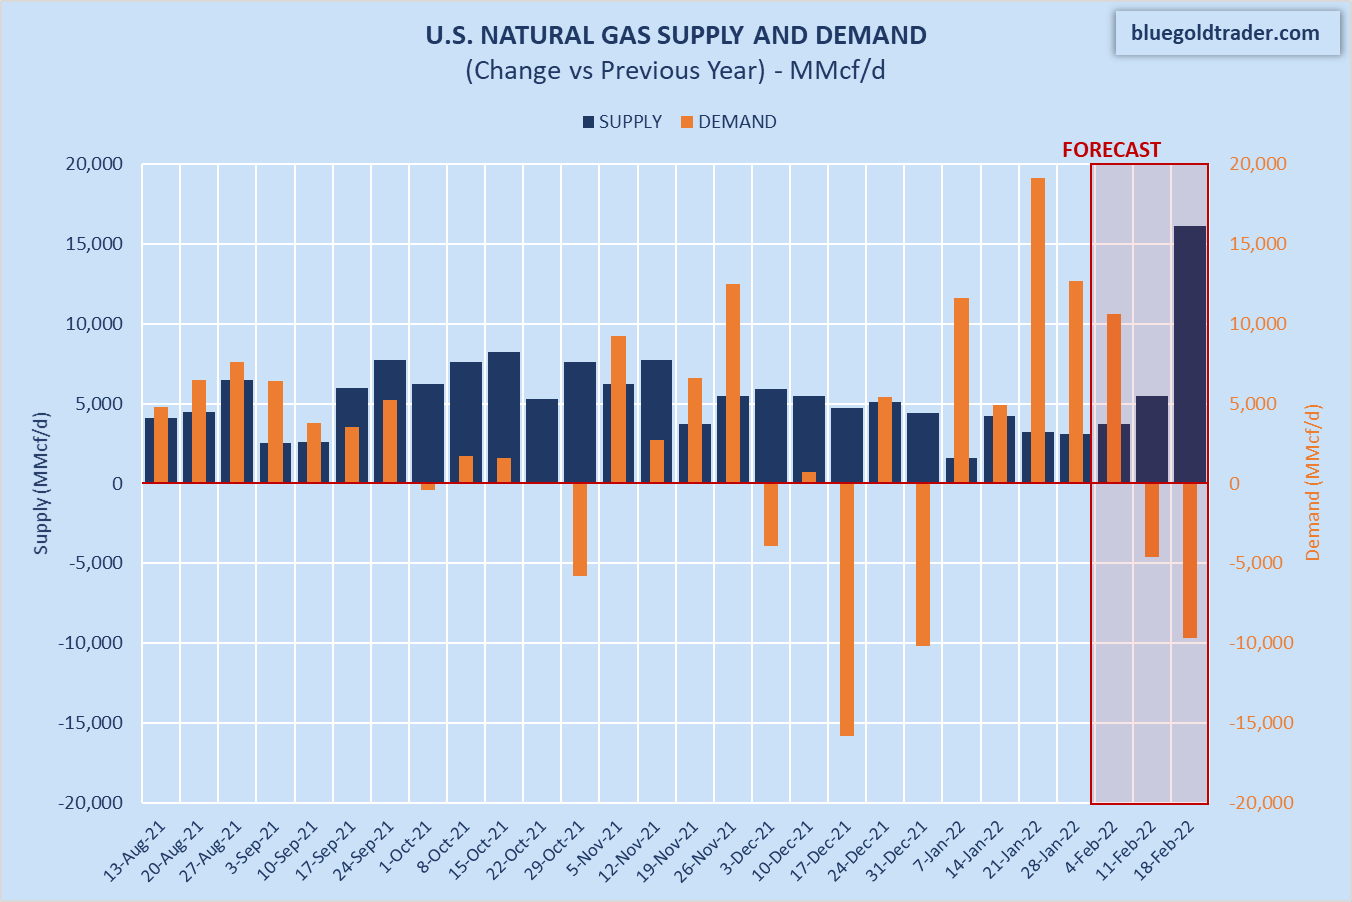
Storage Report
This week, the U.S. Energy Information Administration should report a larger change in natural gas storage compared to the previous week. I anticipate seeing a draw of 279 bcf (96 bcf larger than a year ago, and 129 bcf larger vs. the five-year average for this time of the year). The annual storage deficit is currently projected to shrink by 151 bcf by Feb. 25. The storage deficit relative to the five-year average is projected to expand by 138 bcf over the same period.
U.S. Natural Gas Storage Forecast (Bluegold Trader)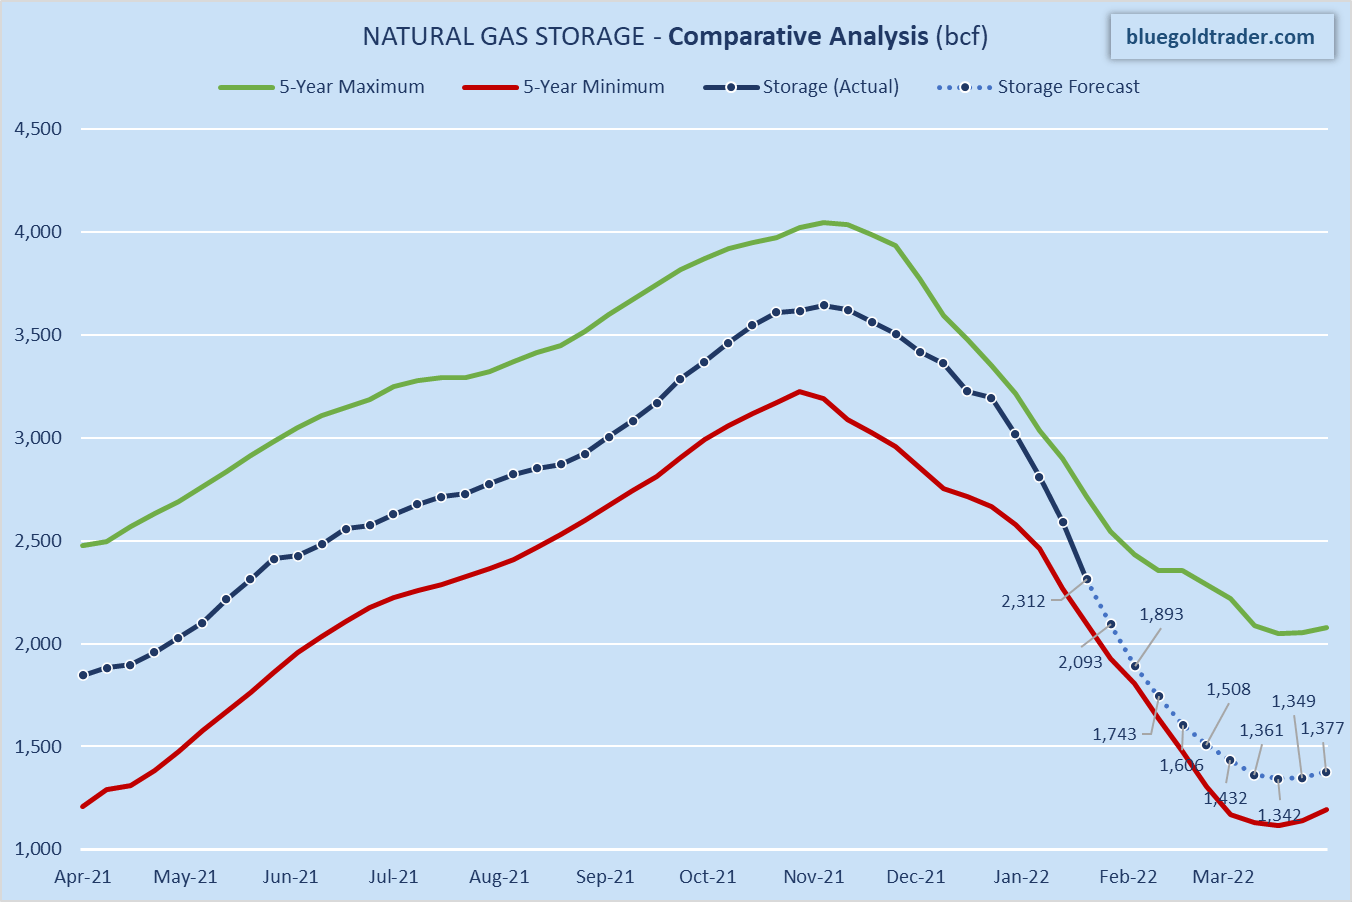
Be the first to comment