


onurdongel/E+ via Getty Images
The Weather
Last week
Last week (ending Mar. 25), the number of heating degree days (HDDs) plunged by 17.7% w-o-w (from 110 to 91). However, the total “energy demand” (as measured in total degree days or TDDs) was up 14% y-o-y – mostly. However, the deviation from the norm was negative (-20.5%).
This week
This week (ending Apr. 1), the weather conditions in the contiguous United States have been cooling down. I estimate that the number of nationwide HDDs will surge by 29.2% w-o-w (from 91 to 117). The average daily consumption of natural gas (in the contiguous United States) should be somewhere between 83 bcf/d and 85 bcf/d. The total “energy demand” (measured in TDDs) will rise by 17.3% y-o-y, while the deviation from the norm will turn sharply positive (+16.2%).
Next week
Next week (ending Apr. 8), the weather conditions are currently expected to warm up. The number of nationwide heating degree days (HDDs) is currently projected to drop by as much as 25% w-o-w (from 117 to 88). However, in annual terms, the total “energy demand” (measured in TDDs) should surge by 82% y-o-y – primarily due to base effects. The deviation from the norm will moderate substantially but will remain positive (+0.7%).
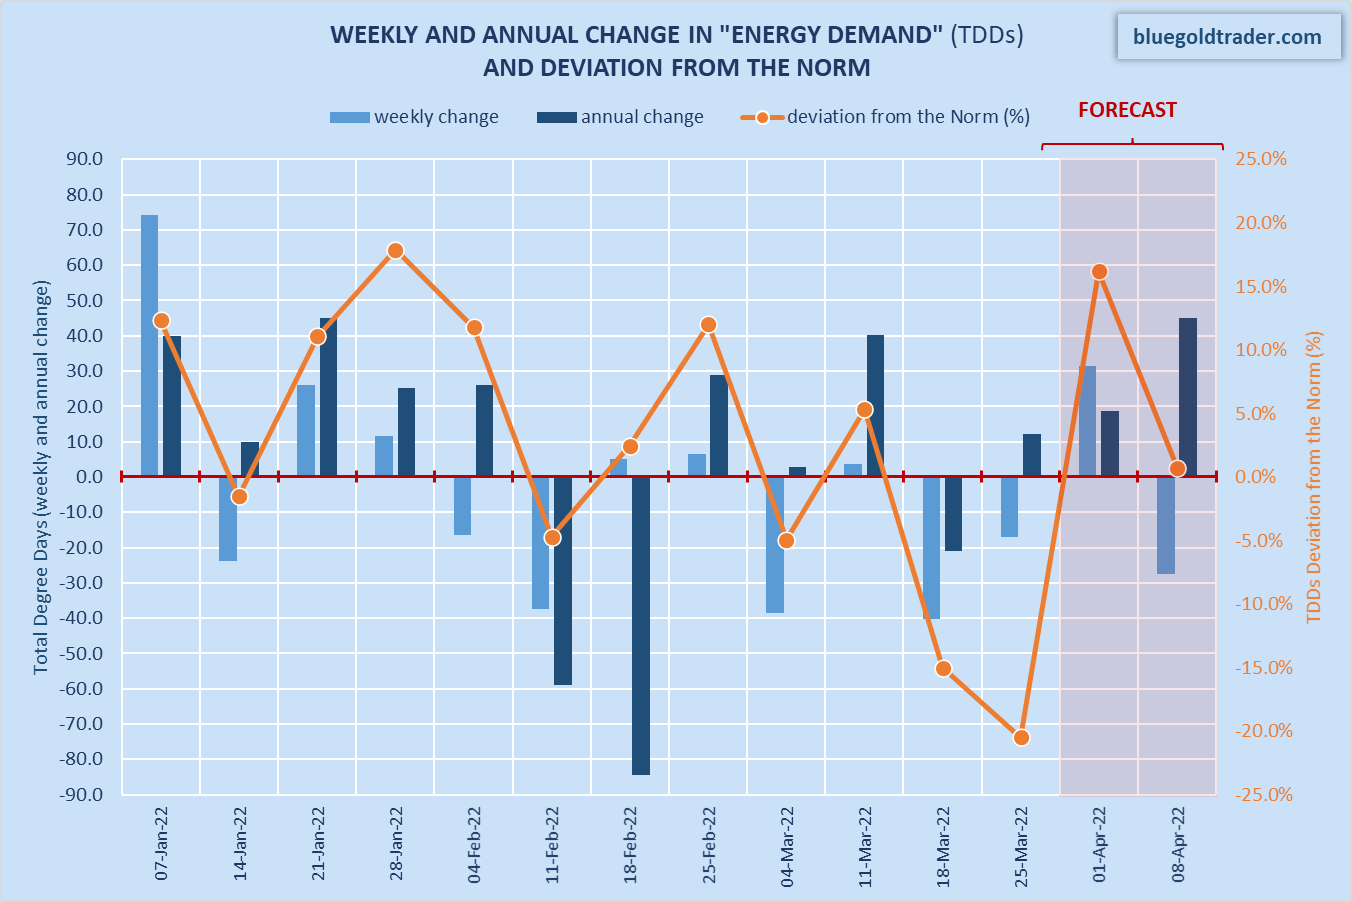
U.S. Energy Demand (TDDs) (NOAA, ECMWF, Bluegold Trader)
Market Variables
The latest numerical weather prediction models (Wednesday’s short-range 00z runs) agree that over the next 15 days, TDDs will be trending lower but will remain largely within the norm. However, there is a disagreement between the models in terms of scale. The latest GFS model (00z run) is projecting 69.7 bcf/d of potential natural gas consumption (on average, over the next 15 days) while the ECMWF model (00z run) is projecting 70.4 bcf/d over the same period.
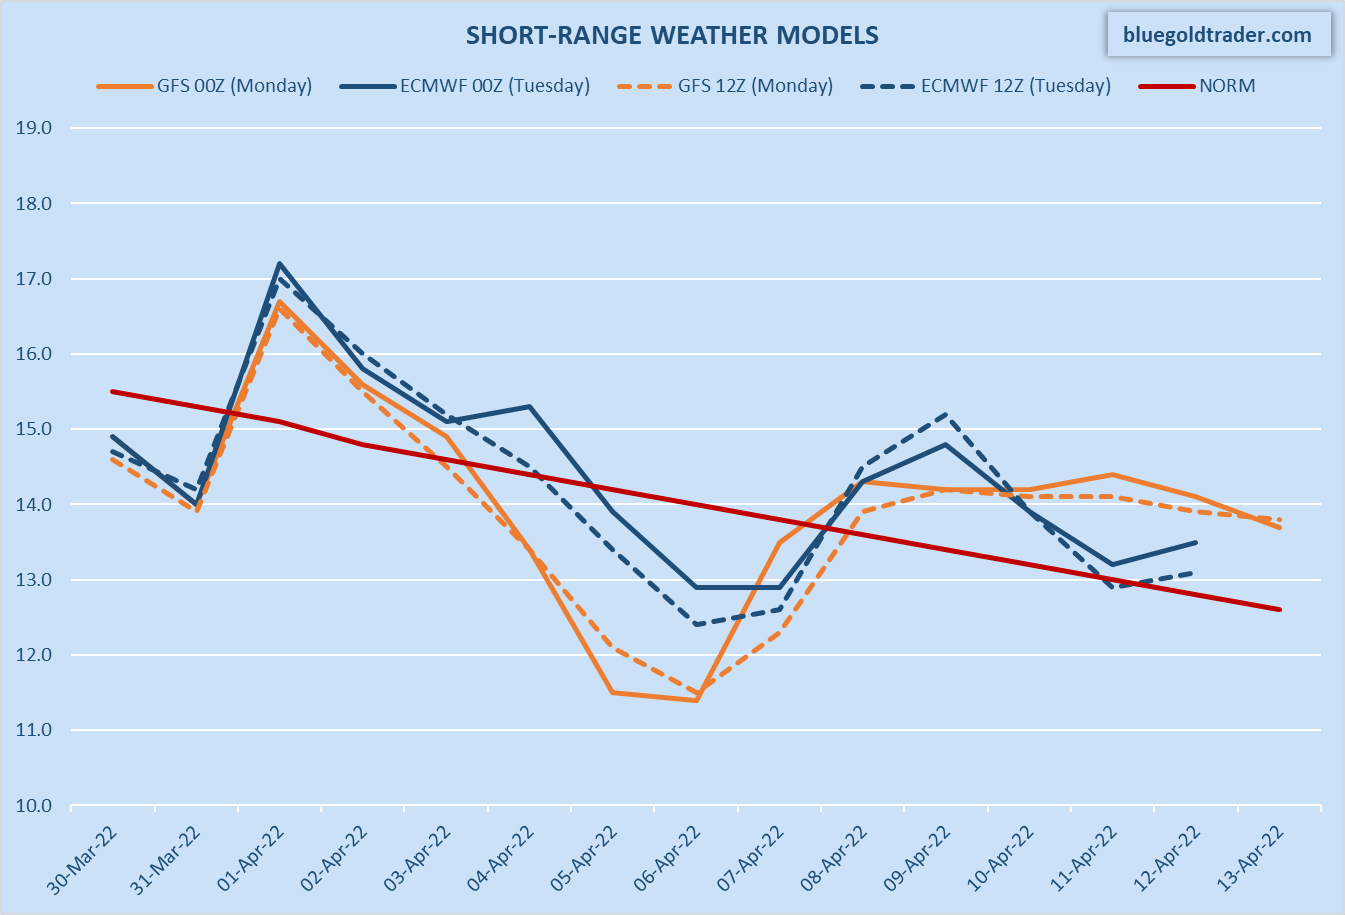
U.S. Short-Range Weather Forecast (NOAA, ECMWF, Bluegold Trader)
In relative terms, the latest short-range weather models were bullish (vs. the previous update). Specifically, ECMWF 00z Ensemble has “added” some 11 bcf of potential natural gas consumption compared to yesterday’s 12z results. In absolute terms, projected short-range TDDs are 23.4% above last year’s level but 1.5% below the norm.
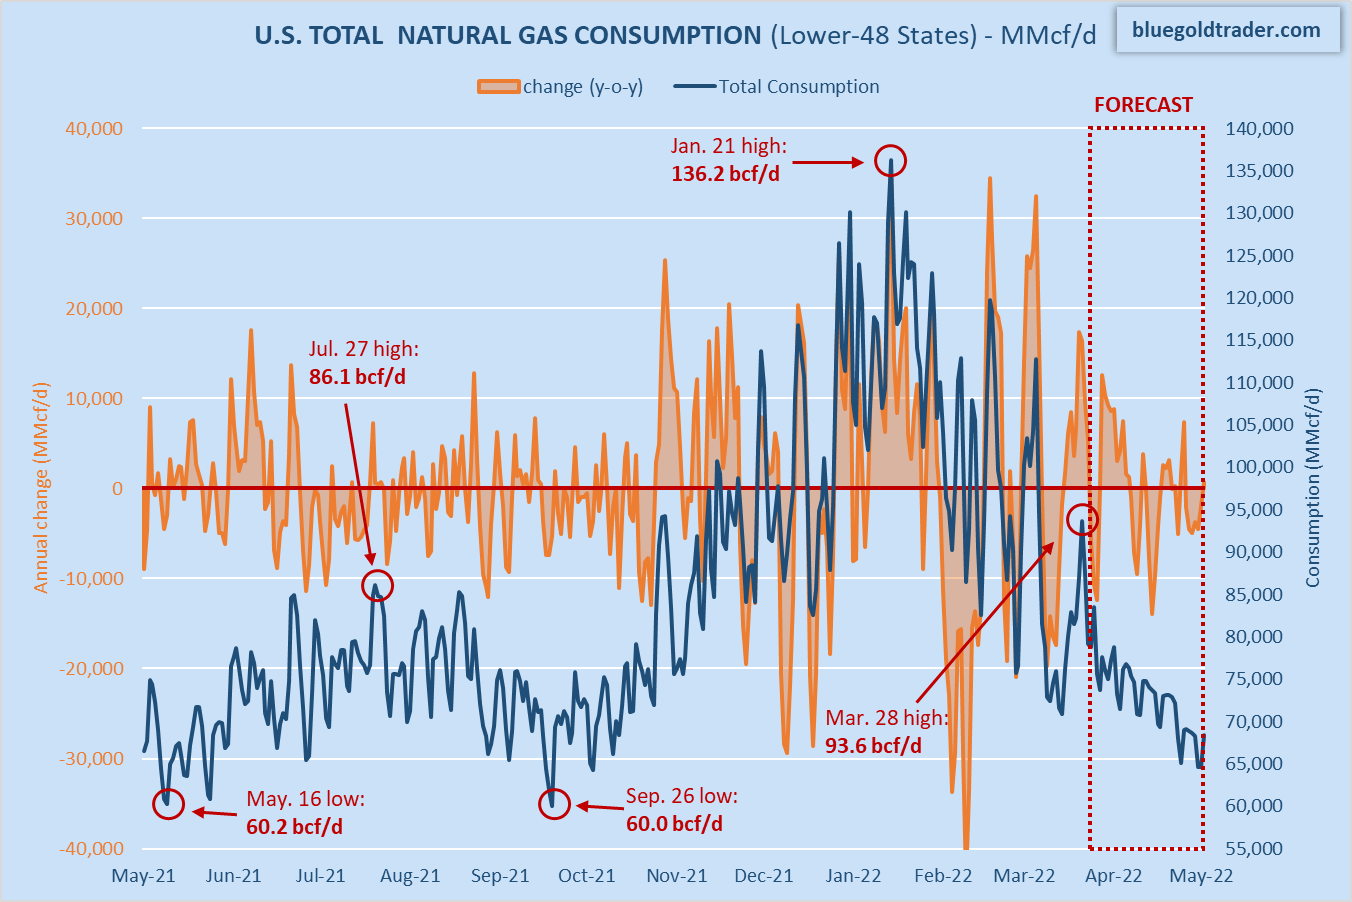
U.S. Natural Gas Consumption (Bluegold Trader)
Over the next 30-day period, total natural gas demand (consumption + exports) is expected to average 94.5 bcf/d (adjusted for probability), 0.9 bcf/d more than a year ago. A major near-term high in daily consumption was reached on March 28 (93.6 bcf/d). Consumption is now projected to trend lower and should reach a seasonal low in mid-May (see the chart above). Please remember that domestic consumption is an extremely volatile market variable because it is primarily driven by the weather forecast, which is highly unpredictable.
I estimate that dry gas production currently stands at 93.4 bcf/d. Net exports (calculated as “exports minus imports”) are estimated at 11.9 bcf/d (-0.6 bcf/d y-o-y).
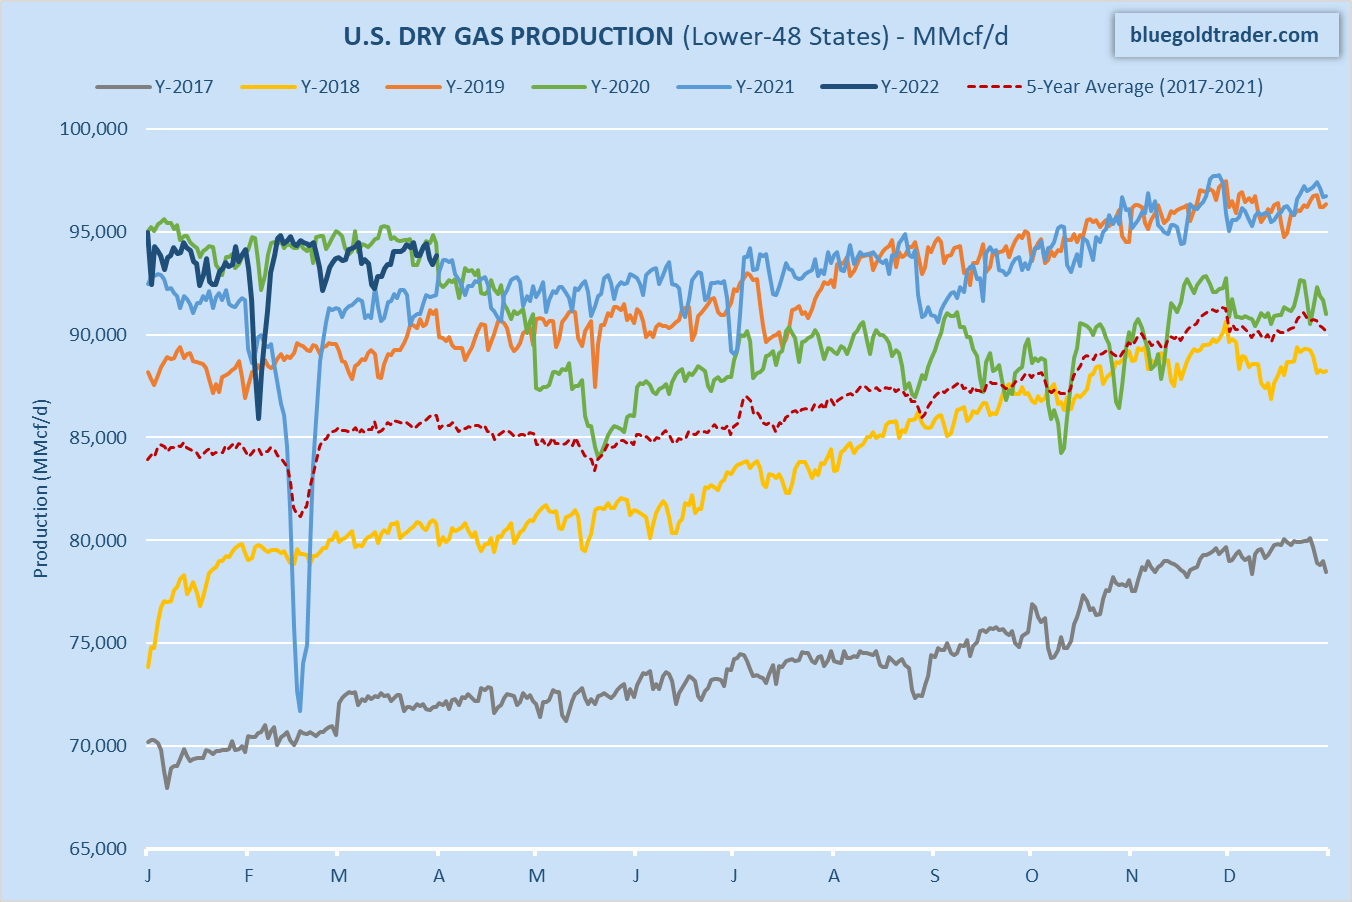
U.S. Dry Gas Production (Bluegold Trader)
Storage Report
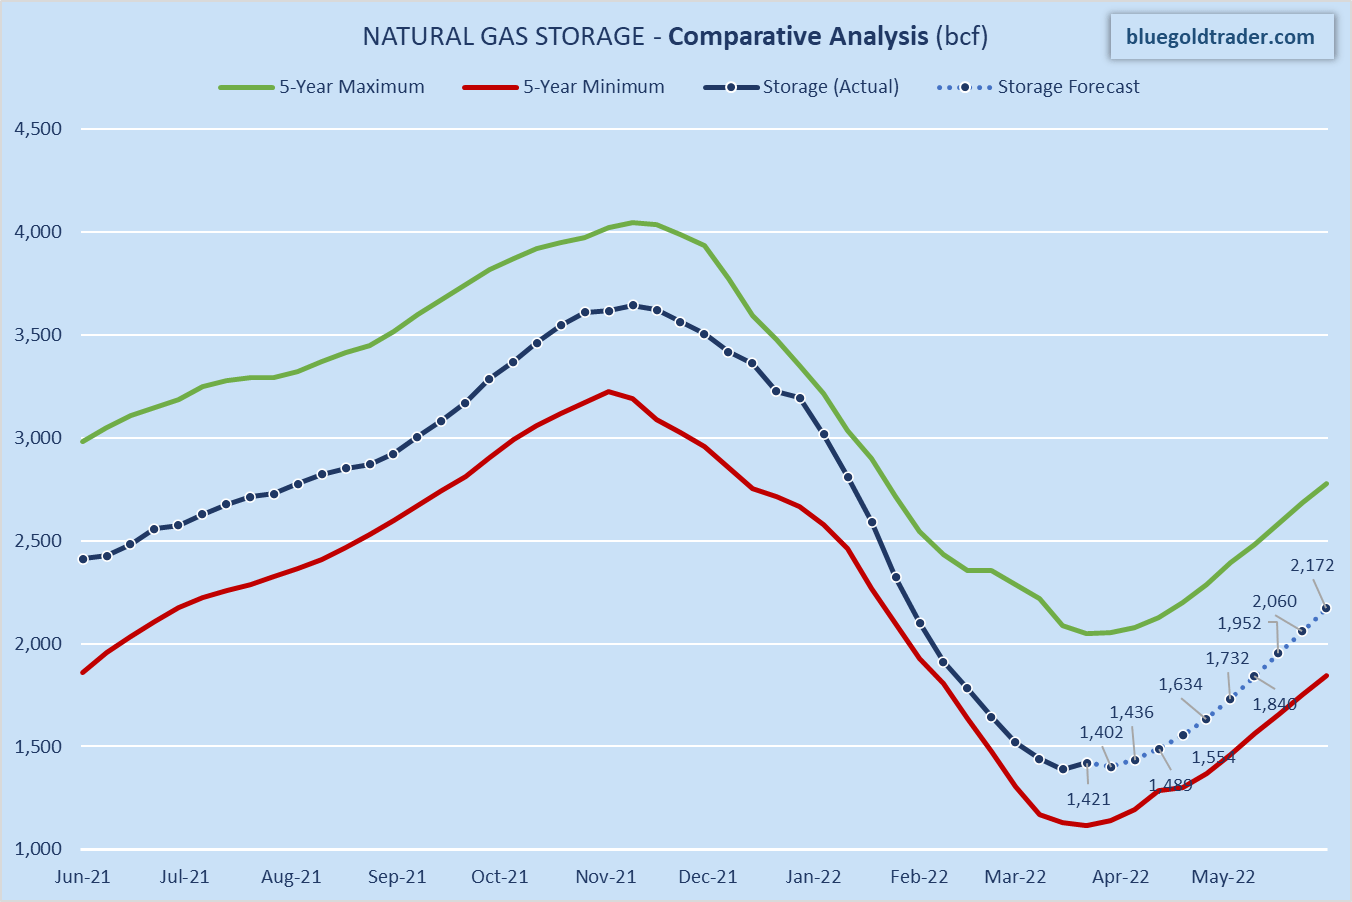
This week, the U.S. Energy Information Administration should report a smaller change in natural gas storage compared to the previous week. I anticipate seeing a build of 32 bcf (25 bcf larger than a year ago and 55 bcf larger vs. the five-year average for this time of the year). The annual storage deficit is currently projected to expand by just 1 bcf by Apr. 22. The storage deficit relative to the five-year average is projected to expand by 3 bcf over the same period.
U.S. Net Natural Gas Exports (Bluegold Trader)
Be the first to comment