

imaginima/E+ via Getty Images
A guest post by Ovi
All of the oil (C + C) production data for the US state charts comes from the EIA’s Petroleum Supply monthly PSM.
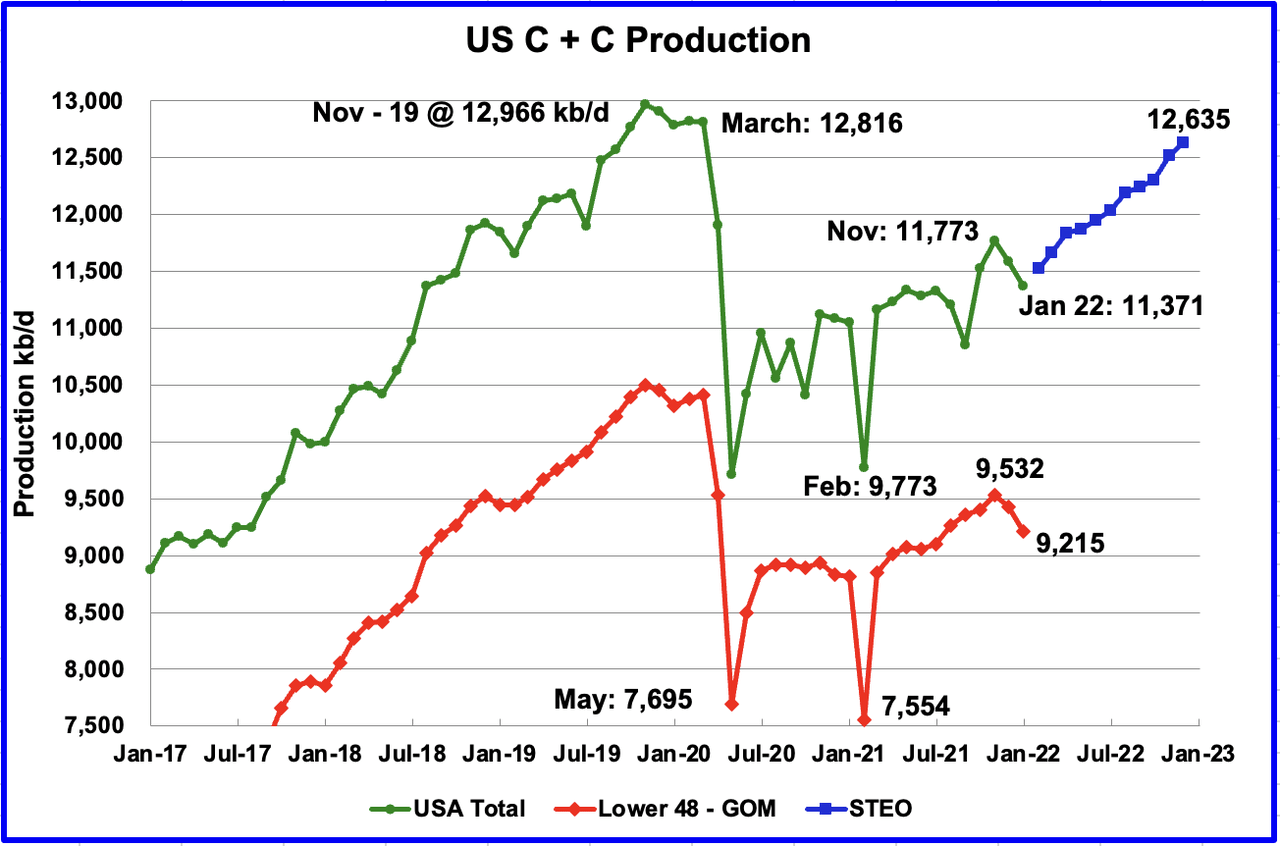
U.S. January production decreased by a surprising 216 kb/d to 11,371 kb/d. In December production dropped by 206 kb/d. The main declining states were Texas 120 kb/d, New Mexico 31 kb/d, and ND 24 kb/d. Of the top 10 states, only Colorado increased its production.
The data points in the blue graph, taken from the February 2022 STEO, are production forecasts for the US from February 2022 to December 2022. Output for December 2022 is expected to be 12,635 kb/d, a revision of 245 kb/d higher than was forecast in the February STEO report.
While overall US production was down, a clearer indication of the health of US onshore oil production can be gleaned by looking more closely at the On-shore L48 states. In the On-shore lower 48, January production decreased by 211 kb/d to 9,215 kb/d. The On-shore L48 decrease accounts for the majority of the drop in US production.
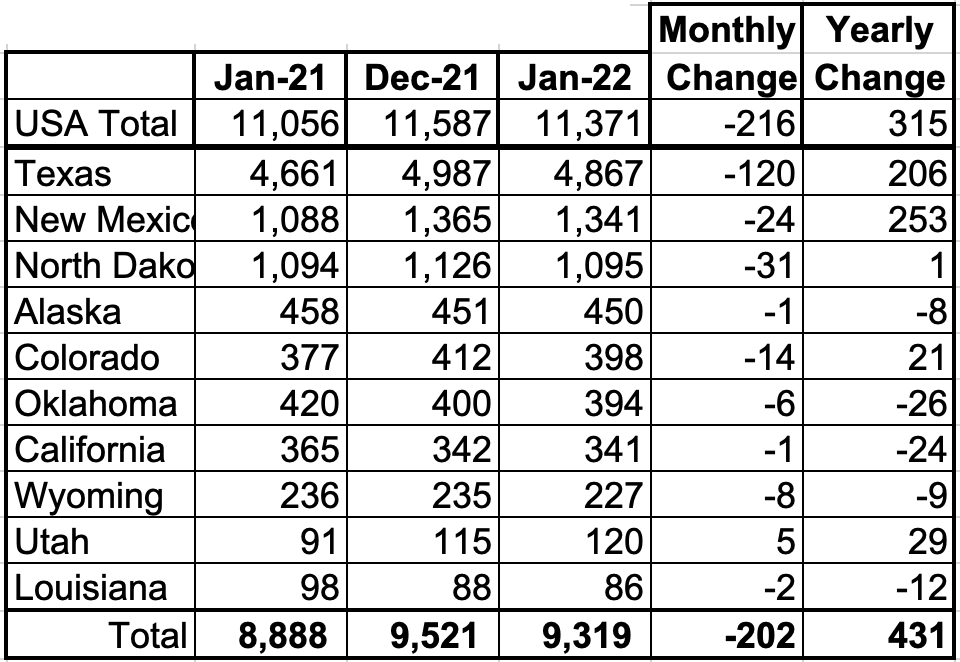
Listed above are the 10 states with the largest US production. These 10 accounted for 82.0% of all production out of a total production of 11,371 kb/d in January 2022. Note that all of the above states, except Colorado, dropped, some more than others.
On a YoY basis, US production increased by 315 kb/d or on average 26.3 kb/d/mth.
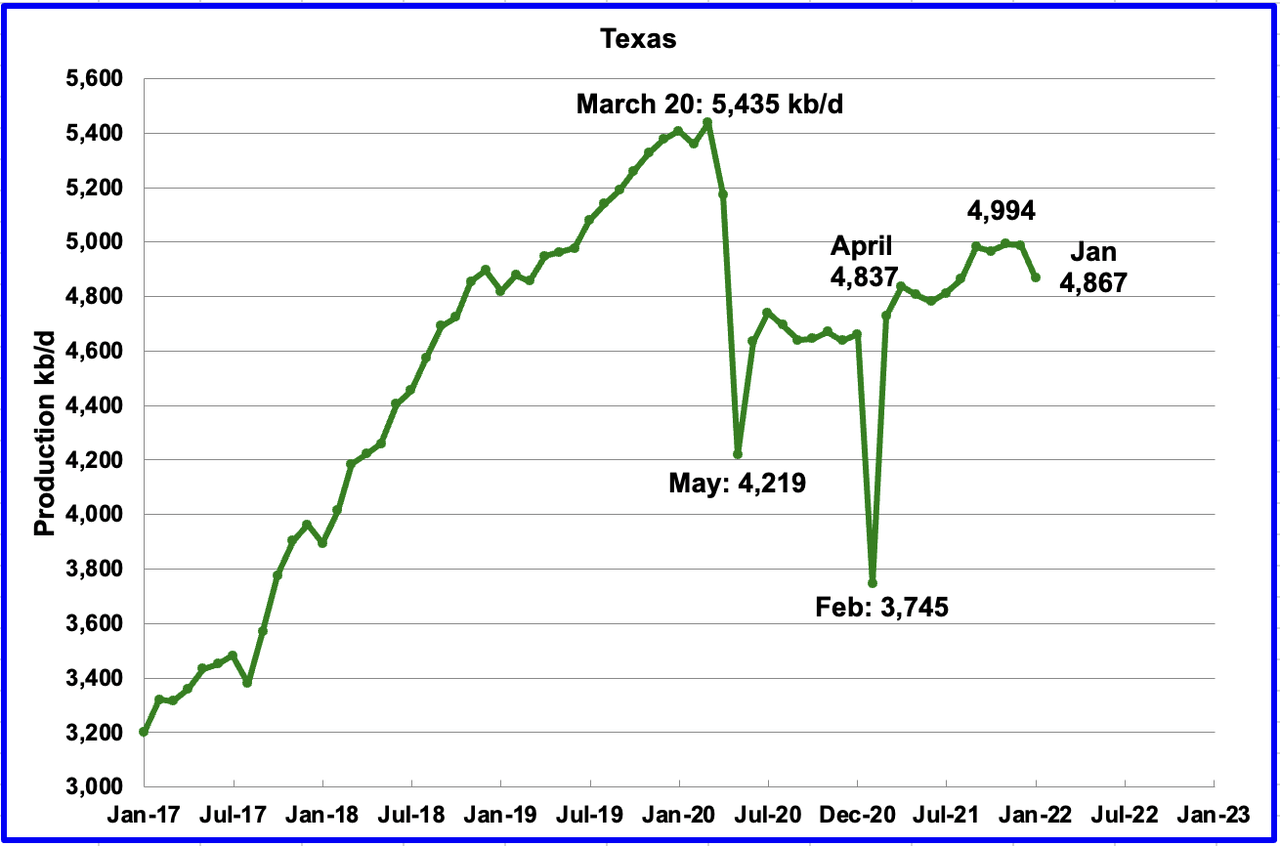
Texas production decreased by 120 kb/d in January to 4,867 kb/d from 4,987 kb/d in December.
In September there were close to 205 Hz oil rigs operating in Texas. By the last week of January, 235 oil rigs were operating, an increase of 30 rigs and production remained essentially flat from September to December and then dropped by 120 kb/d in January.
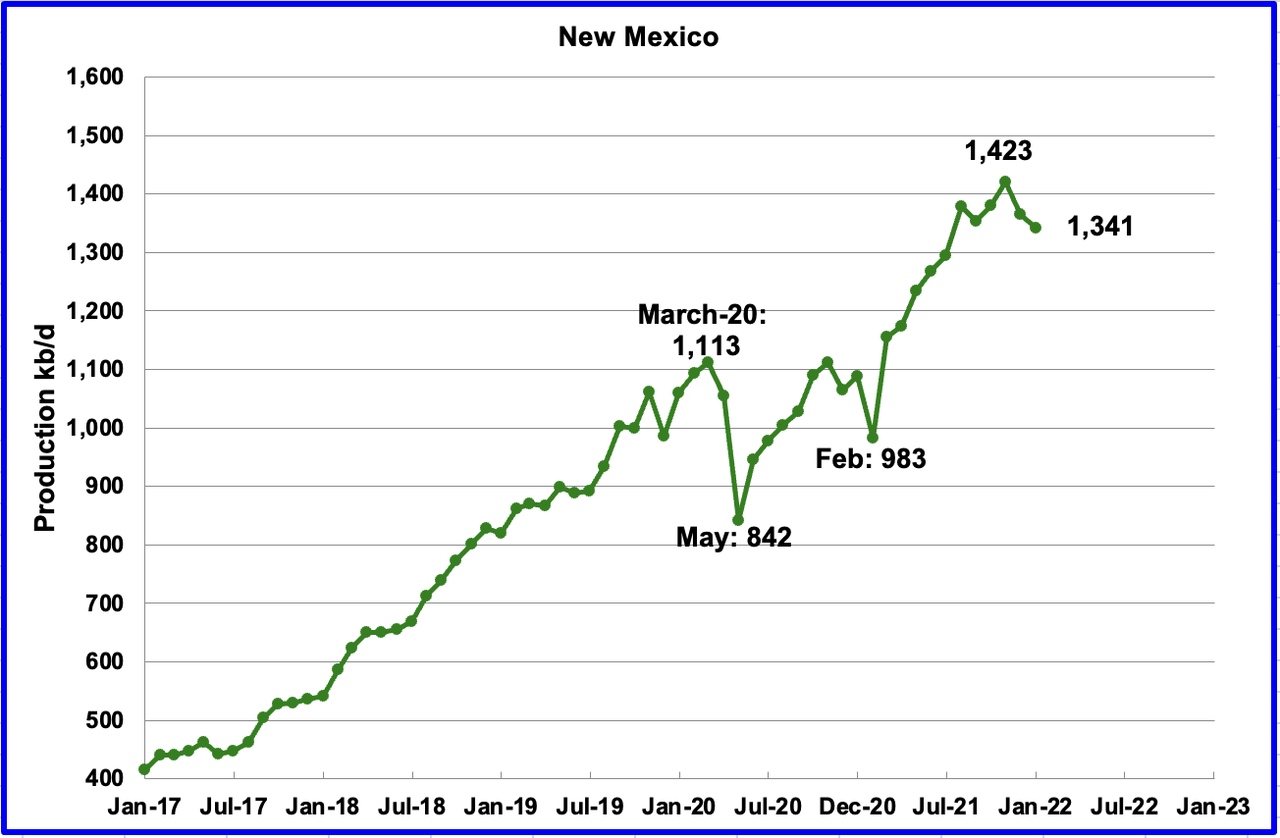
January’s New Mexico production dropped by 24 kb/d to 1,341 kb/d. From the beginning of December to the end, frac spreads dropped from 271 at the beginning to 234 at the end. By the and of January, frac spreads had rebounded to 261, still down 10 from the beginning of December.
The January drop in production in Texas and New Mexico could be related to the lower number frac spreads operating at the end of December and January than at the beginning of December. In addition, Texas experienced bad winter weather in December and January which spilled over into New Mexico. A strong winter storm brought heavy snow and bitterly cold temperatures to parts of New Mexico in the first week of February.
While summer hurricanes are a well known weather phenomenon that affects GOM production, winter storms may be a new factor to consider when forecasting December to February production in Texas and New Mexico.
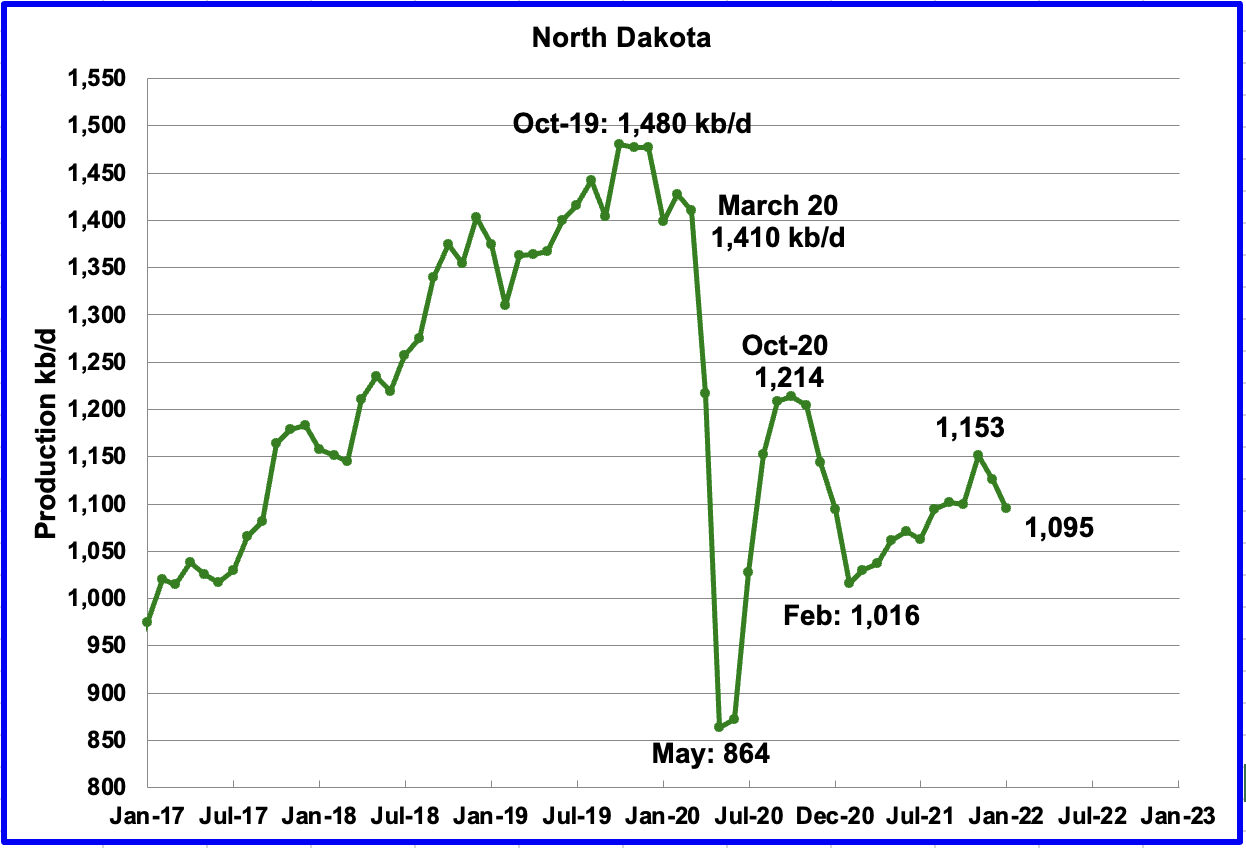
According to the EIA, North Dakota’s December output was 1,095 kb/d, a decrease of 31 kb/d from December. North Dakota’s Department of Mineral Resources reported a bigger drop in January in the Bakken.

According to the North Dakota Oil and Gas division, January production in the Bakken fell by 57 kb/d.
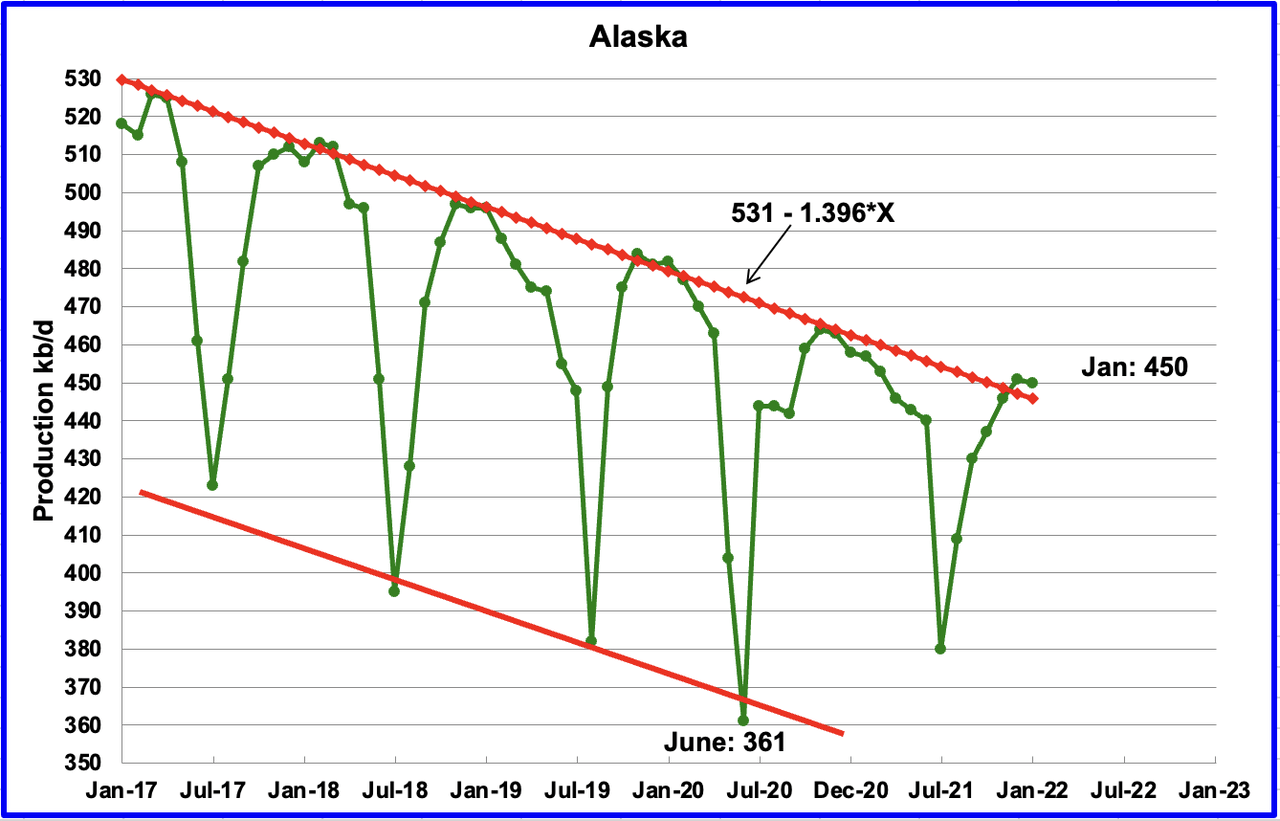
Alaskaʼ s January output decreased by 1 kb/d to 450 kb/d.
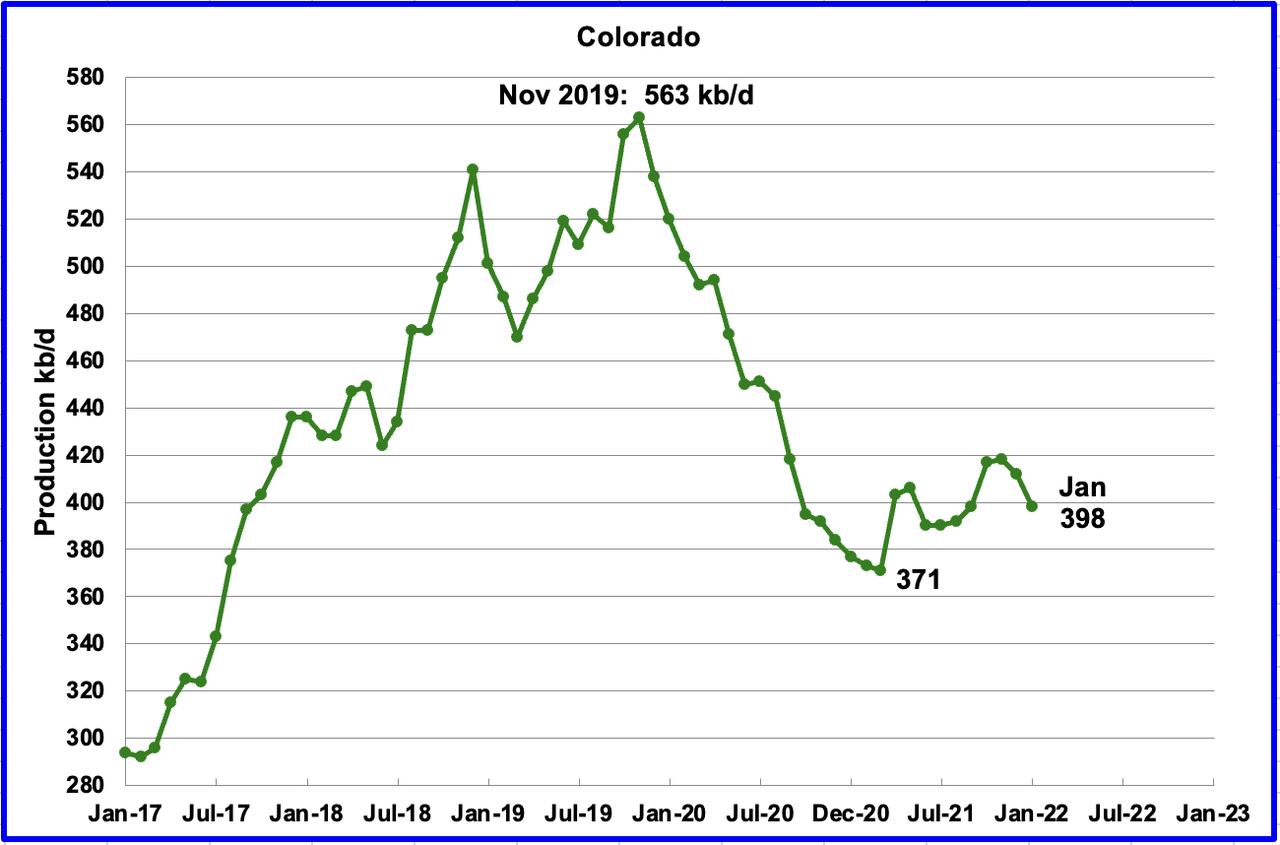
Coloradoʼ s January production decreased by 14 kb/d to 398 kb/d. However, it should be noted that December’s output was revised up from 393 kb/d to 412 kb/d.
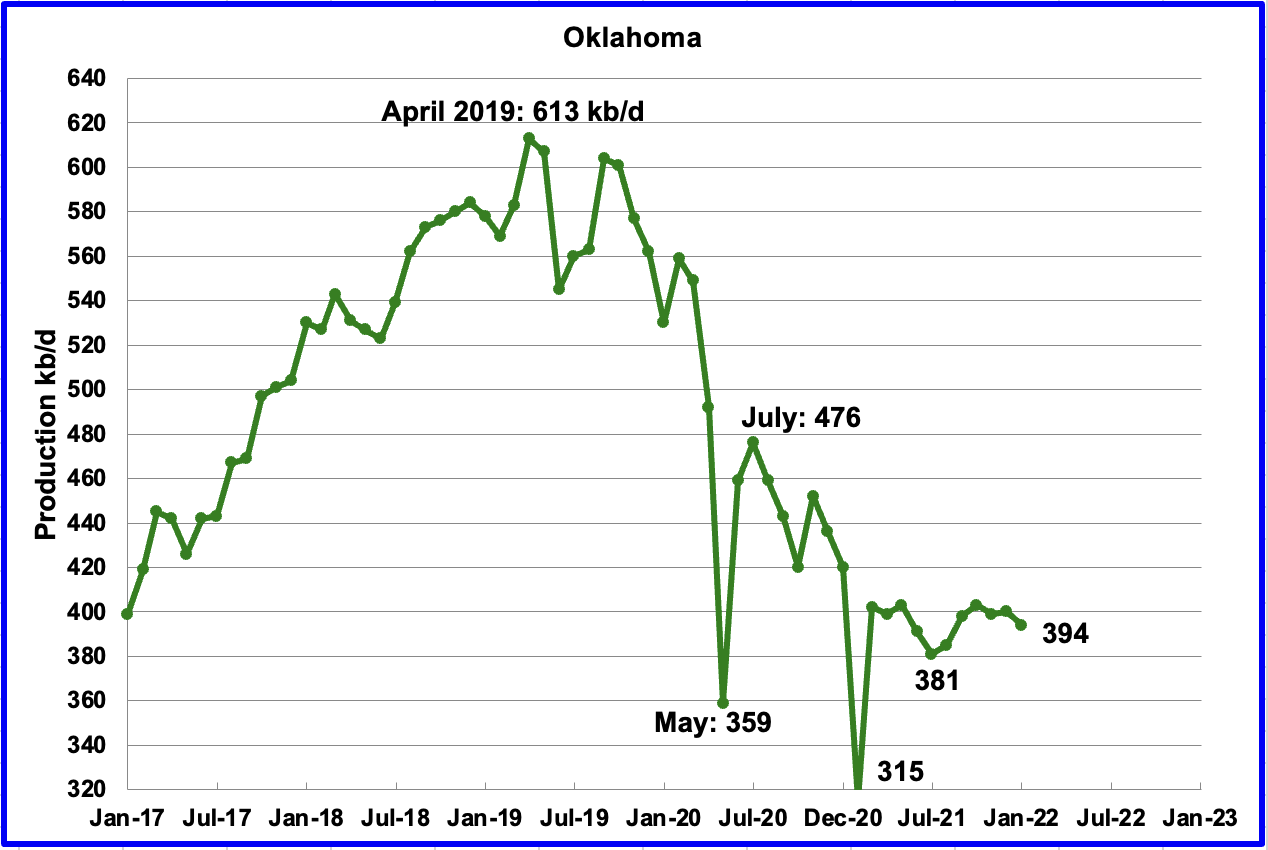
Oklahoma’s output in January decreased by 6 kb/d to 394 kb/d. Its output has remained essentially flat since March even though its rig count increased from 17 in March to 48 in January.
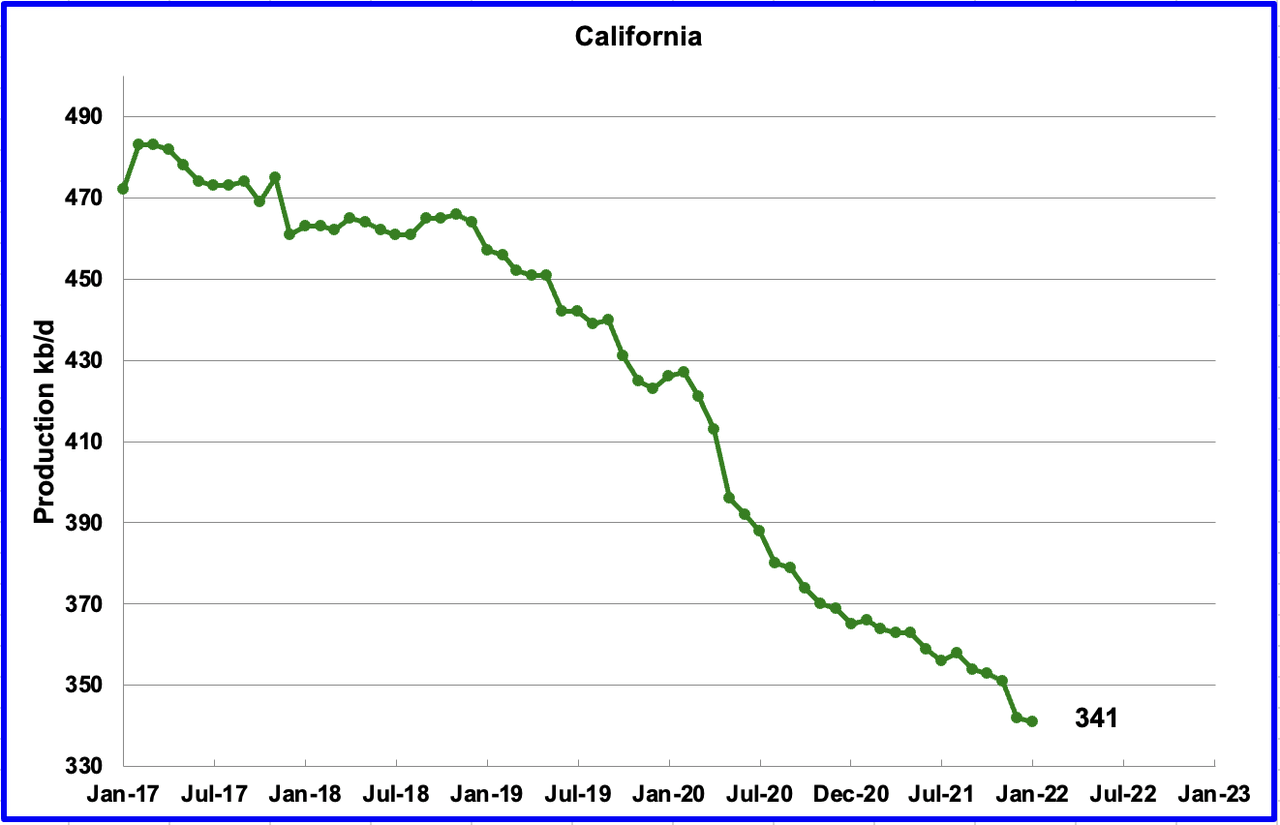
Californiaʼ s slow output decline continued in January. Output decreased by 1 kb/d to 341 kb/d.
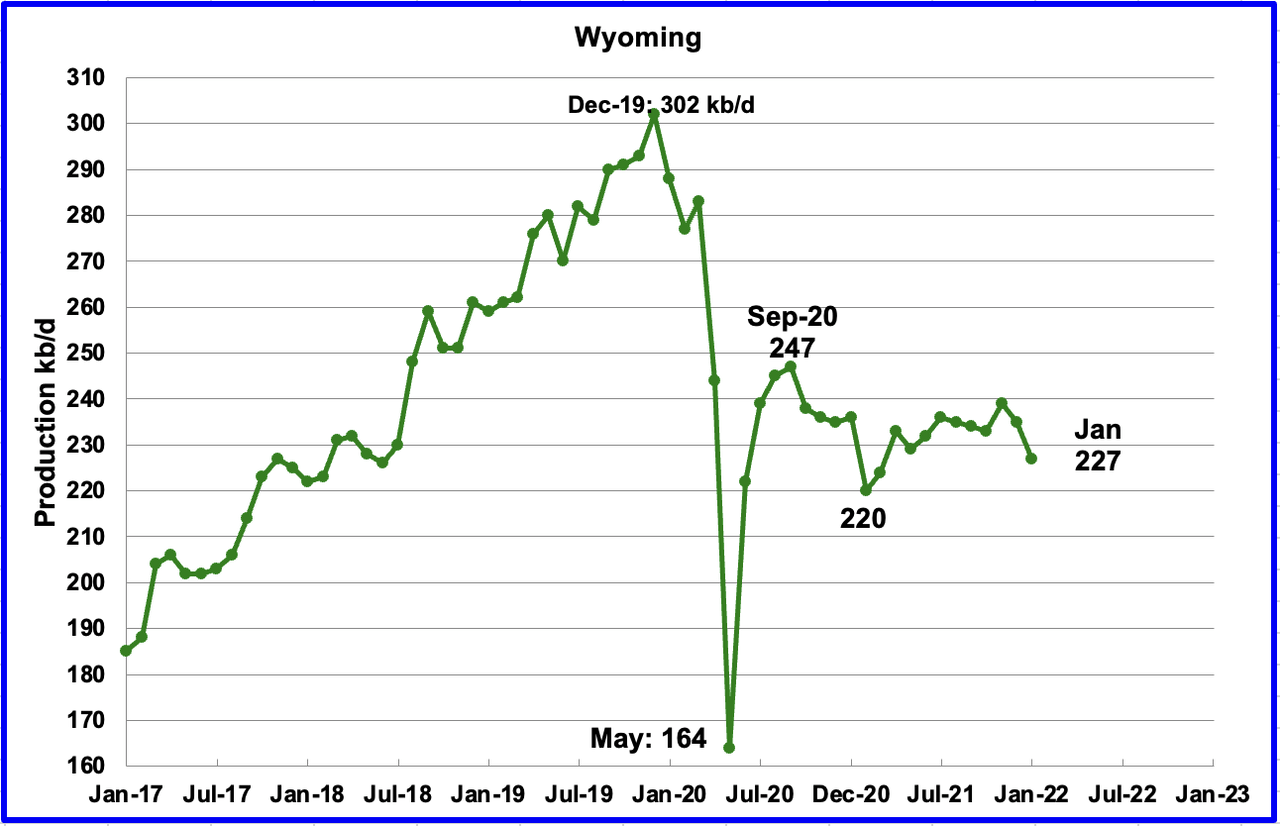
Wyoming’s production has been in a slow unsteady decline since September 2020 when output was 247 kb/d. In January 2022 output decreased by 8 kb/d to 227 kb/d, down 20 kb/d from September 2020.
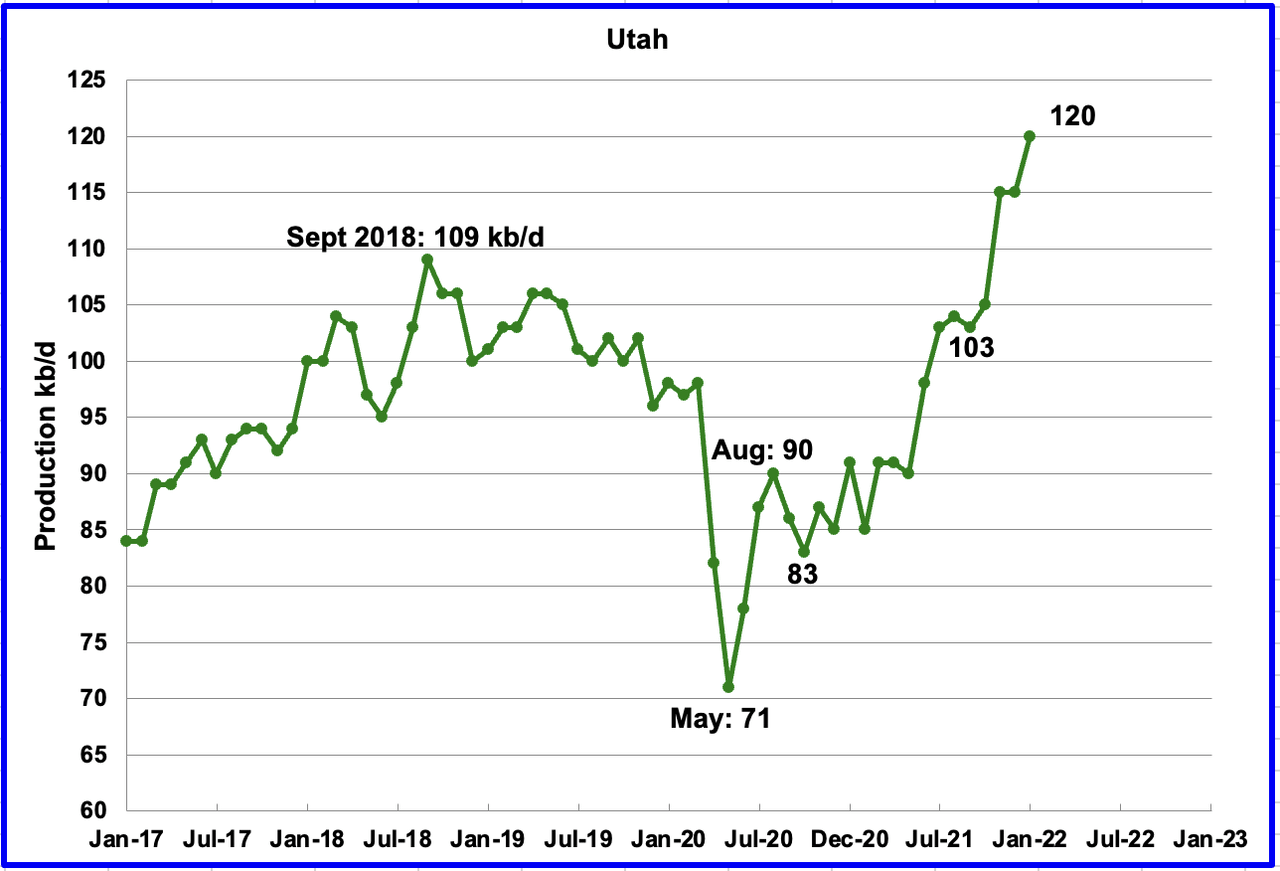
Utah’s production increase from the low of May 2020 continued. January’s production increased by 5 kb/d to a new record high 120 kb/d. Utah began to increase its Hz rig count from 6 in October 2021 to 8 in February.
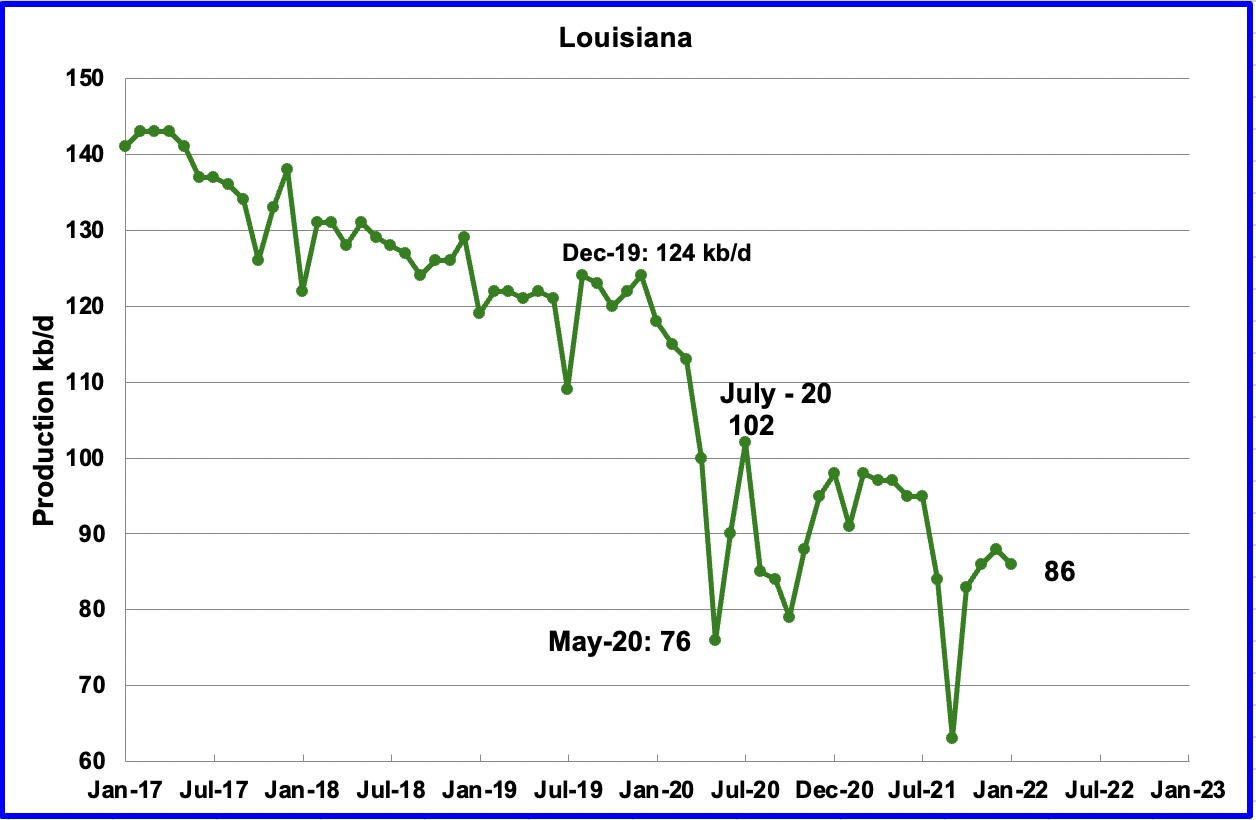
Louisiana’s output decreased by 2 kb/d to 86 kb/d in January. Louisiana was one of the hardest hit states by hurricane Ida in late August. January’s output decrease indicates that Louisiana’s slow recovery is complete.
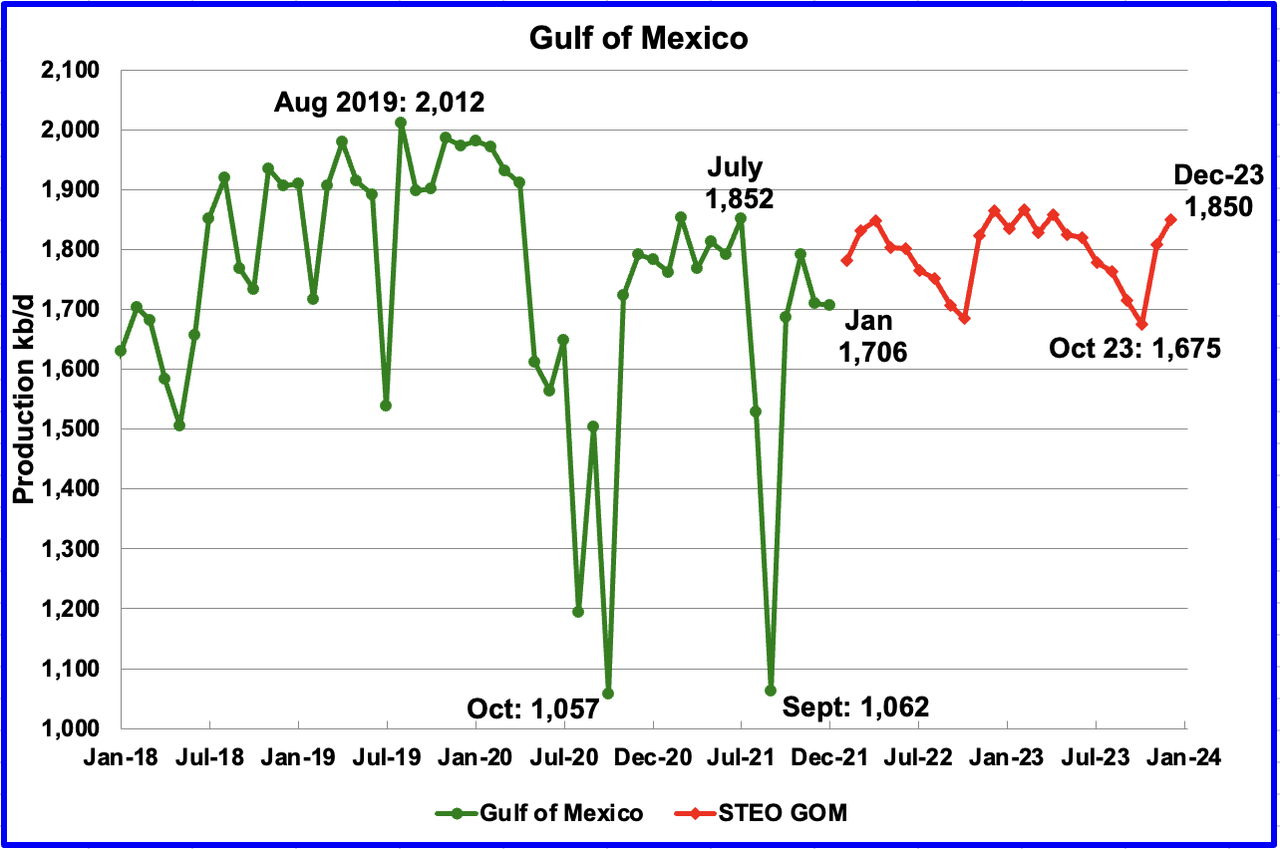
Production from the GOM was essentially unchanged in January. It decreased by 4 kb/d to 1,706 kb/d. If the GOM was a state, its production would normally rank second behind Texas.
The March 2022 STEO projection for the GOM output has been added to this chart and projects output will be 1,850 kb/d in December 2023 with a local high of 1,865 kb/d in December 2022. This is 147 kb/d lower than the previous high of 2,012 kb/d in August 2019.
A Different Perspective on US Oil Production
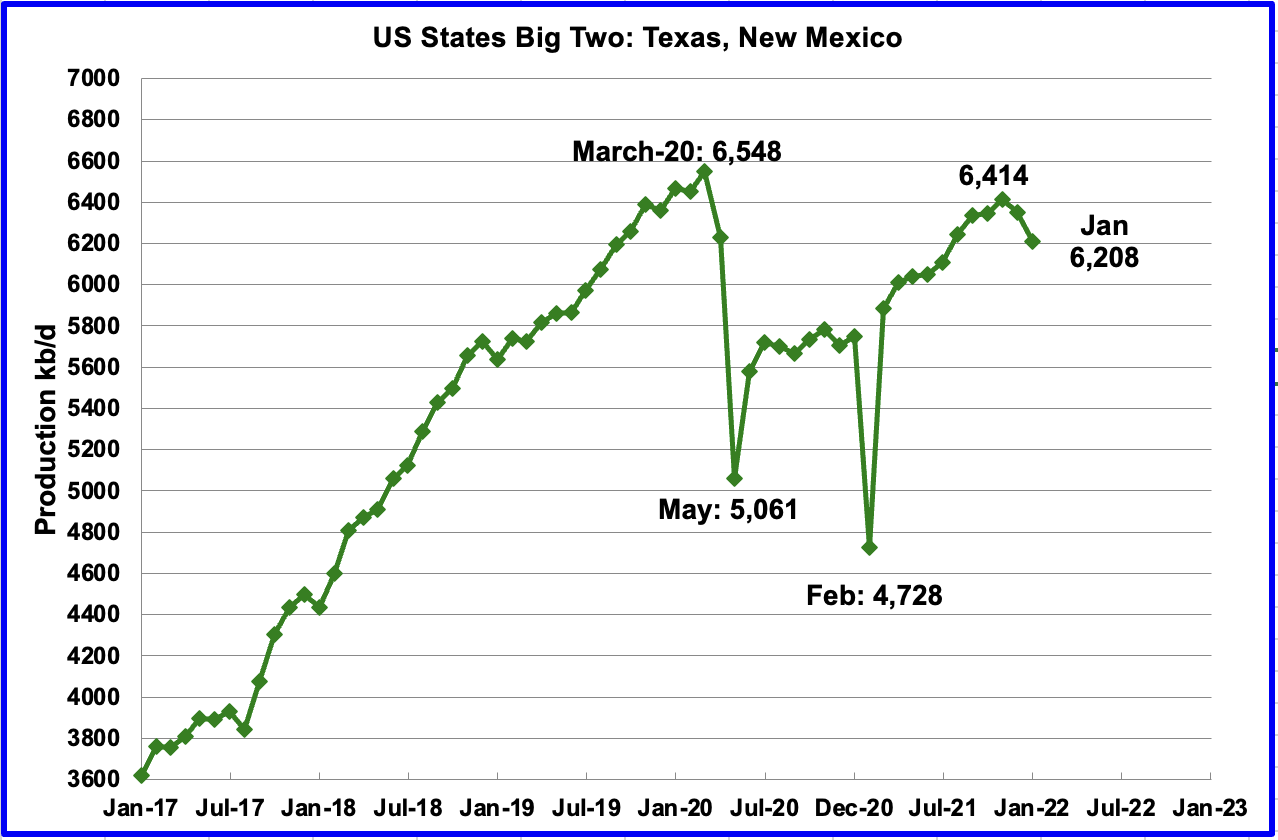
The Big Two states, combined output for Texas and New Mexico.
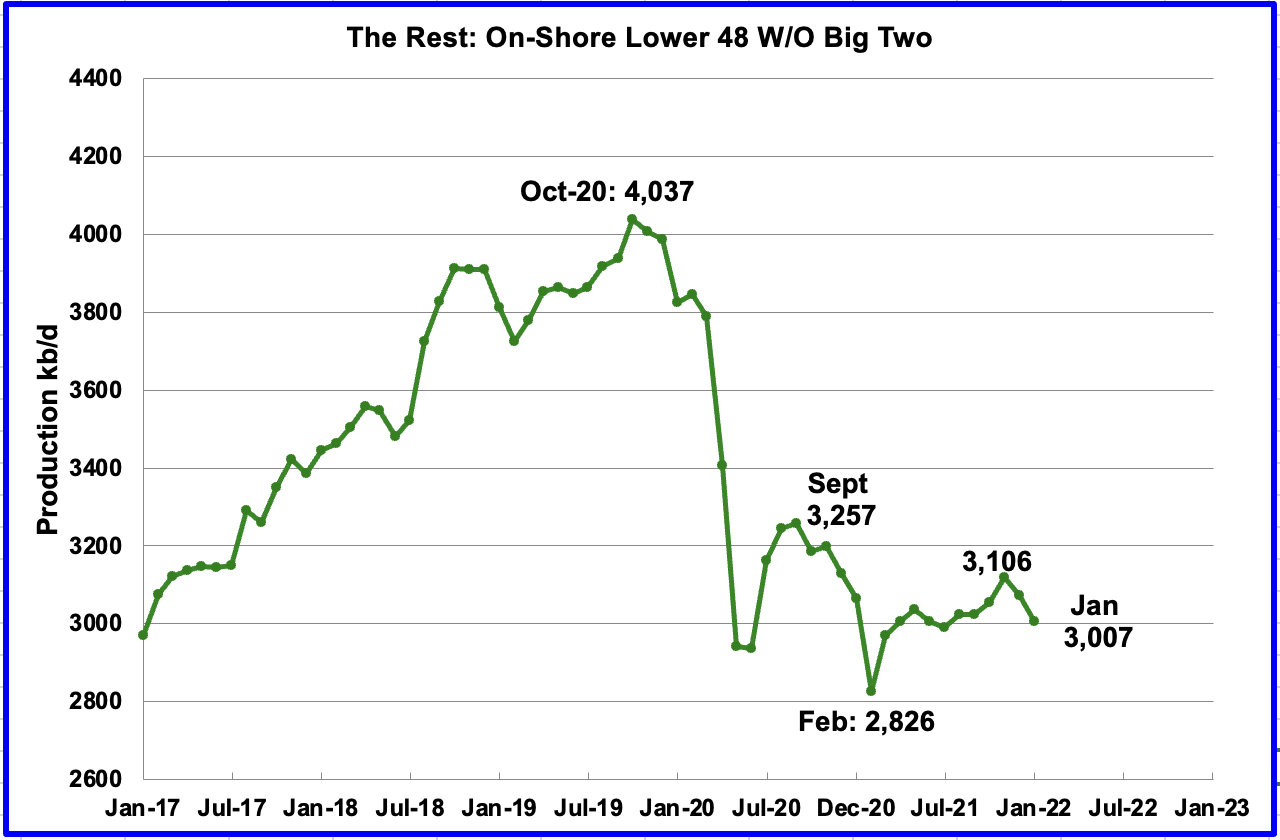
The Rest
To get a different perspective on US oil production, the above two charts have broken US state production into two groups, “The Big Two” and the “On-Shore L48 W/O Big Two” or The Rest.
January production declined again in the Big Two states. Output dropped by a combined 144 kb/d, with the majority coming from Texas, 120 kb/d. Possible contributing factors to the drop in January were bad weather, slow restarts associated with Christmas holidays and a lower number of frac spreads.
Rigs and Fracs
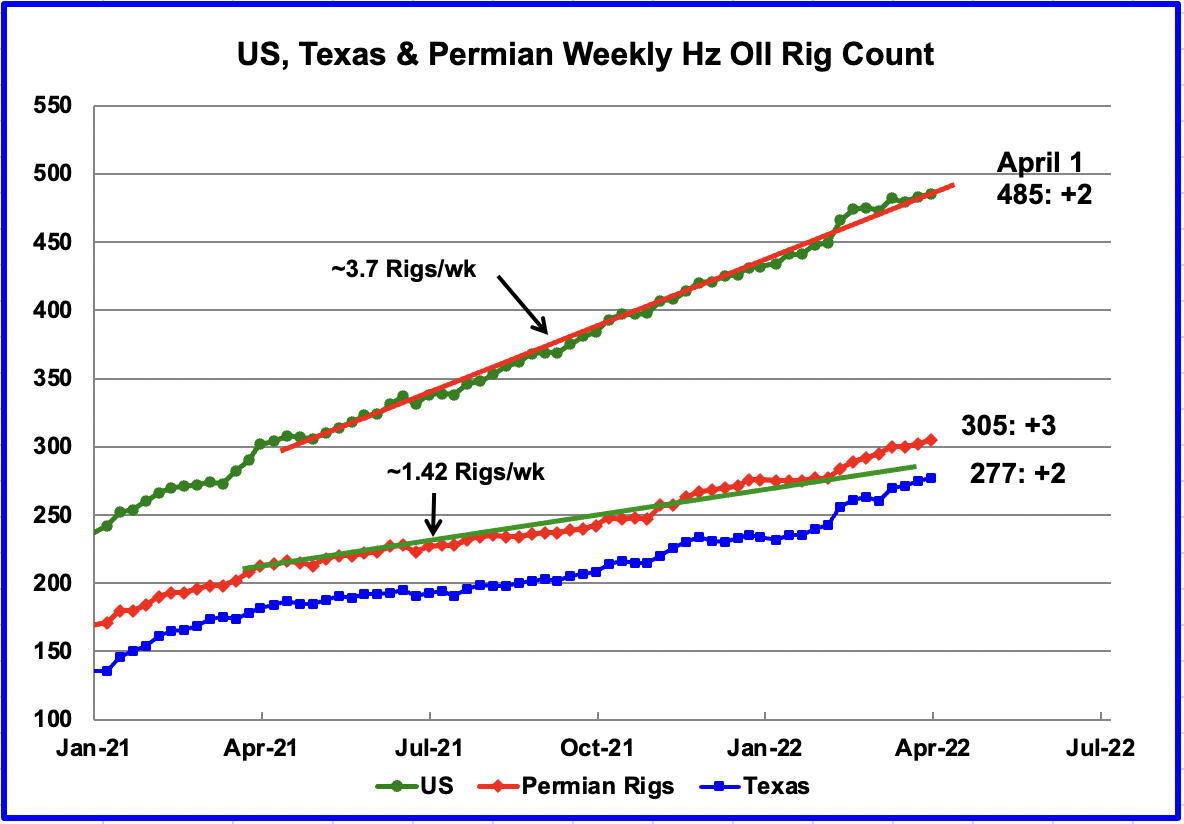
The US total Hz oil rig count for the week ending April 1 was 485, an increase of 2 over the previous week.
From the beginning of April 2021 to April 2022, the US has been adding Hz oil rigs at a rate of close to 3.7 rigs/wk. Over the period April 2021 to October 2021, the Permian added 1.42 rigs/wk, indicating that rigs were being added in other basins. However drilling activity in the Permian has been increasing since February 2022.
Since the first week February, the addition of Hz rigs in the Permian basin accelerated over the average rate as the red graph broke away to the upside from the green trend line. In the week ending April 1, the Permian Hz oil rig count increase by 3 to 305. The average rate of adding rigs from February to April 1 is close to 3.5 rigs per week.
Since the beginning of the year to the week ending April 1, the rig count in the NM Permian has bounced around 91 +/- 2. In the week ending April 1, 90 rigs were operational in the NM Permian. Over the same period, rigs in the Texas Permian increased from 183 to 305, an increase of 22. This indicates there are higher quality drilling areas in the Texas Permian.
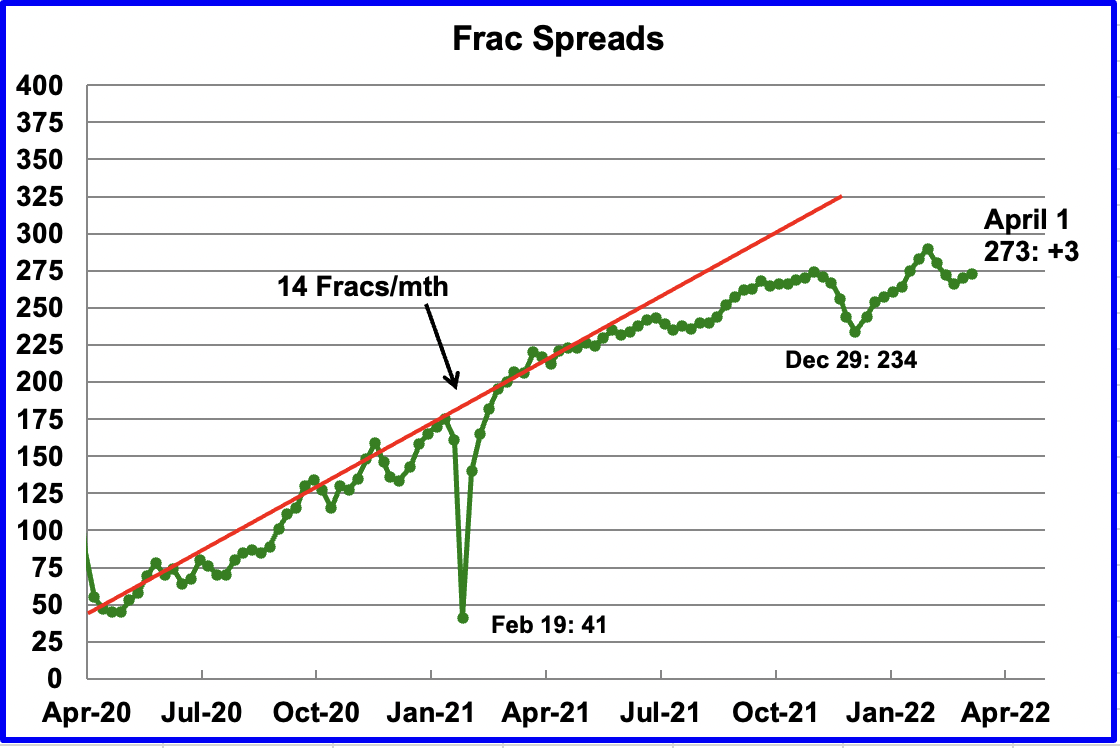
During December 2021, 37 frac spreads were decommissioned primarily due to the holidays and the total dropped to a low of 234 at the end of December. During the month of January, 27 frac spreads were reactivated and in February an additional 29 were added for total of 283.
As of the week ending April 1, the frac spread count had declined to 273, an increase of 3 from the previous week and down 10 from the middle of February. Also note it is 2 higher than the frac spreads operating in the week ending December 3, 2021.
Note that these 273 frac spreads include both gas and oil spreads, whereas the rigs information is strictly oil rigs.
WTI
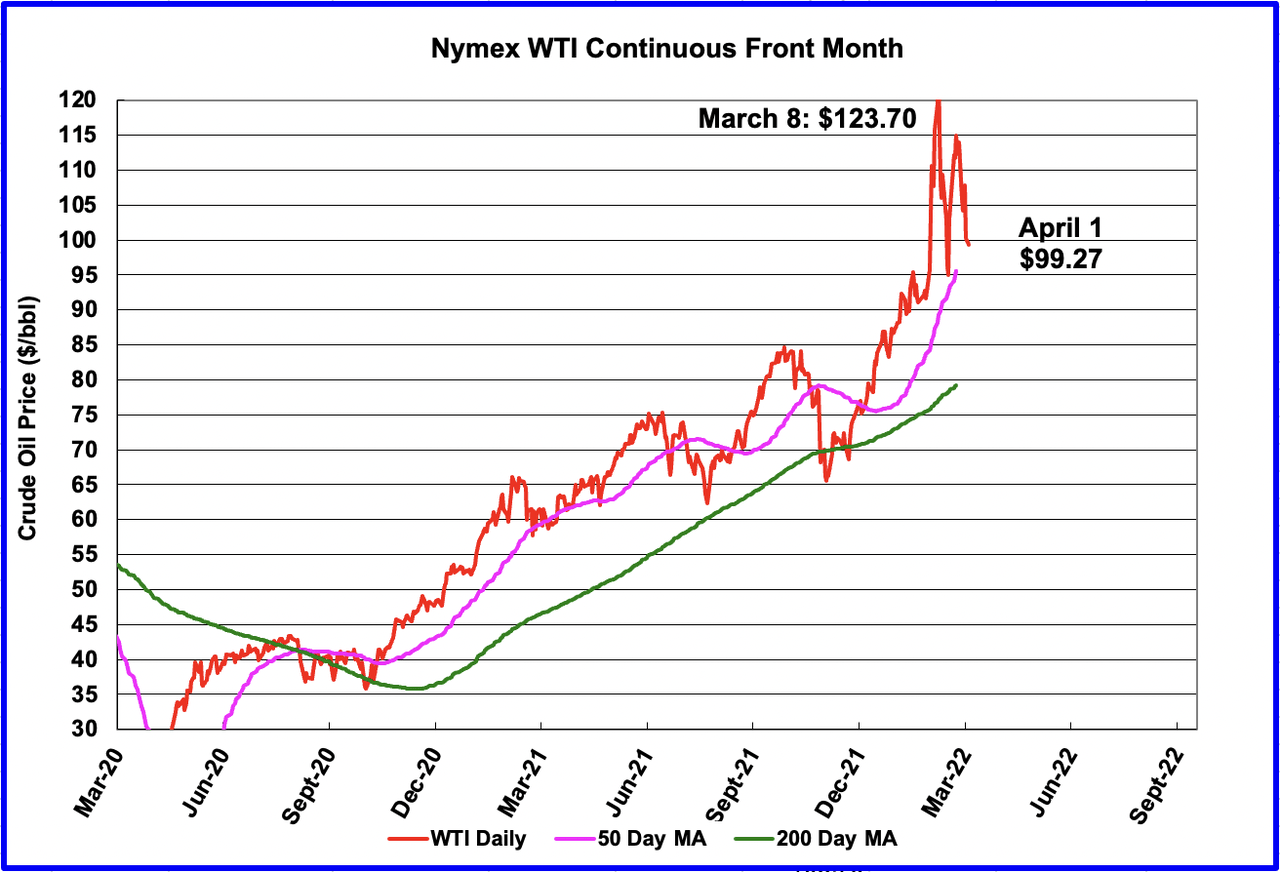
The WTI May contract settled on April 1 at $99.27/bbl. The price drop in the last few days occurred after the US announced it would release 1 Mb/d from the SPR over a period of 180 days.
1) Short Term Energy Outlook (STEO)
The March 2022 STEO provides projections for the next 24 months, starting with January 2022 to December 2023, for US C + C, OPEC and other oil production related parameters of interest.
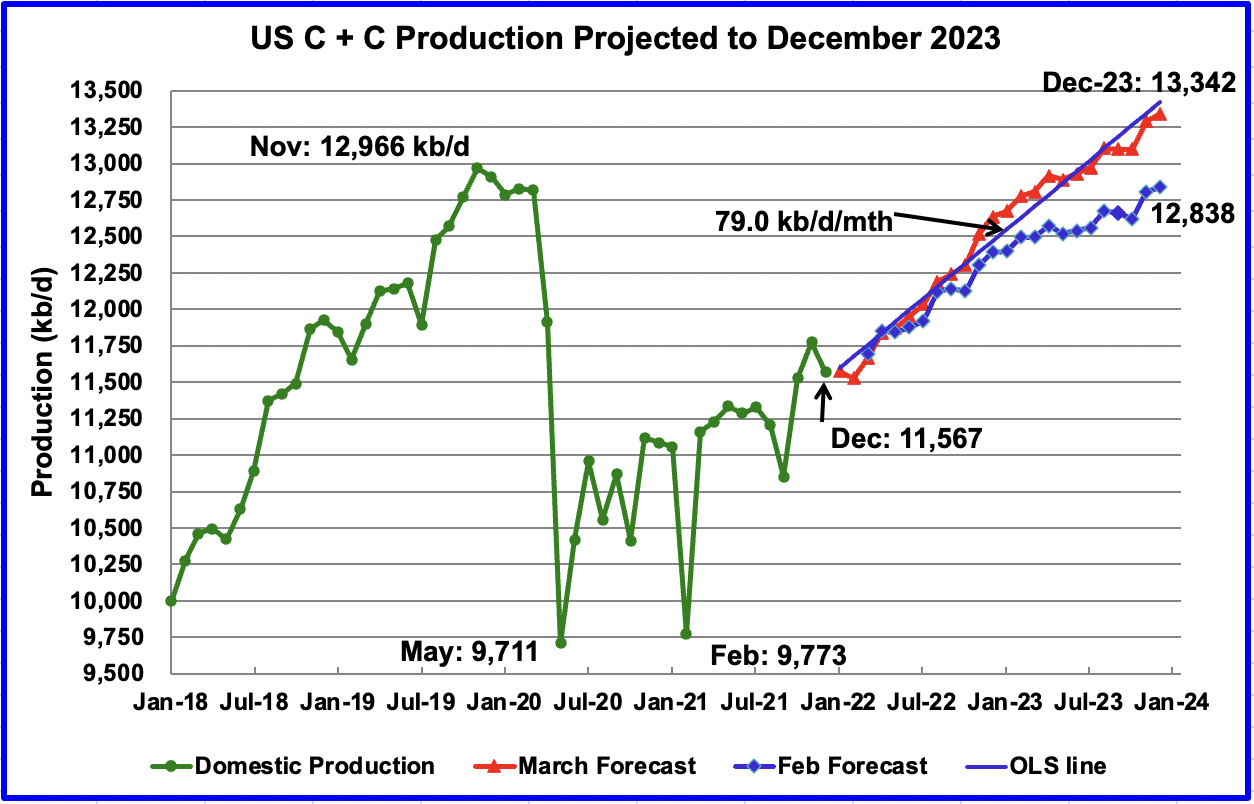
The March 2022 STEO has significantly revised upward its projected US oil output from January 2022 to December 2023. December 2023 has been revised up by 504 kb/d from the previous February 2022 STEO. The increase is probably related to the oil price increase shown in the WTI price chart further down. The projected price for WTI for December 2023 has been increased from $62/bbl to $79/bbl.
The biggest change in output occurs during 2022. The increase from January 2022 to December 2022 is 1,059 kb/d over these eleven months or 96.3 kb/d/mth. Almost unbelievable. From January 2023 to December 2023, production increases by 669 kb/d.
Note that the STEO is projecting essentially flat production for January and lower for February. While January actually dropped, it is encouraging to see that the STEO was not forecasting a January increase. The reason I note this is because the DPR and LTO sections below both show increasing January and February production.
Using only the projected data and fitting an OLS line through the January 2022 to December 2023 data, the STEO is forecasting production will increase at an average rate of 79 kb/d/mth, ending at 13,342 kb/d in December 2023. The average rate in the previous February report was 50.3 kb/d/mth. If the December 2023 output is achieved, it will be 376 kb/d higher than the November 2019 record.
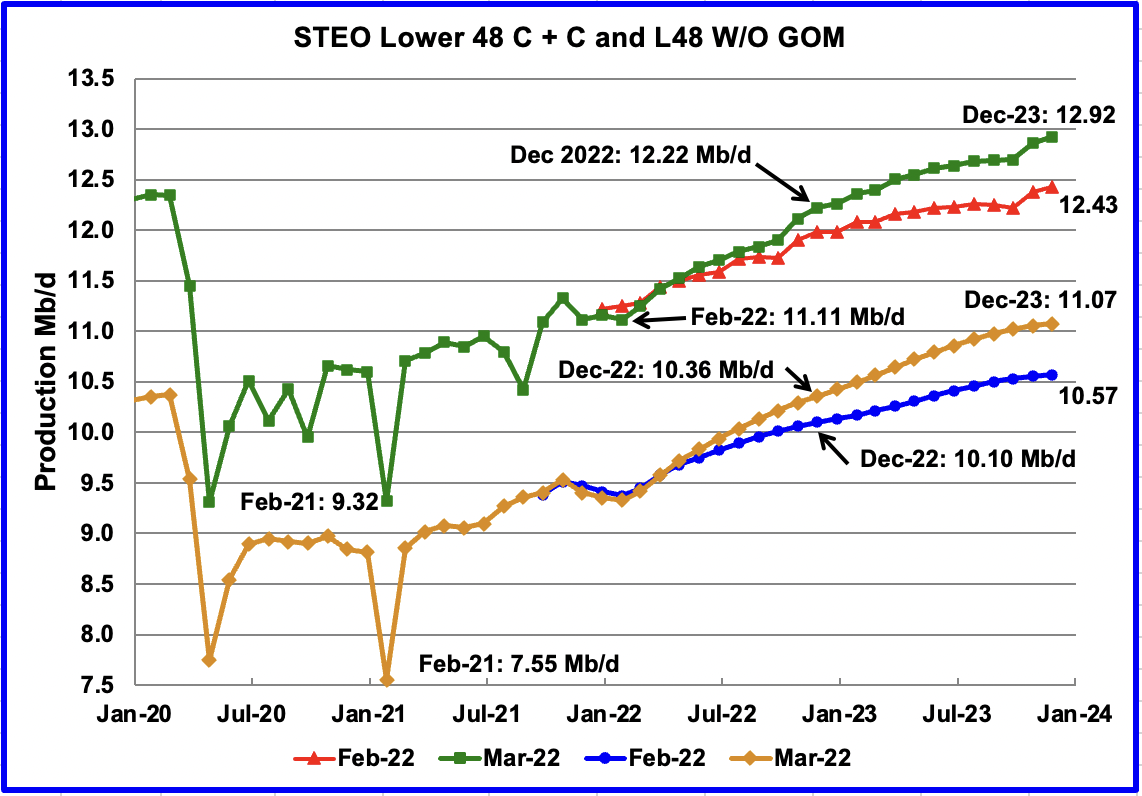
This chart compares the STEO’s forecast from the February report with the current March 2022 report to better illustrate the big change in the EIA’s forecast. For the Lower 48, the December 2023 output has been revised up by 490 kb/d from 12.43 Mb/d to 12.92 Mb/d.
The February STEO output projection for the Onshore L48 states has also been revised up to show increased production in 2022 and in 2023. The output projection for December 2023 has been increased by 500 kb/d to 11.07 Mb/d from the previous forecast of 10.57 Mb/d. From the orange graph, one can notice a definite slowing in the production rate in the latter half of 2023. Is this a hint of possible further slowing in monthly production increases beyond 2023?
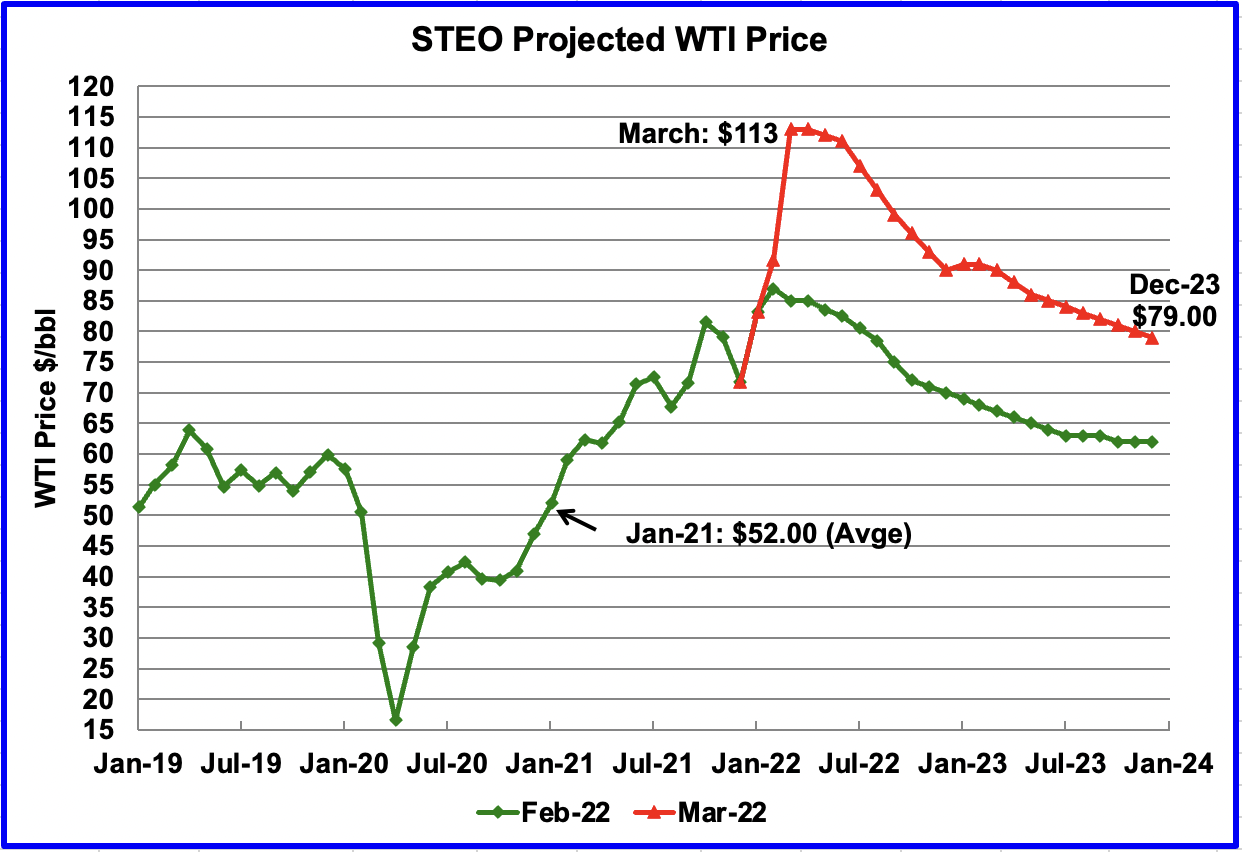
The March 2022 STEO oil price forecast continues to show a steady decline from the EIAs new March peak of $113/bbl to $79/bbl in December 2023. Essentially the EIA is continuing to forecast that the only direction for the price of WTI going forward is down to $79/bbl.
The May contract settled at $99.27 on April 1, $12.73/bbl lower than the EIA’s forecast of $112.00/bbl average for the May contract.
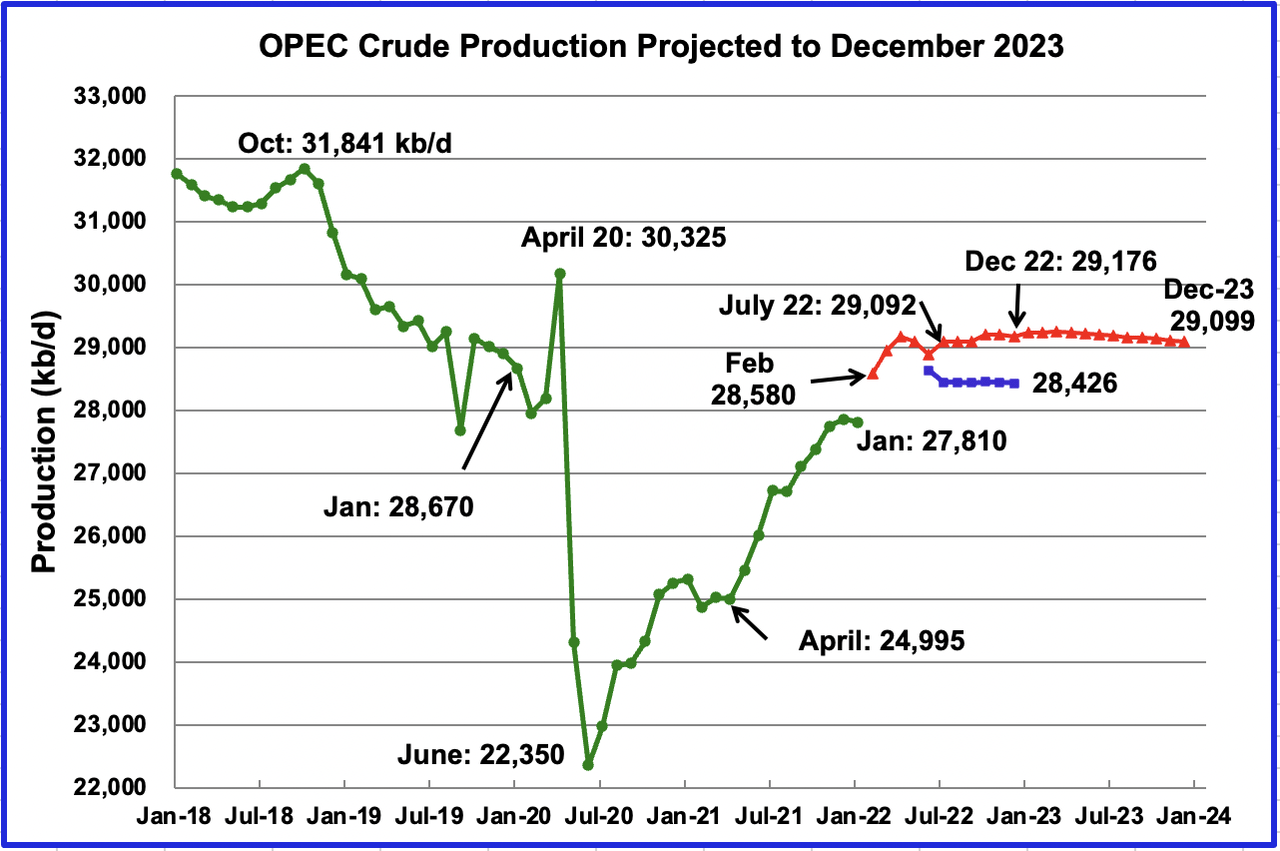
This chart shows the STEO’s March forecast for OPEC crude output from February 2022 to December 2023 compared to their December 2022 forecast. (Blue markers). Output for December 2022 has been increased by 750 kb/d in going from the December report to March. This is an additional increment of 200 kb/d over the February report. It is not clear if this increase is expected due to expected decreased Russian production associated with sanctions on Russian oil.
OPEC’s output is projected to increase from January 2022 to July 2022 by 1,366 kb/d to 29,176 kb/d. After July 2022, output remains essentially flat at slightly above 29,000 kb/d out to December 2023.
For February 2022, the EIA STEO forecasts OPEC production to be 28,580 kb/d. Actual February production as reported by OPEC was 28,473 kb/d, lower by 107 kb/d.
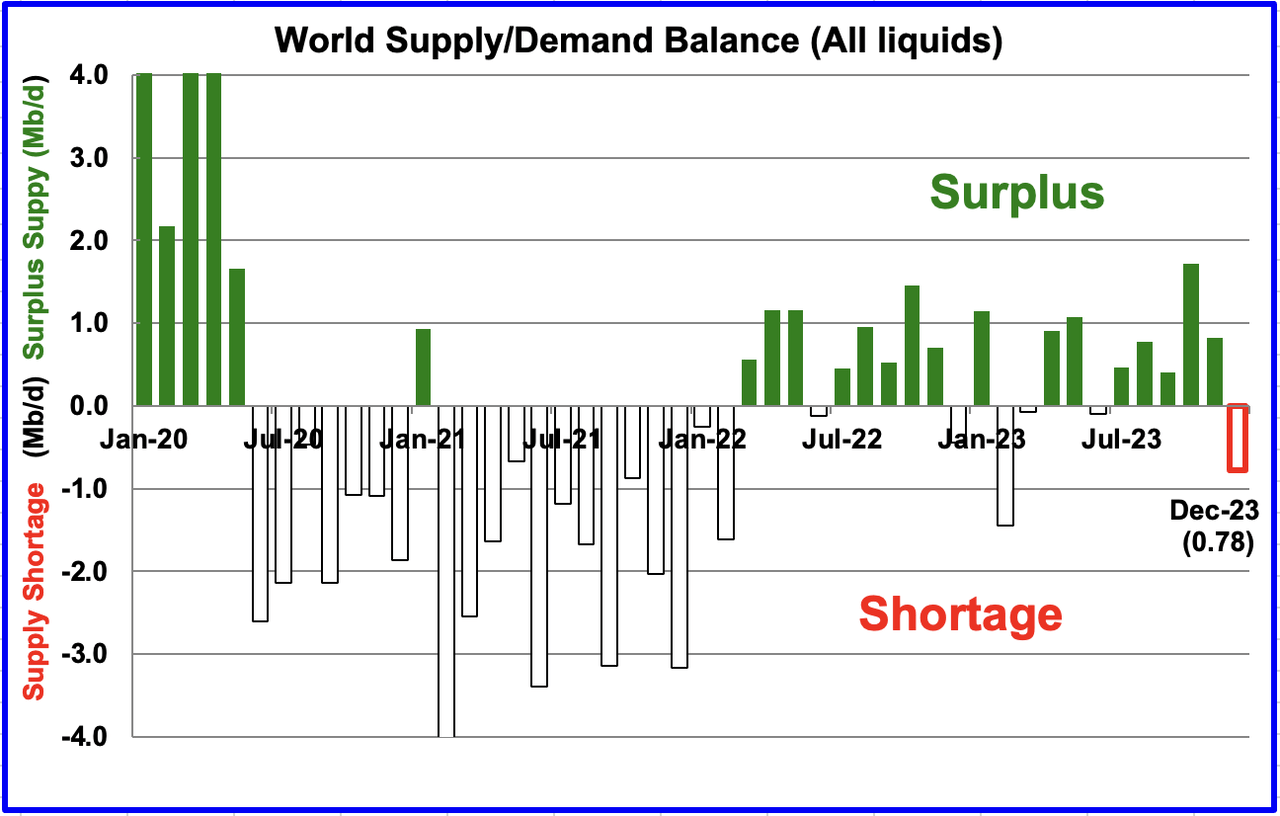
This chart shows the historical world supply/demand balance up to January 2022 and after that, the EIA’s forecast out to December 2023.
From February 2022 to December 2023, the STEO is forecasting an average monthly surplus of close to 421 kb/d, 457 kb/d lower than last month’s average. The sanctions on Russian oil and increased prices could see a big revision to this forecast next month.
2) Drilling Productivity Report
The Drilling Productivity Report (DPR) uses recent data on the total number of drilling rigs in operation along with estimates of drilling productivity and estimated changes in production from existing oil wells to provide estimated changes in oil production for the principal tight oil regions. The March DPR forecasts production to April 2022 and the following charts are updated to April 2022.
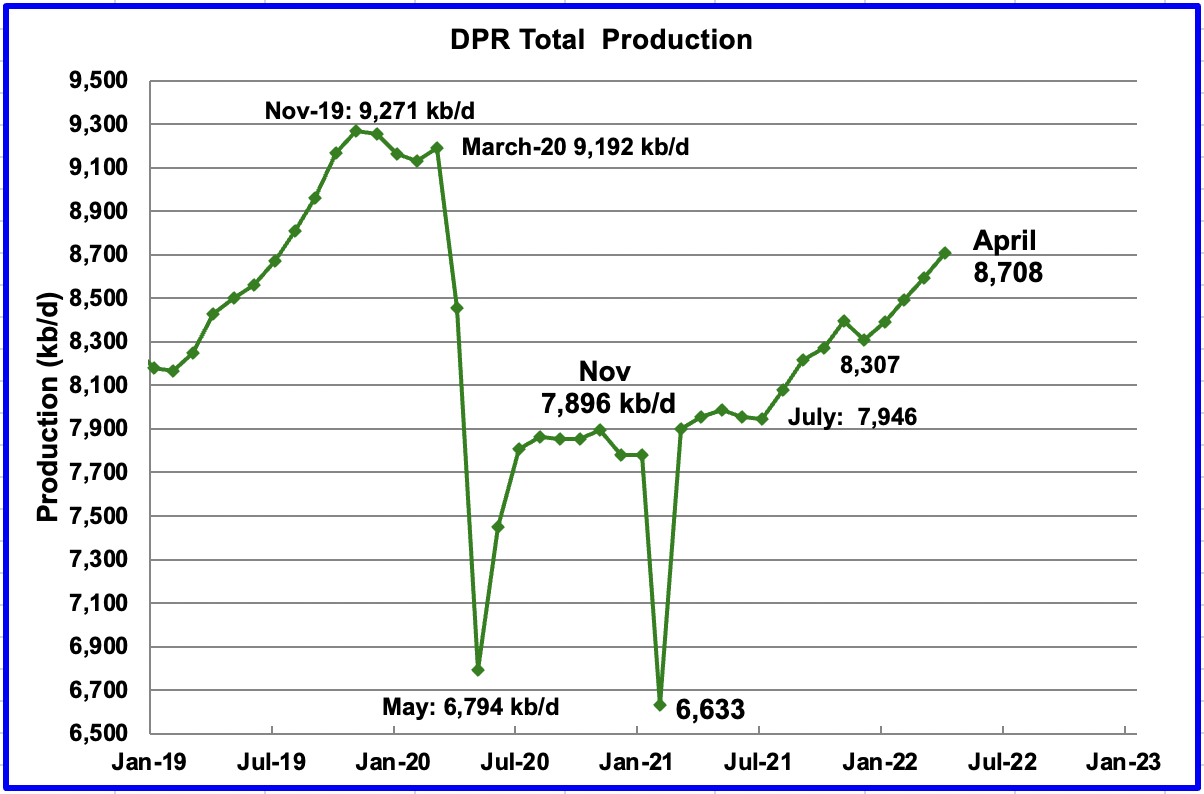
Above is the total oil production projected to April 2022 for the 7 DPR basins that the EIA tracks. Note that DPR production includes both LTO oil and oil from conventional fields.
The DPR is projecting that output for April 2022 will increase by 117 kb/d to 8,708 kb/d. From December 2021 to March 2022, output in the DPR basins is forecast to increase by 401 kb/d or by an average of 100 kb/d/mth. Note that this monthly production rate is close to the STEO rate of 96.3 kb/d projected for all of 2022 in the STEO section above.
Did April production really increase? In the February DPR report, March output was projected to be 8,707 kb/d. The March report revised March output down to 8,592 kb/d and April is now only 1 kb/d higher at 8,708 kb/d than the original February forecast.
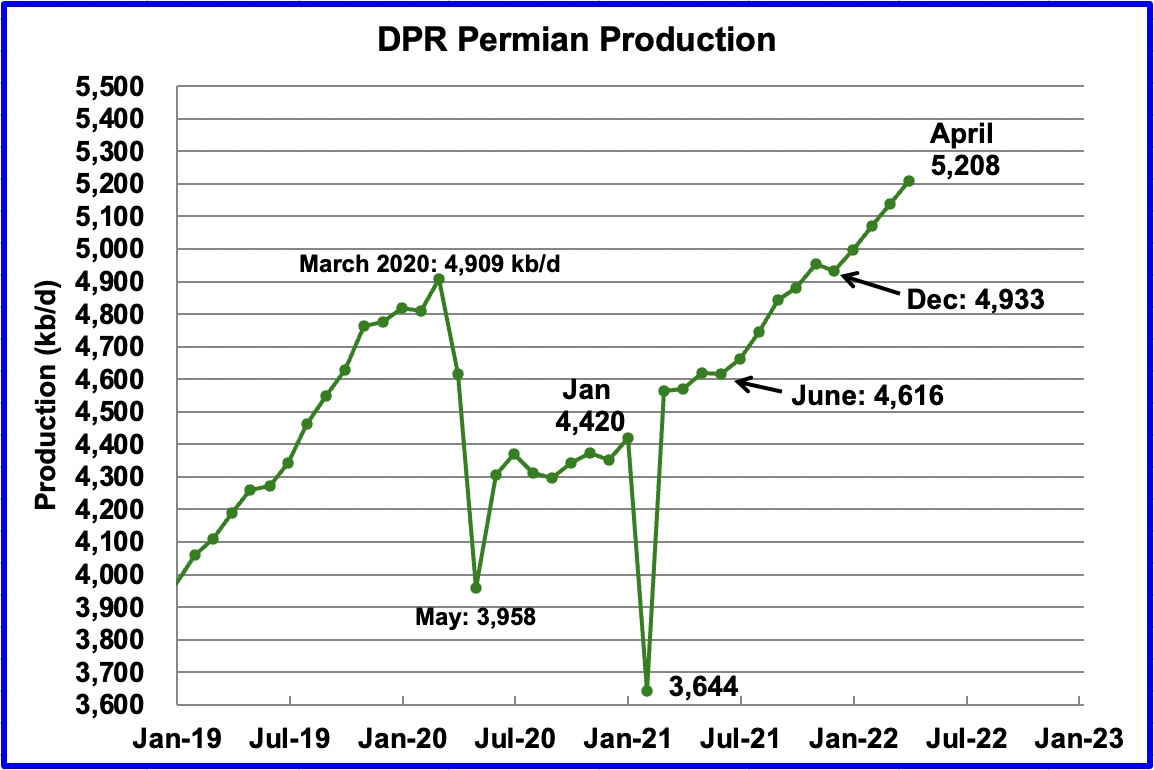
Permian output exceeded 5,000 kb/d in February 2022 and continues to increase. In April, production increased by 70 kb/d to a new high of 5,208 kb/d. From December to April, production is forecast to increase by 275 kb/d or at an average rate of 68.8 kb/d/mth. If the Permian were part of OPEC, at 5,208 kb/d it would be the second largest producer after Saudi Arabia.
Due to revisions, April’s Permian output is just 3 kb/d higher than the DPR’s March forecast of 5,205 kb/d reported in the previous February report.
During February, 343 wells were drilled and 429 were completed in the Permian. The completed wells added 340 kb/d to February’s output for an average of 793 kb/d/well. The overall decline was 268 kb/d which resulted in a net increase of 72 kb/d. Of the 409 completed wells, 338 were required to offset the decline. It is the completion of the additional 91 DUCs, over and above those drilled, that accounts for the increase in the production in the Permian.
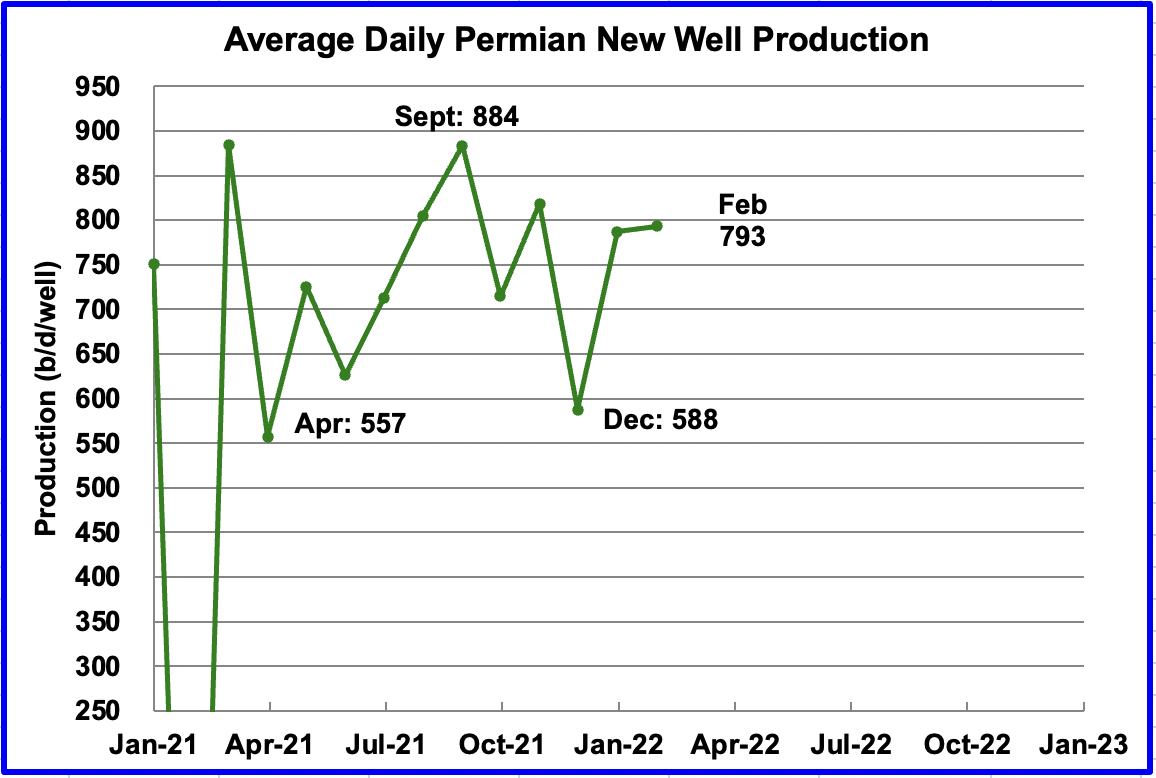
This chart shows the daily production from the average new Permian well tracked on a monthly basis. The daily output for new Permian wells was divided by the number of completed wells, as reported in the DPR and DUC reports.
For instance, during February, new wells produced 340 kb/d from 429 wells for an average of 793 b/d/well. The DPR back checks their earlier estimates and it appears that the average first month output is close to 800 kb/d. December dropped due to bad weather in Texas. Well production data is only available up to February to make this estimate.
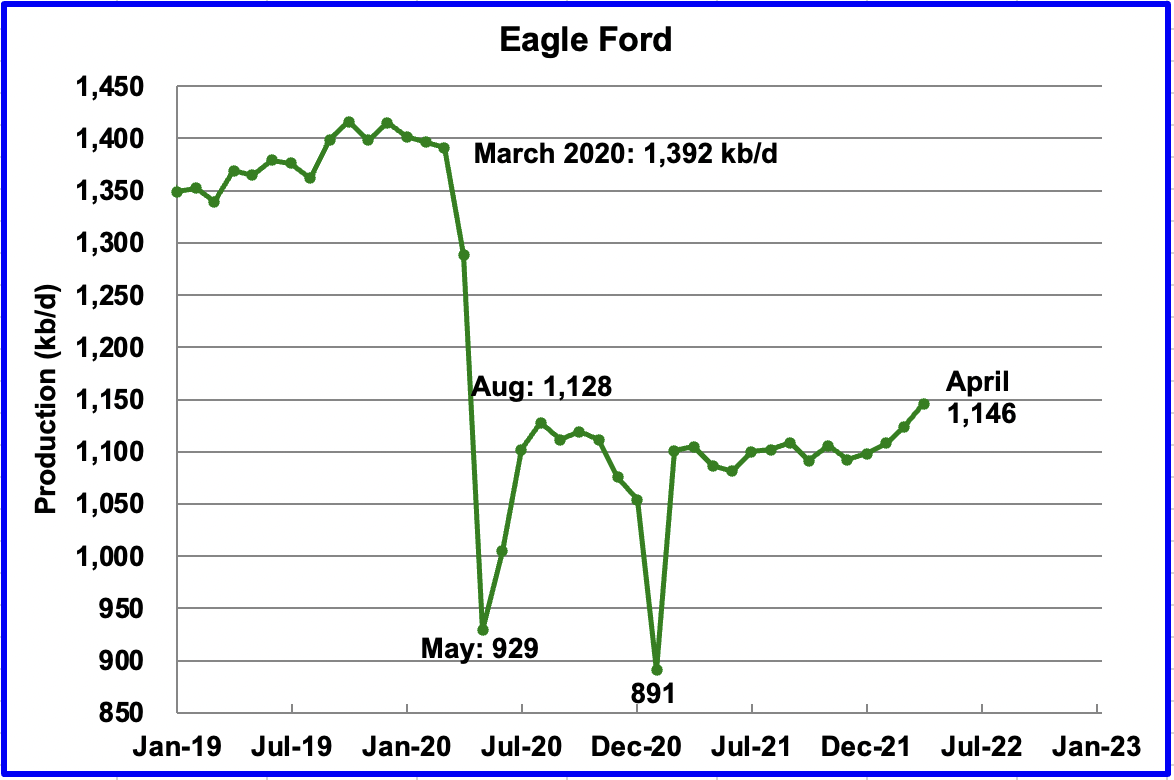
Output in the Eagle Ford basin has been showing an increasing trend since January 2022. For April, output is expected to increase by 23 kb/d to 1,146 kb/d. Since the beginning of the year, 9 rigs have been added for a total of 47, which explains the increasing output.
Again April’s output is the same as was reported for March in last month’s report.
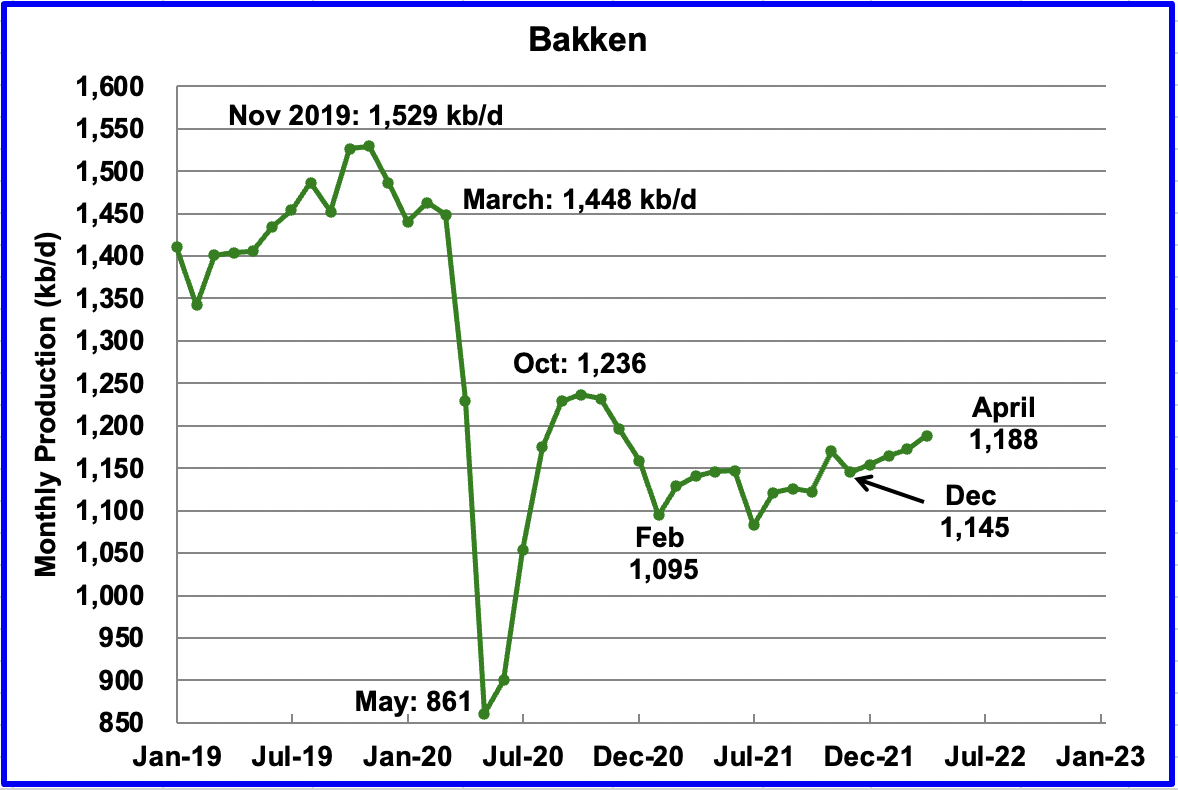
The DPR forecasts Bakken output in April to be 1,188 kb/d an increase of 16 kb/d over March. In this case, April production is 10 kb/d lower than was forecast for March in the previous report.
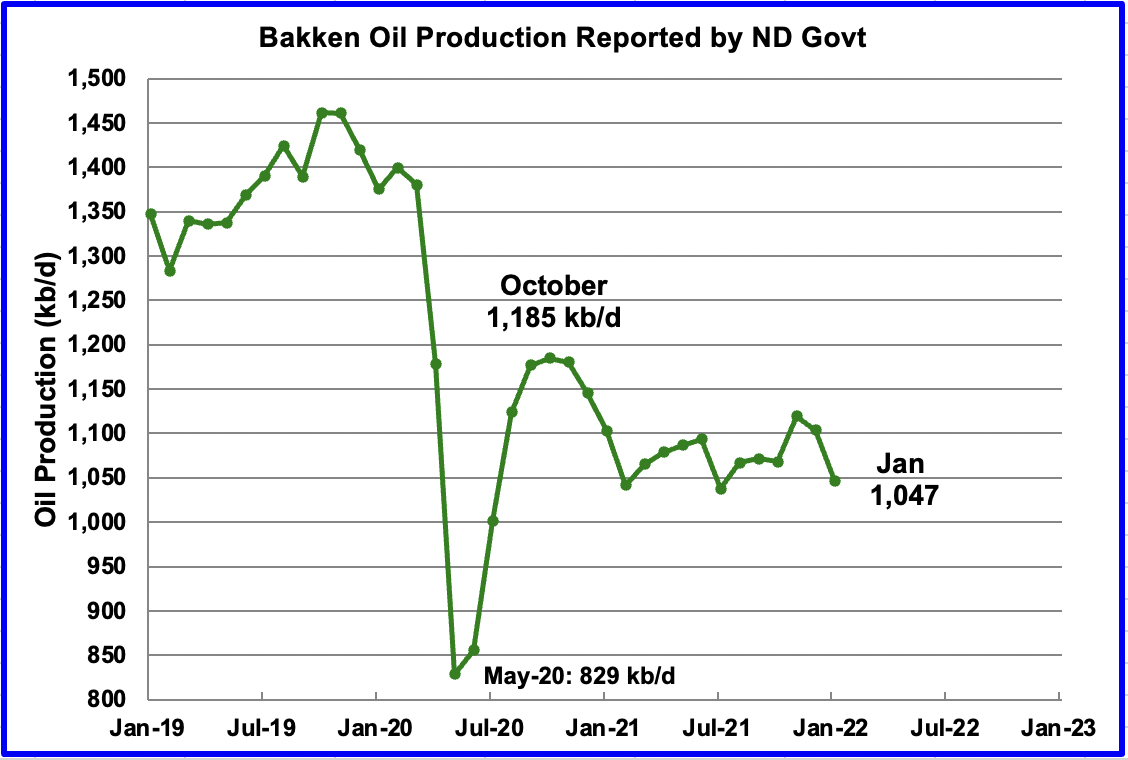
According to the North Dakota Oil and Gas division, January production fell by 57 kb/d. Note this drop is not shown in the DPR chart above.
According to this Source, Helms said the prospects of North Dakota returning to being No. 2 in oil production “are slim to pretty far away.”
Helms reported last month that New Mexico has replaced North Dakota as No. 2 in oil production.
As of January, North Dakota has 16,856 (preliminary number) producing wells. The month before the state had 17,200 producing wells.
Helms said the number of well completions has been volatile since the pandemic as the number of active completion crews dropped from 25 to one, then increased to 11 this week
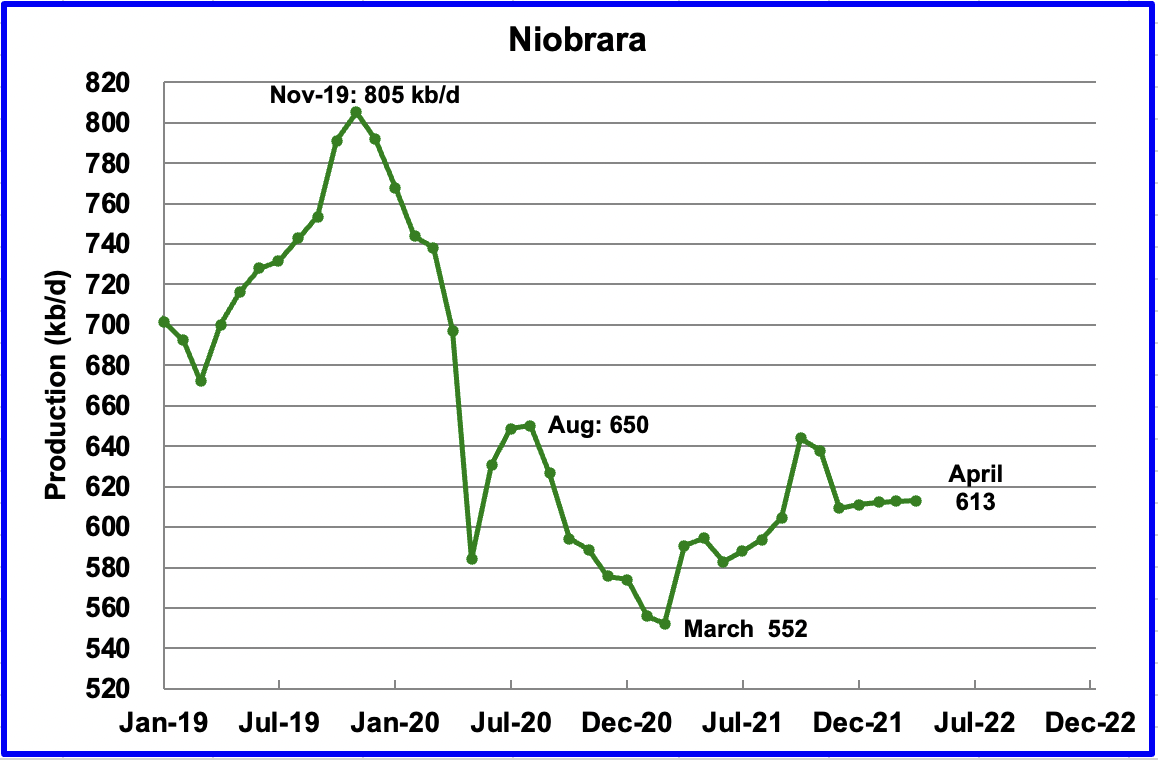
Output in the Niobrara is now showing signs of starting to plateau at 613 kb/d.
DUCs and Drilled Wells
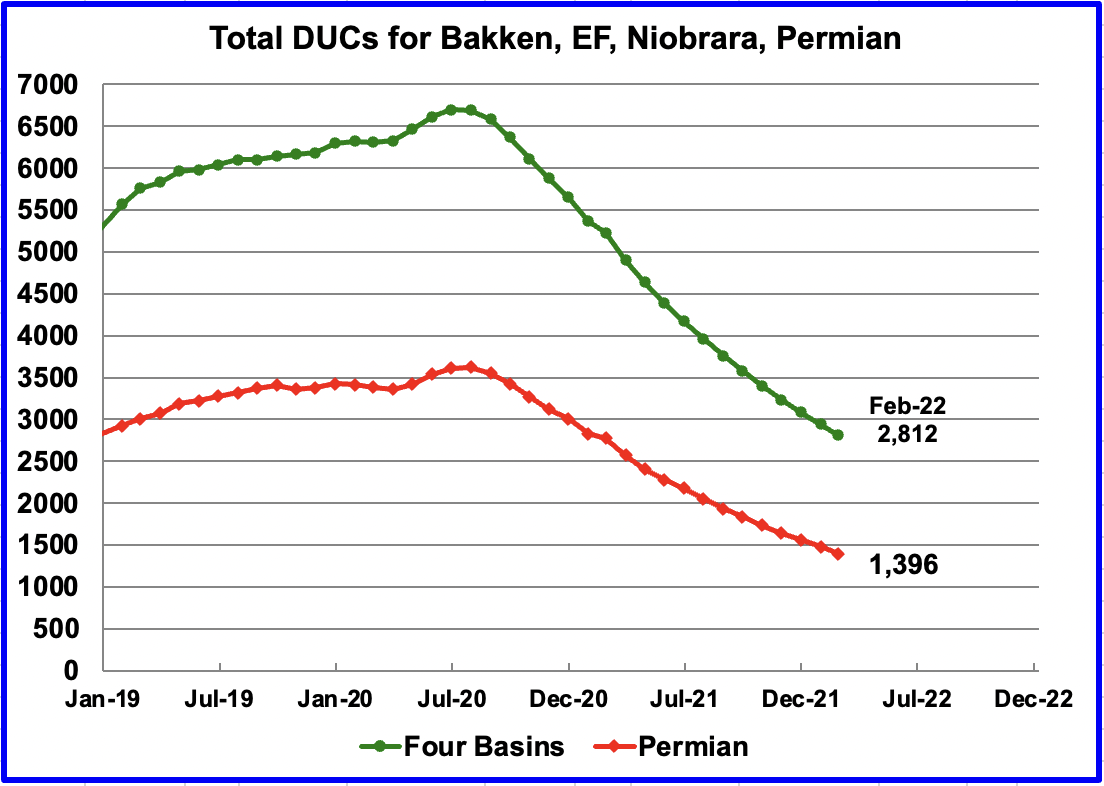
The number of DUCs available for completion has continued to fall every month since July 2020. Prior to July more wells were drilled than were being completed.
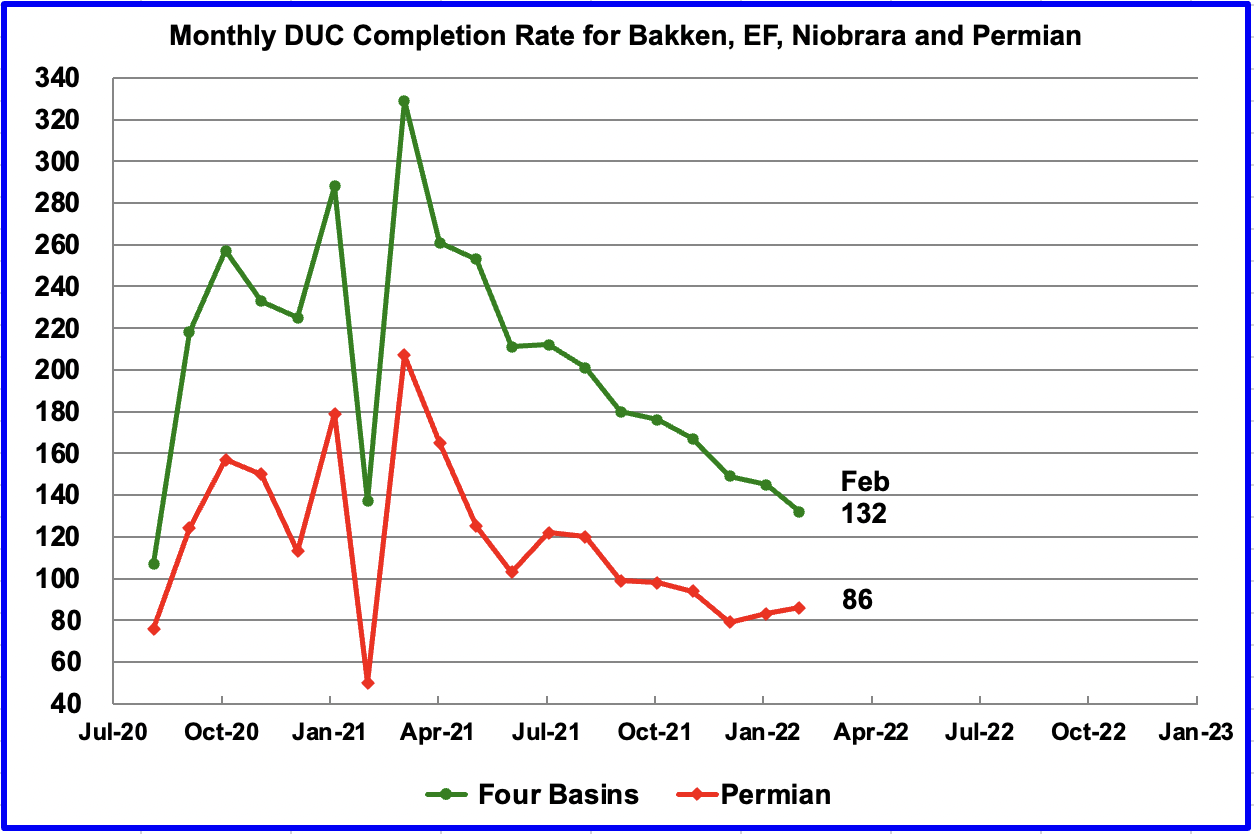
In these four primarily oil basins, the monthly completion rate of DUCs started to slow after peaking in March 2021. For example, in March 2021, 329 DUCs were completed. In February 2022, 132 DUCs were completed.
However in the Permian the trend has changed. The completion of DUCs has increased for the last two months. In February 86 DUCs were completed, up 3 from 83 in January.
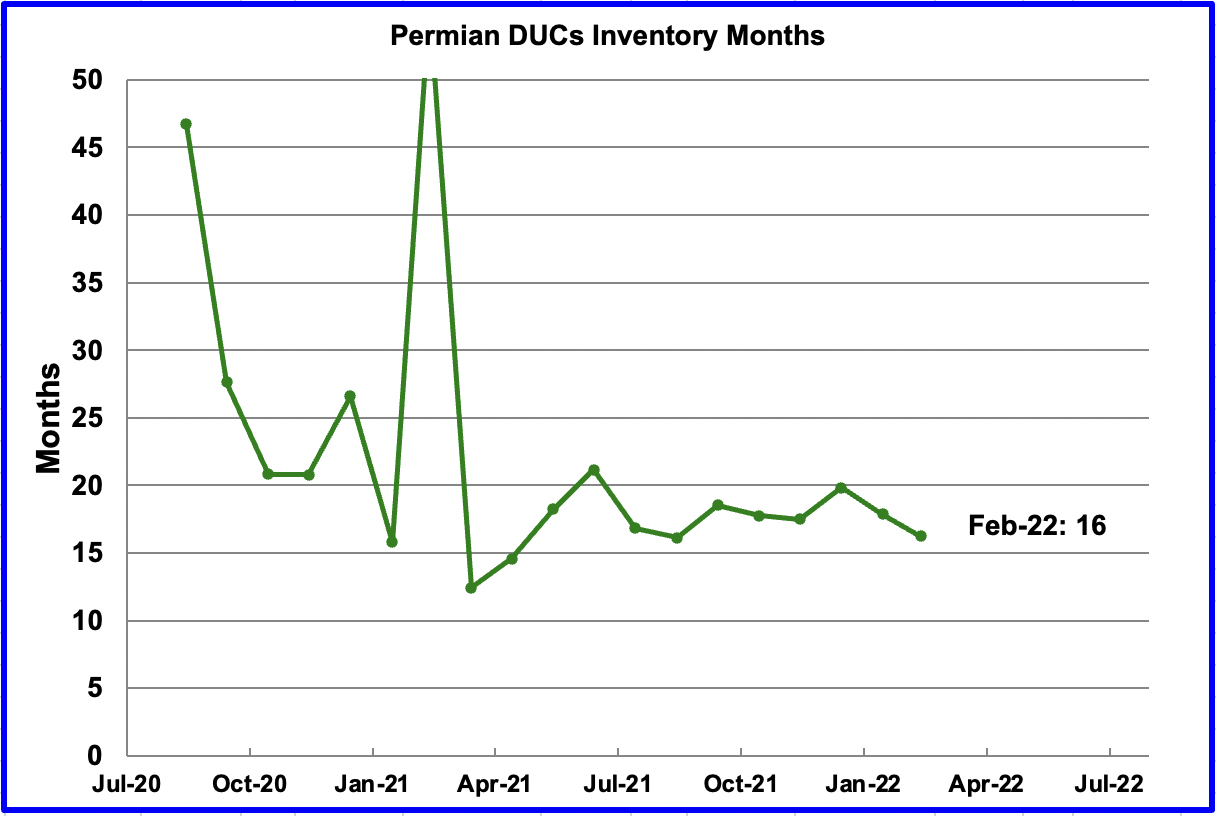
If Permian DUCs were to be completed at the latest rate of 86 DUCs/mth, that translates into 16 months of inventory, assuming the remaining 1,396 are all commercially viable. Interestingly, this 15 to 17 months supply of DUCs has remained fairly constant since July even though the number of DUCs continues to drop every month.
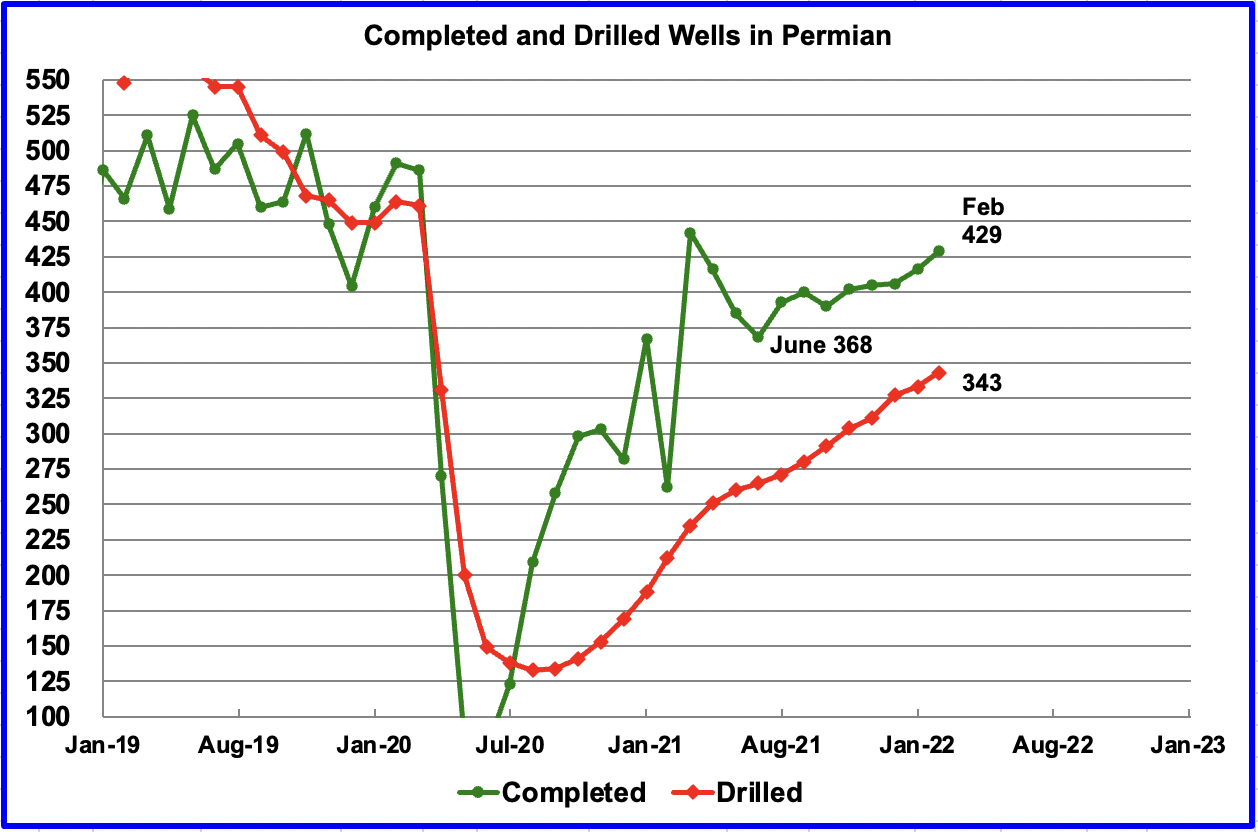
In the Permian, the monthly completion of wells has been increasing since the low of 368 in June. In February 429 wells were completed, 13 more than in January. Over the same time, 343 new wells were drilled an increase of 10 over January.
3) LIGHT TIGHT OIL (LTO) REPORT
The EIA’s LTO database provides information on LTO production from seven tight oil basins and a few smaller ones. The March 2022 report updates tight oil production to February 2022.
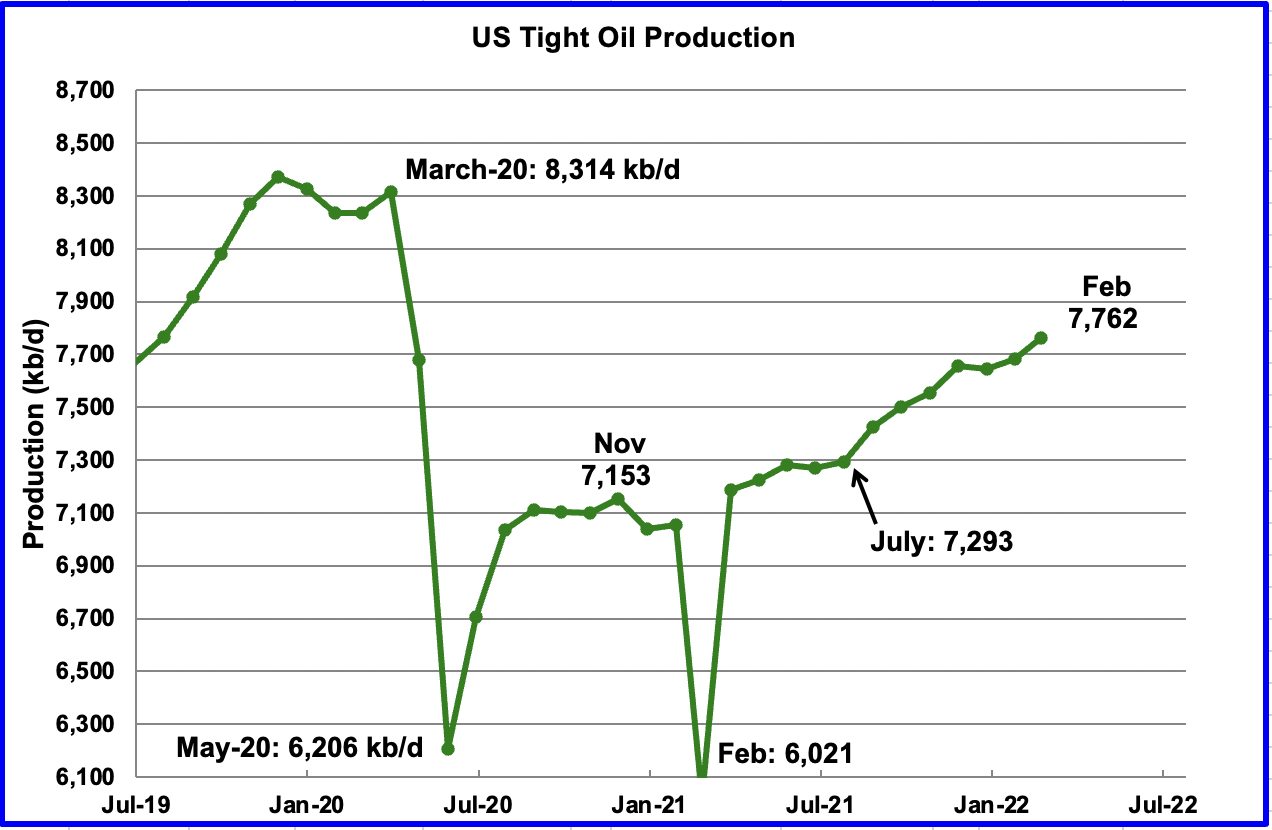
In contrast to last month’s report, the March LTO report has made minimal revisions to the previous production numbers. February’s LTO output increased by 78 kb/d to 7,762 kb/d. From July to February, output increased by 469 kb/d or at an average rate of 67 kb/d/mth.
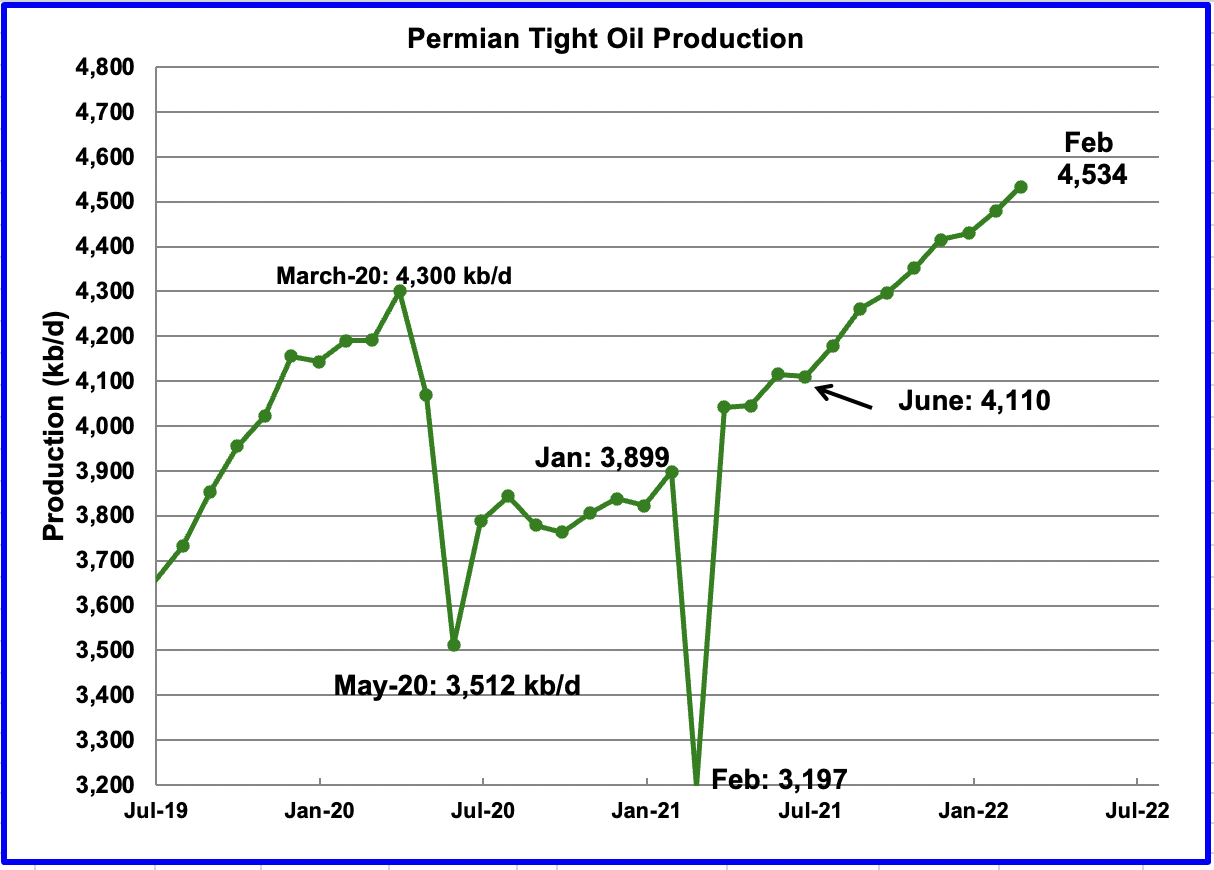
Permian LTO output first reached a new high of 4,352 kb/d in October 2021. February’s output increased by 64 kb/d to 4,534 kb/d and is 234 kb/d higher than the previous high of 4,300 kb/d in March 2020.
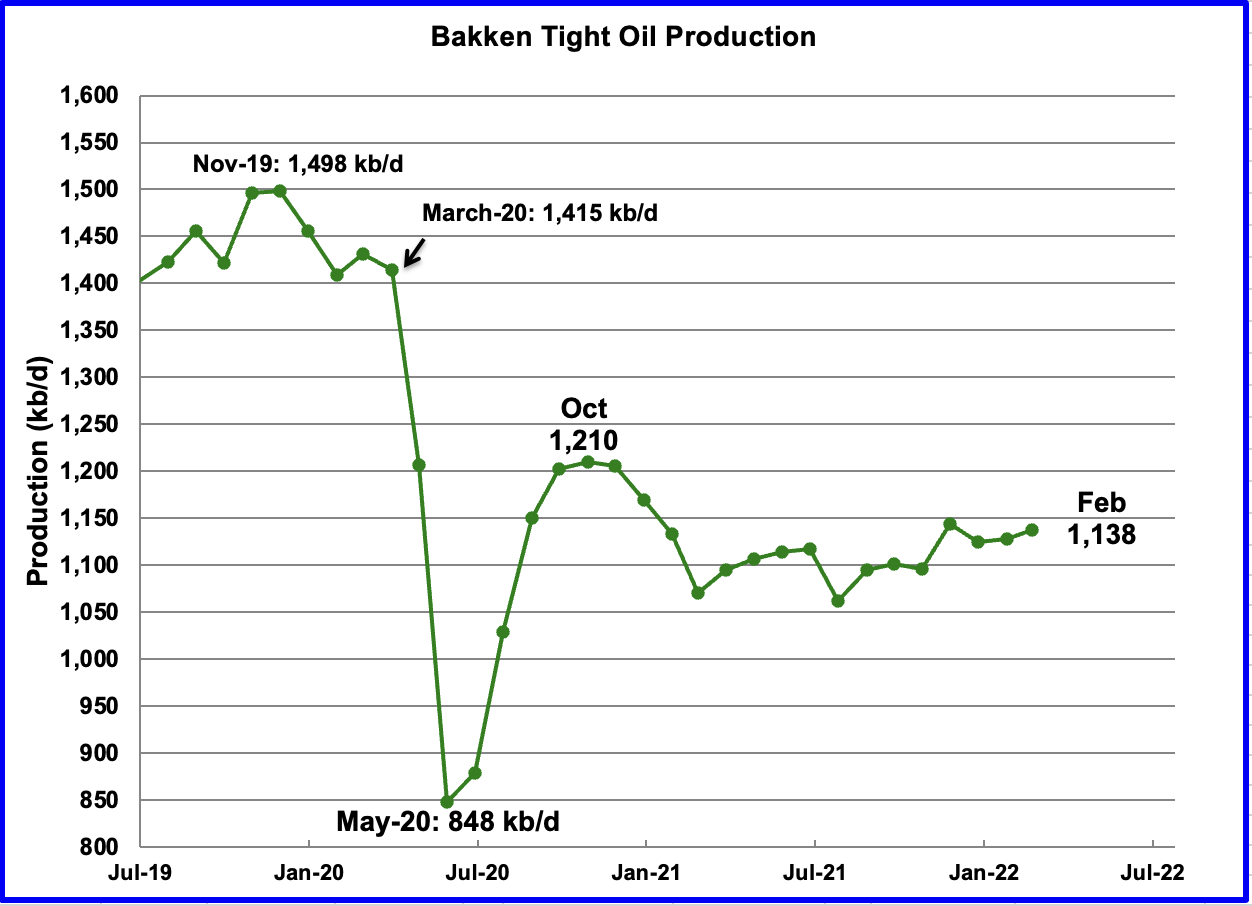
The Bakken’s February output increased by 10 kb/d to 1,138 kb/d. Note it is still below the October 2020 level of 1,210 kb/d.
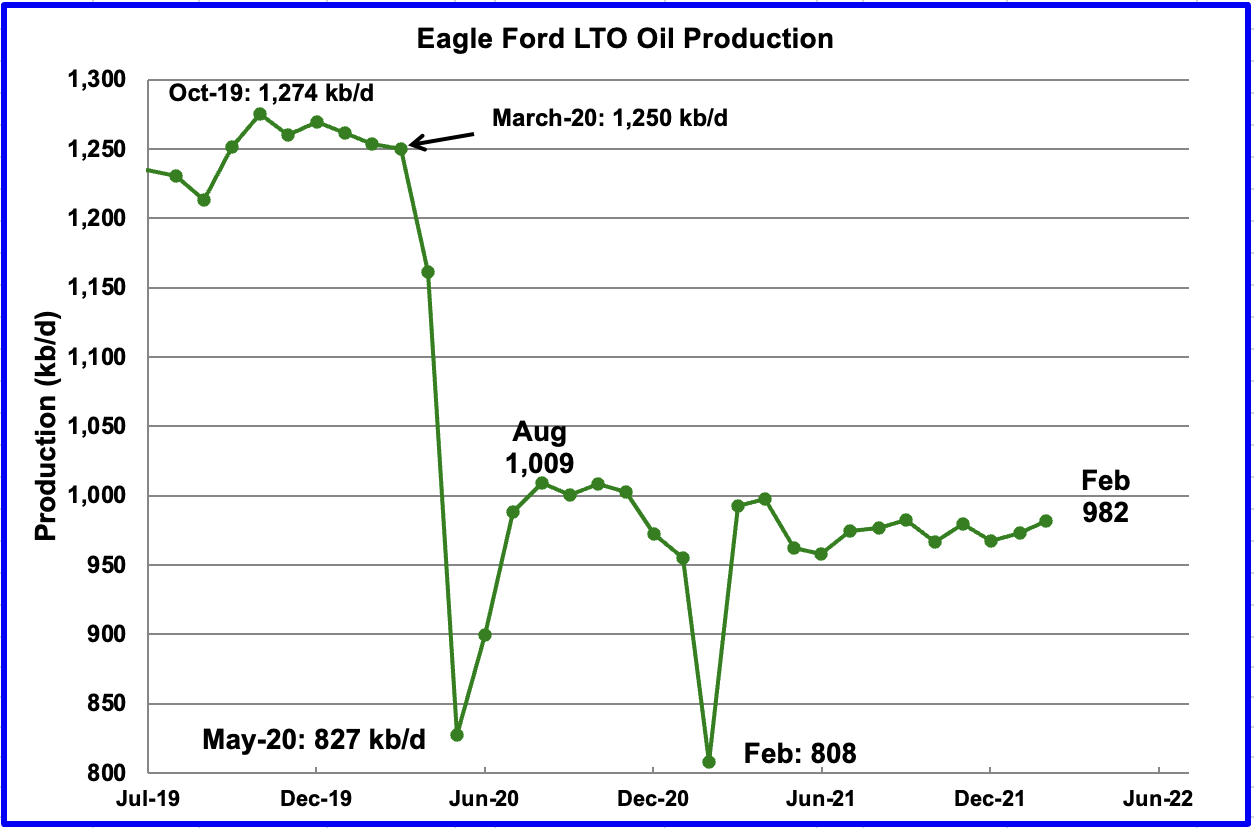
Production in the Eagle Ford basin since February/March 2021 has been essentially flat. Are the drillers doing this intentionally or is it just accidental?
The Eagle Ford basin produced 982 kb/d in February, which is lower than the August 2020 output of 1,009 kb/d.
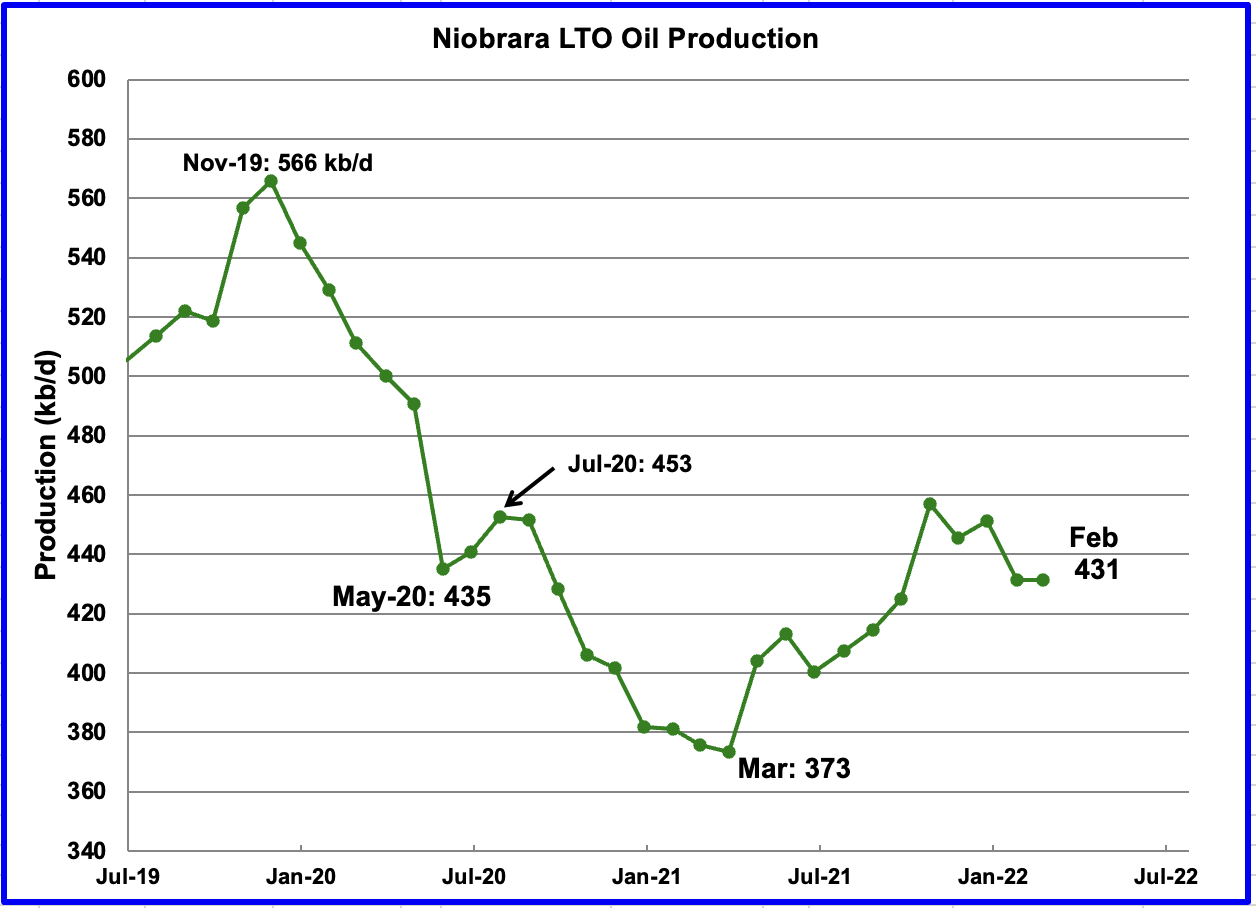
After increasing production from March 2021 to October 2021, output in the Niobrara began to drop in November 2021. February’s output was flat at 431 kb/d.
From July to March, the rig count in the Niobrara increased from 10 to 14.
On-Shore L48 Conventional Production
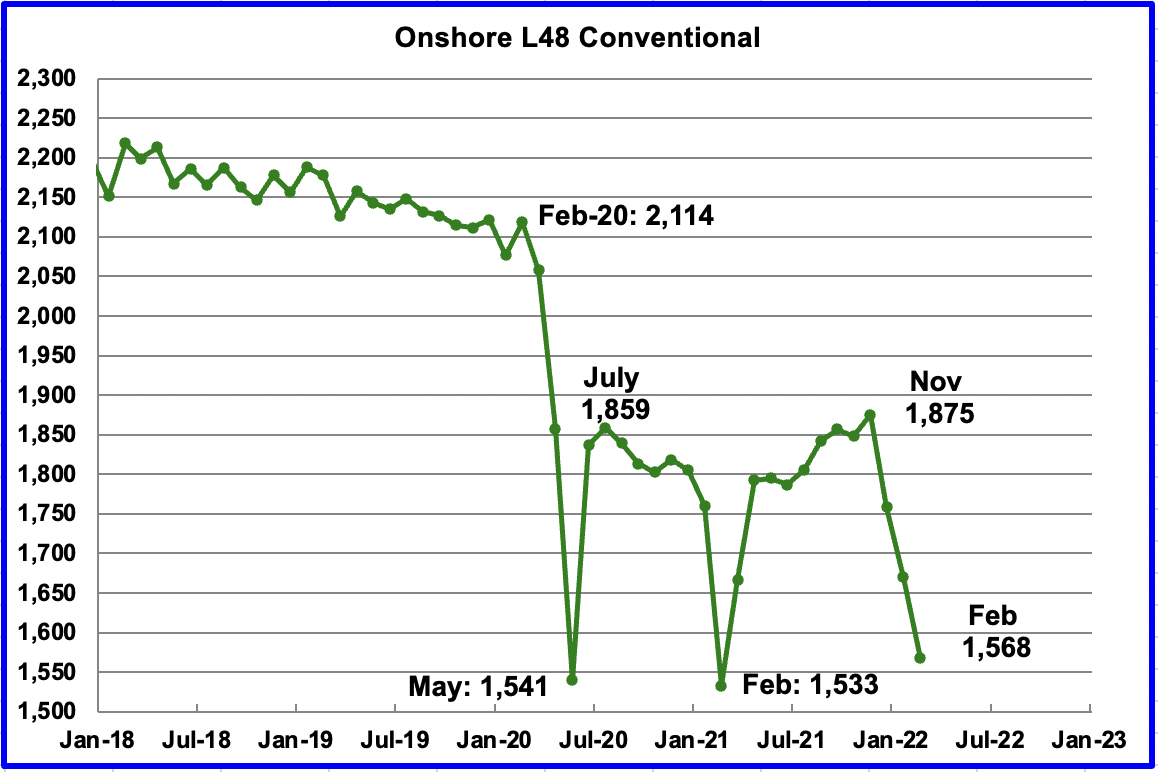
Conventional oil output in the Onshore L48 declined by 102 kb/d in February to 1,568 kb/d. This estimate is based on a combination of the expected February LTO output and the March 2022 STEO report that has a forecast for the US On-shore L48 output for February 2021. Data up to November 2021 is actual EIA production data.
If the real production number for January were to be used, conventional oil output would be lower than the February output shown. However a note of caution is in order. This chart is derived by subtracting two large numbers which are subject to revision, particularly the latest months, which greatly affects the output after November.
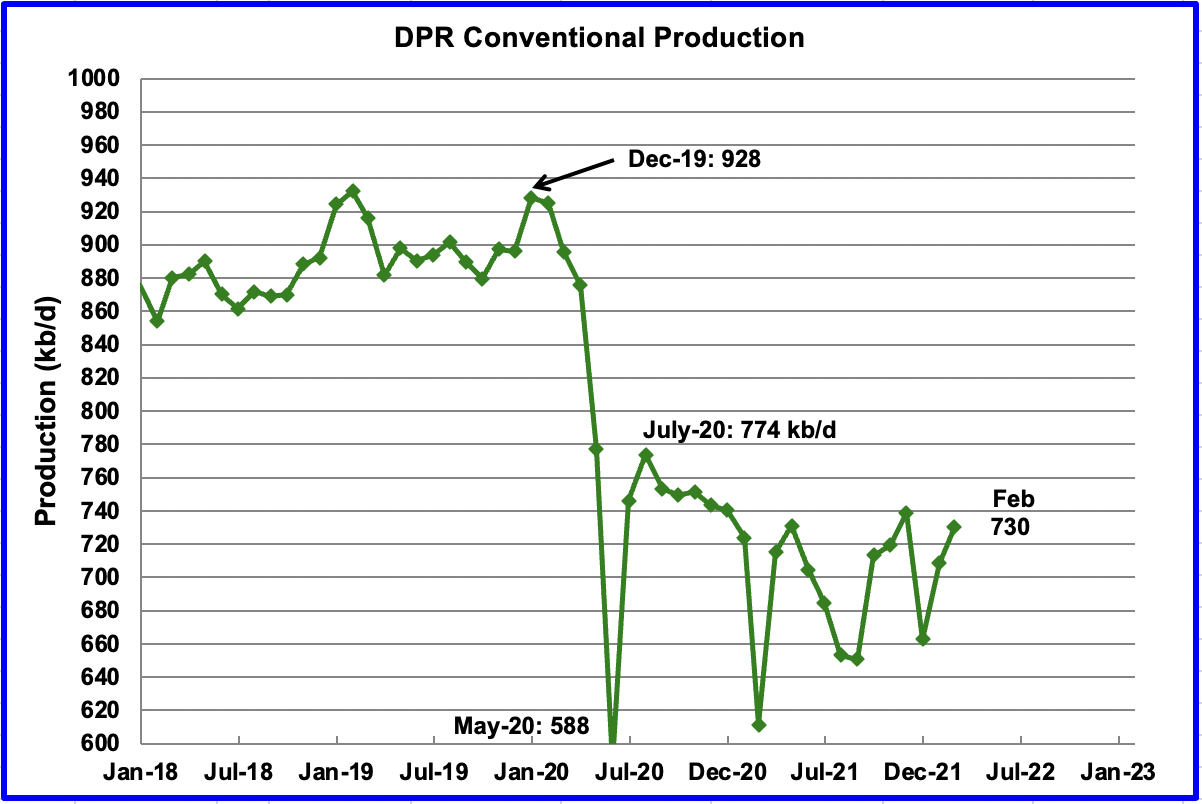
This chart shows conventional oil output in the DPR fields. It was obtained by subtracting the LTO basin data from the DPR data. The chart shows that the large decline of conventional oil in the US, shown in the previous chart, is not associated with the DPR basins.
As noted above, this chart is derived by subtracting two large numbers which are subject to revision.
Editor’s Note: The summary bullets for this article were chosen by Seeking Alpha editors.
Be the first to comment