

da-kuk/E+ via Getty Images
This article was first released to Systematic Income subscribers and free trials on Mar. 22
In this article, we highlight the BDC Trinity Capital (NASDAQ:TRIN) which we have recently added to our BDC Tool, making it the 29th company in our coverage. The company delivered the strongest Q4 total NAV return in the sector to add to its already impressive track record. It also raised its dividend to keep up with its growing net income, which we expect to grow further. The company’s valuation is around 8% above the sector average as of this writing. We would consider rotating into TRIN in our High Income Portfolio closer to a 105% valuation – a level it has dipped below a few times over the past couple of months.
A Quick Overview
TRIN is an internally-managed BDC focused on secured loans (~70%) and, somewhat unusually, equipment financing (23%) to growth-stage companies within the venture capital umbrella. The company has 41 employees and runs a $873m investment portfolio which puts it around the middle of the pack in the sector. The company’s equity / warrant allocation is on the high side relative to the sector at 15.7% (although this was a more modest 7.2% at cost).
The company has continued to pivot to a more floating-rate asset profile – something which should allow its income to move higher in line with rising short-term rates.
TRIN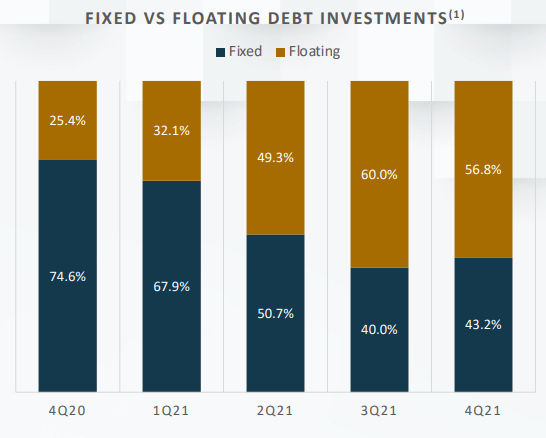
In terms of sector exposure the portfolio skews to manufacturing, information and science / tech sectors.
TRIN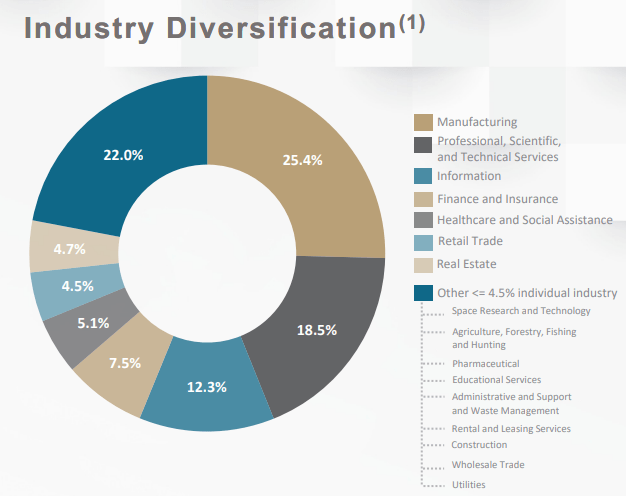
Q4 Update
Last week TRIN announced an 11% hike in its dividend to $0.40 from $0.36 – a fifth quarterly increase in a row. It also declared a $0.15 supplemental dividend and expects to declare one for each of the remaining 3 quarters this year. This makes the company’s dividend yield 11.8% – one of the very highest in the sector and 2.5% above the sector average.
The hike in the dividend is not much of a surprise. As the chart below shows the company has had a fairly conservative dividend stance with NII exceeding its dividend each of the past 7 quarters, often by a substantial margin.
Systematic Income BDC Tool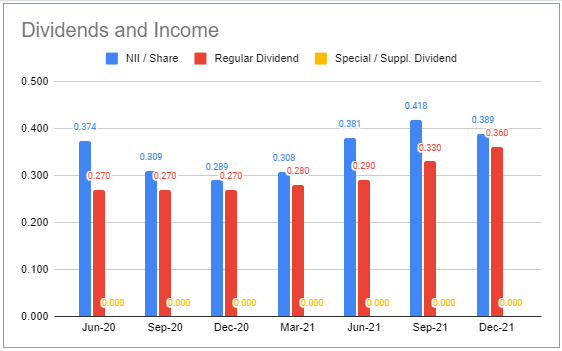
Total investment income increased by 8.3%, in part due to a near doubling of fee income (green bars below). While we expect total investment income to keep increasing, we don’t expect fee income to be as strong in Q1 given seasonality factors and wider discount margins / lower equity risk sentiment leading to fewer prepayments and exits.
Systematic Income BDC Tool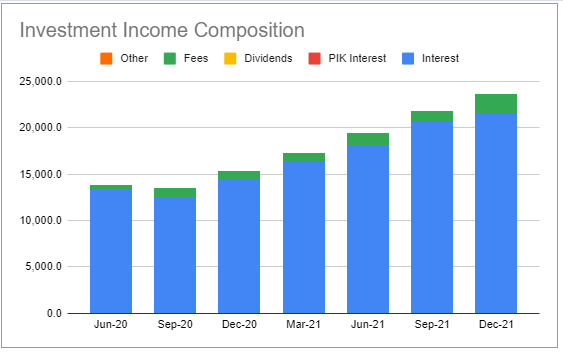
TRIN delivered the strongest quarterly total NAV return in the sector (in our coverage) with a 14% gain primarily due to unrealized appreciation as well as retained earnings causing the NAV to rise by nearly 12%. he company has been closing the gap between its NII and dividends, particularly with the announcement of new supplemental dividends. These will act as a drag on the NAV (but, not on total NAV returns, of course) so we don’t expect similar stellar NAV gains going forward, all else equal.
Systematic Income BDC Tool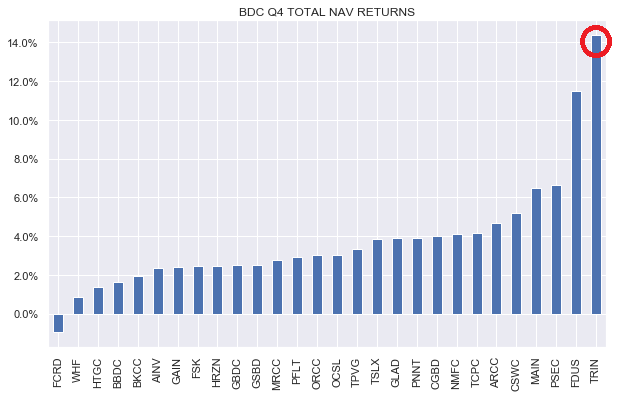
TRIN has outperformed the sector each of the three quarters in its short history as a publicly traded BDC. A strong venture capital environment and positive risk sentiment in the equity market has supported the company’s NAV which is overweight equity / warrants relative to the broader sector with the fourth highest equity allocation in the sector. Four of the company’s holdings in Q4 left the portfolio via SPAC mergers and one via a traditional IPO.
Systematic Income BDC Tool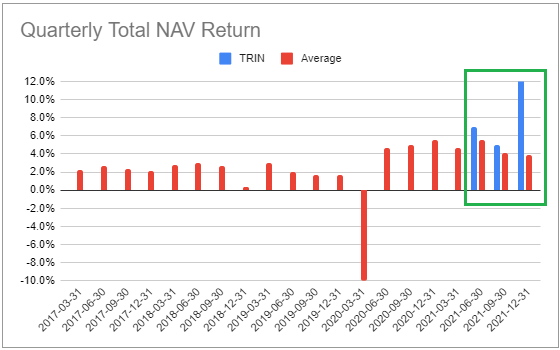
The company issued $75m of 4.25% 2026 notes in Q4 which lowered its weighted-average cost of debt by around 0.6% to 5.11%. Despite this, TRIN boasts one of the highest debt interest cost levels – about 1.7% above the sector average. This likely has to do with its higher equity allocation and lack of a publicly traded track record.
Systematic Income BDC Tool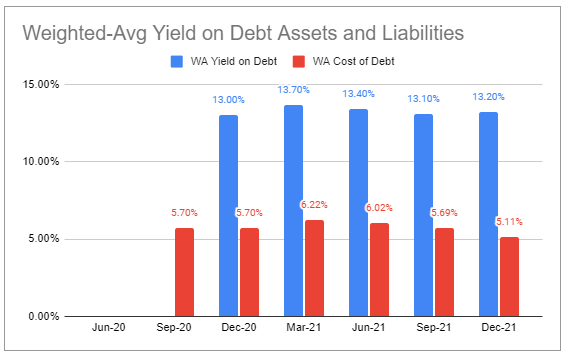
This high level of debt interest cost means the company’s OpEx is fairly elevated – about 1% above the sector average. However, even if we exclude debt interest its OpEx is still above the sector average. This speaks to the fact that investors shouldn’t automatically assume that an internally-managed BDC necessarily has a lower fee structure.
Systematic Income BDC Tool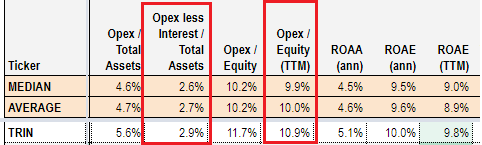
In Q1 TRIN booked the sale of Lucid Motors (LCID) and Matterport (MTTR) for $59.8m. As of Q4, these positions were marked at a combined $78.9m i.e. a drag of $19.1m due to the drop in the value of the stocks in January relative to their end-of-year levels. This works out to around $0.70 per share or about 4.3% of the NAV. In other words, all else equal, the sale pulls the NAV lower towards $15.7 from $16.4 as of Q4. This suggests that as of this writing the valuation is closer to 119% rather than 114%.
Net new investments came in very strong in the last quarter and have been consistently positive, supporting income growth.
Systematic Income BDC Tool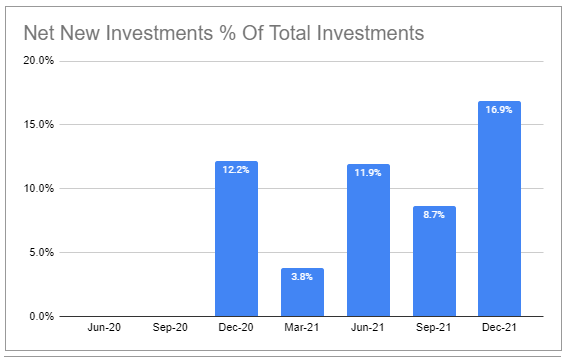
Portfolio holdings in the worst two grades (called Watch / Default) have trended lower over the past few quarters.
Systematic Income BDC Tool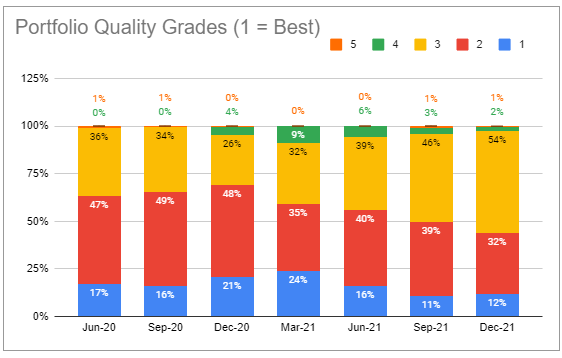
It appears that the company has been preparing for a lift-off in short-term rates as its floating-rate asset allocation has been growing and its floating-rate liability profile has been shrinking. In short, TRIN is well-positioned to take advantage of higher short-term rates. It expects to receive a boost of about 7% in NII for a 1% rise in Libor (Libor has already risen by more than half this amount from the December filing) which is about 5% more than the sector average and about 13% for a rise of 2% in Libor – in line with the sector average.
Systematic Income BDC Tool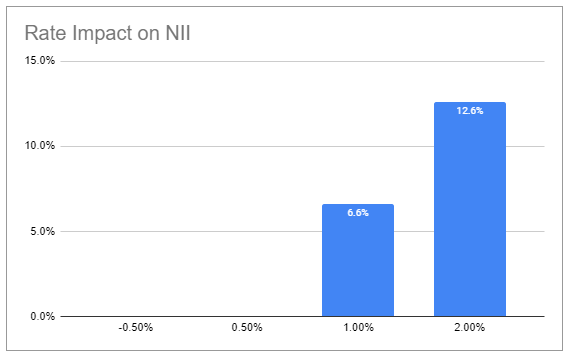
Leverage has continued to increase over the last few quarters and is expected to contribute to additional investment income in the coming quarters.
Systematic Income BDC Tool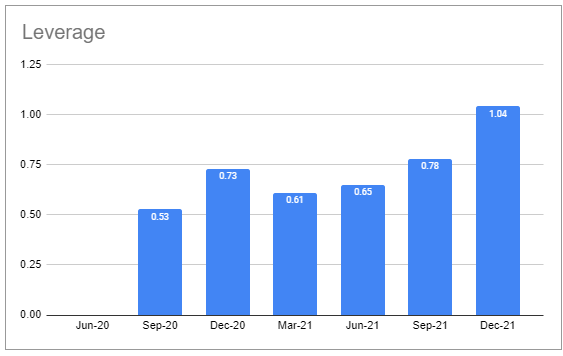
Non-accruals on fair-value have risen slightly but remain at subdued levels and about half the sector average (a bit below the sector median).
Systematic Income BDC Tool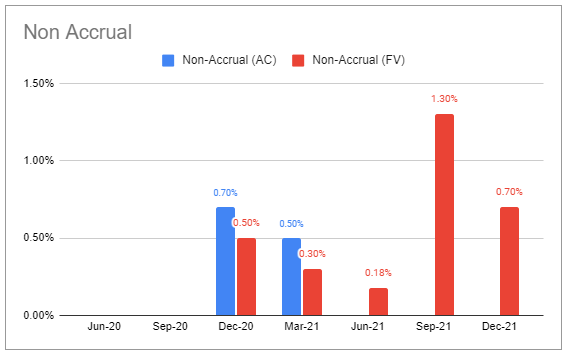
A Look At Valuation
There are two schools of thought about initiating BDC positions. One is that valuation is hugely important because it is the key driver of investor return – the better the valuation on entry the better is the resulting investor return.
This approach has two corollaries. First, is that valuations tend to bounce around all the time so chasing a stock makes very little sense. The second is that sometimes the valuation is simply too high to award a decent margin of safety and/or an attractive prospective return.
And although TRIN does not boast a long history as a publicly-traded stock, its limited history does suggest that its valuation has indeed bounced around quite a bit.
Systematic Income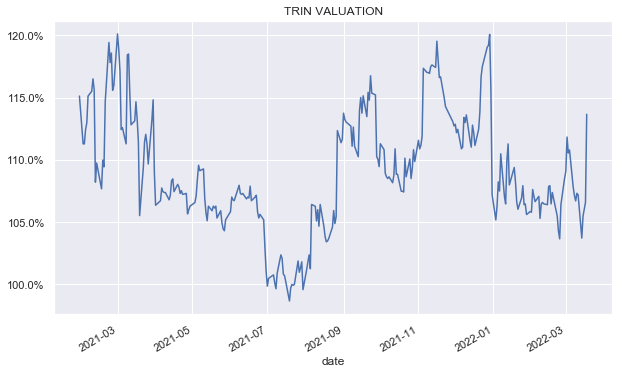
Despite its very strong track record, its valuation has even dipped below the sector average level – an attractive level, particularly close to 100%.
Systematic Income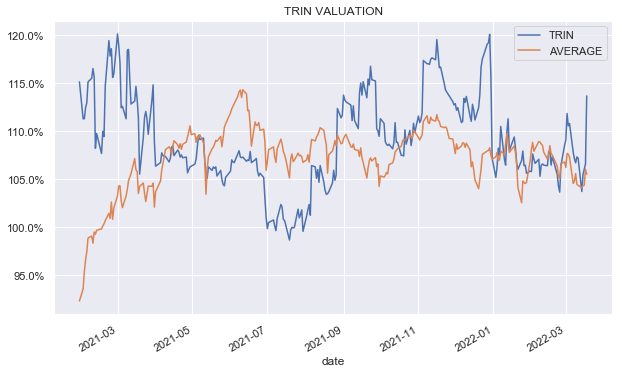
The second approach to valuations is that if you find a strong performer it’s important to establish a position because after a few quarters or years the then valuation on cost basis is likely to be just fine. For instance, paying a seemingly high valuation of 115% (i.e. a price of $15.74 = 115% x $13.69 Q1-21 NAV) at the end of Q1 last year would mean a current valuation on cost basis of 96% (i.e. $15.74 / latest NAV of $16.40) – an incredibly attractive level for a strong sector outperformer. Obviously, no one knew the company’s NAV would rise by nearly 20% to $16.40 but strong historic BDC performers do tend to see steady gains in the NAV due to cumulative net realized and unrealized gains.
In our view, there is some truth to both positions. There is an old markets adage that specifically highlights that trying to squeeze out a slightly better entry point can make an investor lose out on attractive returns. At the same time, totally ignoring valuations is not a sensible investment strategy either.
In terms of a fair-value valuation relative to the broader sector – there is not a long track record which would give us strong confidence in pinpointing a valuation target. However, a look at the company’s 2 year return profile suggests that its valuation sweet spot is probably around 110-125% in the current environment. This doesn’t mean that investors have to buy at this level since there are, arguably, similarly strong BDCs that are trading below their fair-value valuation. That said, an opportunistic entry position at the lower-end of the range would be attractive. In our own High Income portfolio we would strongly consider an allocation closer to a 105% valuation.
Takeaway
Overall, TRIN is well-positioned to grow its income over the coming quarters. Its debt interest cost has continued to decrease while its yield on assets has remained steady. Its net new investments and leverage have been growing. Portfolio quality has improved while non-accruals have remained relatively low. Finally, the company has been increasing its floating-rate asset profile and decreasing its floating-rate liabilities, something which has increased the beta of its income to rising short-term rates.
Recent weakness in equity markets and the markdown on a number of exits does highlight the company’s heightened vulnerability to equity valuations, however, this is unlikely to cause a significant book value drag unless equity prices fall much more from here.
TRIN remains an attractive higher-beta allocation which patient investors may be able to catch at a more attractive valuation than where it is trading today. At the moment, we like the Fidus Investment (FDUS) as a higher-equity allocation BDC in our portfolios which has put up similarly strong total NAV returns as TRIN but trades at a significantly cheaper valuation. We would consider switching to or adding TRIN outright on a valuation move closer to 105%.
Be the first to comment