

By Jason Giordano
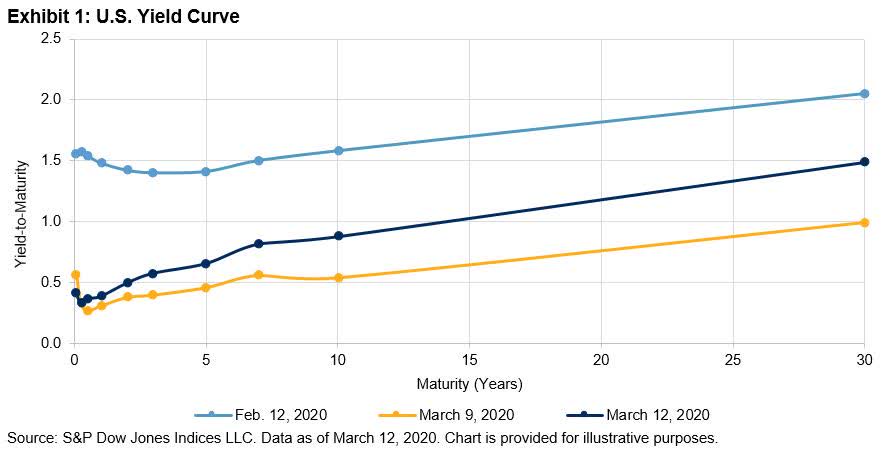
As global financial markets grapple with assessing the economic impact of COVID-19, U.S. Treasury yields reached unprecedented levels. On March 9, 2020, the yield on the 10-year U.S. Treasury Bond fell to an intra-day low of 0.32%. This was a drop of more than 125 bps from just three weeks earlier. As market participants fled risk assets, the flight to quality drove the entire U.S. yield curve below 1.00%. The 30-year U.S. Treasury Bond fell to an intra-day low of 0.82% before ending the day at 0.99% (for context, prior to February 2020, the record-low yield in the 30-year Treasury Bond was 1.90% in August 2019). The precipitous fall in yields was staggering, as shown in Exhibit 1.
Perhaps more stunning than the “zero handle” on the 30-year U.S. Treasury Bond was the magnitude and velocity with which the long end of the curve moved. Exhibit 2 shows the rolling weekly volatility of the S&P U.S. Treasury Bond Current 30-Year Index since 2005. As shown, the recent volatility in 30-year U.S. Treasuries far exceeds any previous period, including the Global Financial Crisis, European debt crisis, “Taper Tantrum” and Brexit referendum.

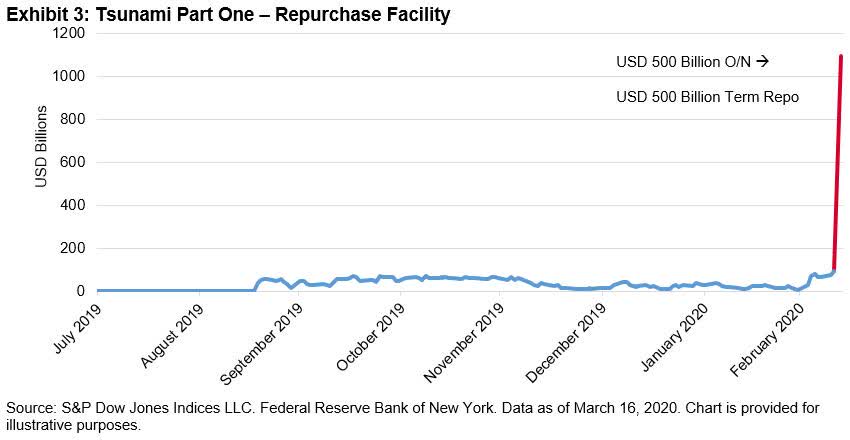
This historic fall and subsequent rise in yields followed the emergency 50 bps cut the U.S. Federal Reserve implemented on March 3, 2020 -only the third occasion in which the Fed cut rates intra-meeting. This action, while clearly necessary, did little to assuage liquidity needs in the market, as Fed Funds futures took less than a week to price in an additional 100 bps cut at the Fed’s March 18 meeting. On March 12, the Fed used its standing repurchase facility to inject an unprecedented amount of liquidity to help meet funding gaps in the short-term market. Exhibit 3 shows the relative size of the increase in offered liquidity in an attempt to help stabilize funding needs.
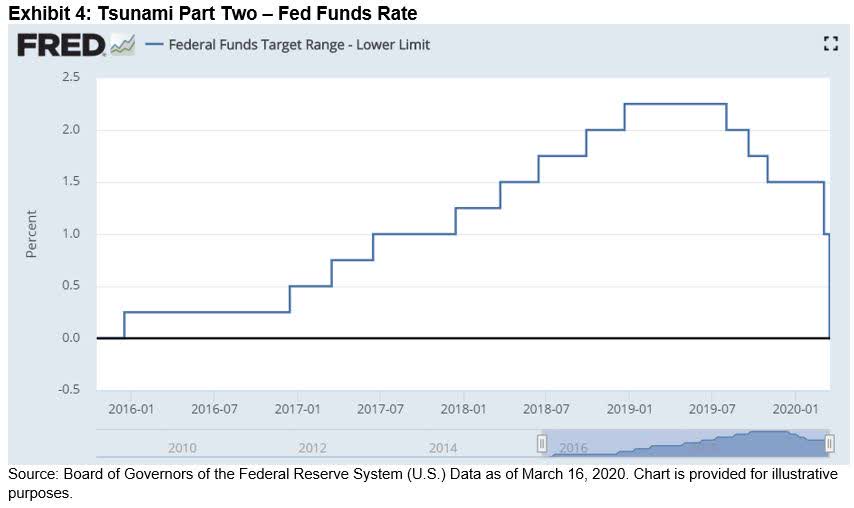
Less than 72 hours after increasing the repurchase facility to over USD 1 trillion, the FOMC announced yet another emergency intra-meeting rate cut. On Sunday, March 15, the Fed cut rates to a range of 0.00-0.25%. Exhibit 4 shows the Fed Funds rates since 2015. The first interest rate hike following the Global Financial Crisis occurred on Dec. 15, 2015. It took over four years to get the target range above 2% and less than nine months to go all the way back down to zero.
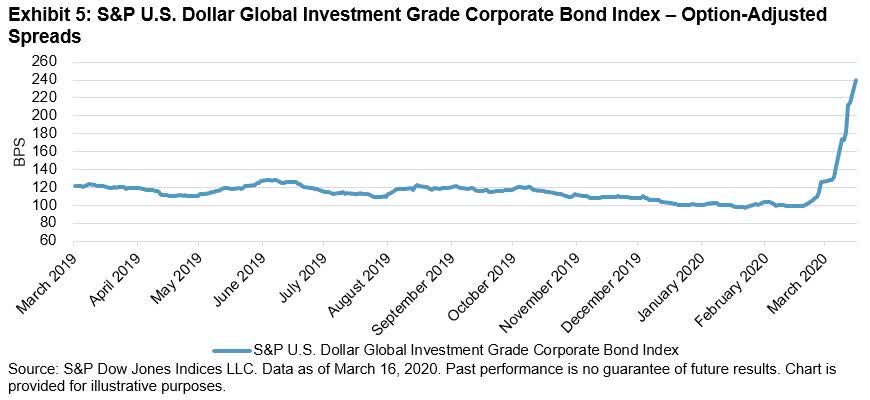
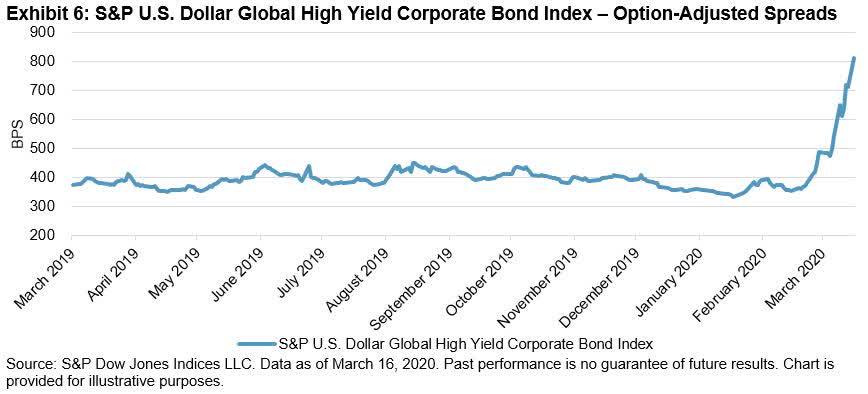
In a follow-up blog, we will dive deeper into the underlying workings and function of the short-term funding markets. In liquidity events, cracks always show up first in the funding markets and typically ripple through the entire financial system. Exhibits 5 and 6 show the recent spike in option-adjusted spreads (i.e., perceived risk) in the S&P U.S. Dollar Global Investment Grade Corporate Bond Index and the S&P U.S. Dollar Global High Yield Corporate Bond Index.
Disclosure: Copyright © 2019 S&P Dow Jones Indices LLC, a division of S&P Global. All rights reserved. This material is reproduced with the prior written consent of S&P DJI. For more information on S&P DJI please visit www.spdji.com. For full terms of use and disclosures please visit www.spdji.com/terms-of-use.
Editor’s Note: The summary bullets for this article were chosen by Seeking Alpha editors.
Be the first to comment