

SCStock/iStock Editorial via Getty Images
Top Piotroski-Graham Long Term Value Stocks: July 2022 Semi-Annual Selections
These selections continue as ongoing tests and active portfolios for readers looking for value stocks using one of the best fundamental value models in peer-reviewed financial literature with further customized enhancements.
These top sample selections for July 2022 comprise the 23rd portfolio since 2017 formed to test the one-year buy/hold portfolios of the Joseph Piotroski Value algorithm that remains one of the best-performing value-based selection models in peer-reviewed financial research. The portfolios are now released 2 times per year with the last 2 articles:
- Top Piotroski-Graham Long Term Value Stocks: January 2022 Semi-Annual Selections
- Top Piotroski-Graham Long-Term Value Stocks: July 2021 Semi-Annual Selections
The benefits to financial statement analysis are concentrated in small and medium-sized firms, companies with low share turnover, and firms with no analyst following, yet this superior performance is not dependent on purchasing firms with low share prices. A positive relationship between the sign of the initial historical information and both future firm performance and subsequent quarterly earnings announcement reactions suggests that the market initially underreacts to the historical information. ~ Joseph Piotroski
Retests of the Piotroski model continue to outperform all other top value algorithm models as recently shown in peer-reviewed financial literature according to Amor-Tapia, B. & Tascón, M.T. (2016). The selections offered here have been improved to include the Benjamin Graham enhancements and additional parameters described in the methods section below.
I am frequently asked, “How long are these selections good to hold?” Both Benjamin Graham and Joseph Piotroski developed their models for 2-year buy/hold periods. Numerous scholarly research studies, some referenced at the end of the article, have tested the algorithm results over 2-year periods with these models outperforming other peer reviewed value selection models. I track all portfolio results for more than 2 years and continue to see strong long term results for more than 3 years.
Prior Returns
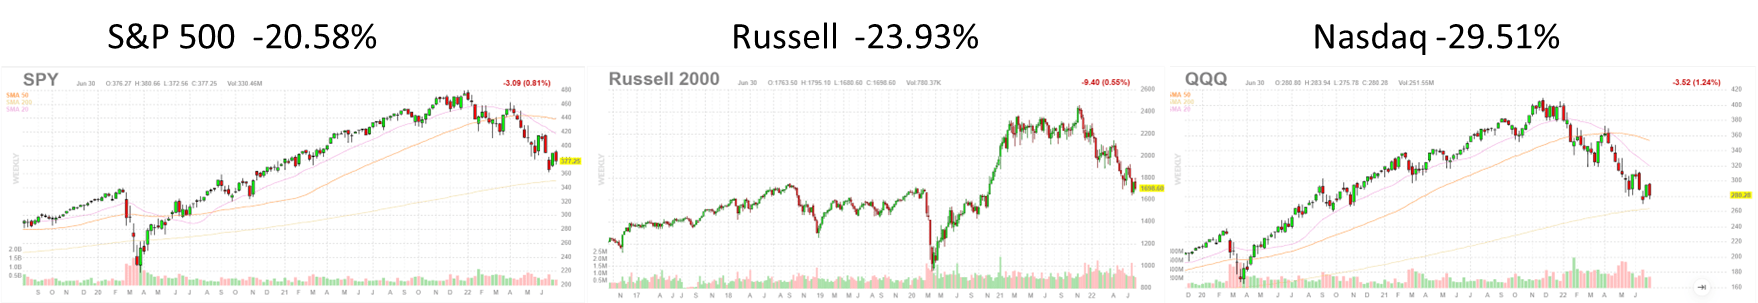
2022 has delivered the worst half-year start to the stock market since 1970 and the worst start of the year returns for the Nasdaq in history. These terrible market results going back 52 years and longer have pared much of the strong initial gains in the prior portfolios and the best approach is to follow the Momentum Gauges® to avoid record downturns like members have.
The long term buy/hold Piotroski-Graham portfolios are up +1.09% YTD for 2022 with the 2-year average return greatly reduced to +26.4%. These returns do not include any of the high dividend returns typical of many large value stocks and the total returns for these portfolios will be higher than shown below.
VMBreakouts.com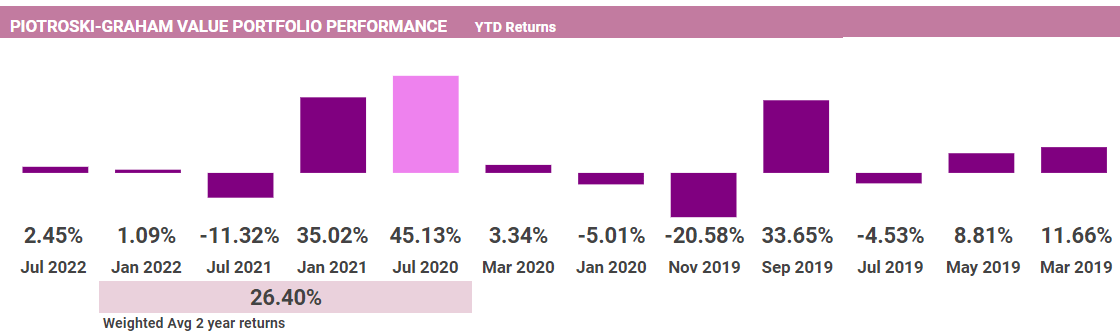
Piotroski-Graham Enhanced Portfolio Returns From Formation
Members have smartly asked me to delay selections until the Momentum Gauges® turn positive again for the best results. Regrettably, I am not trying to time selections just for the best returns, but focused on consistent periodic testing of these strong algorithms through the worst market conditions. I am certainly planning to give members updated selections again when the Momentum Gauges® turn strongly positive again and those picks may include many of these long term value stocks.
July 2022: Piotroski/Graham Value Enhanced Selections
These new selections have the highest Piotroski F-Scores of all the stocks screened across the US markets with a share price above $3 and average daily volume over 100k shares. In addition, the Benjamin Graham enhancements have been applied on the basis that these characteristics are well documented to deliver excess annual market returns.
These stocks meet the qualifying price/Graham number values less than one and even better value score less than 0.50. According to historical long term results, these stocks have very high investment value from oversold levels that should deliver strong long term gains. Additionally, none of these stocks had any red-flags from the Beneish M-Score forensic algorithm that checks for earnings manipulation or financial irregularities:
UncleStock.com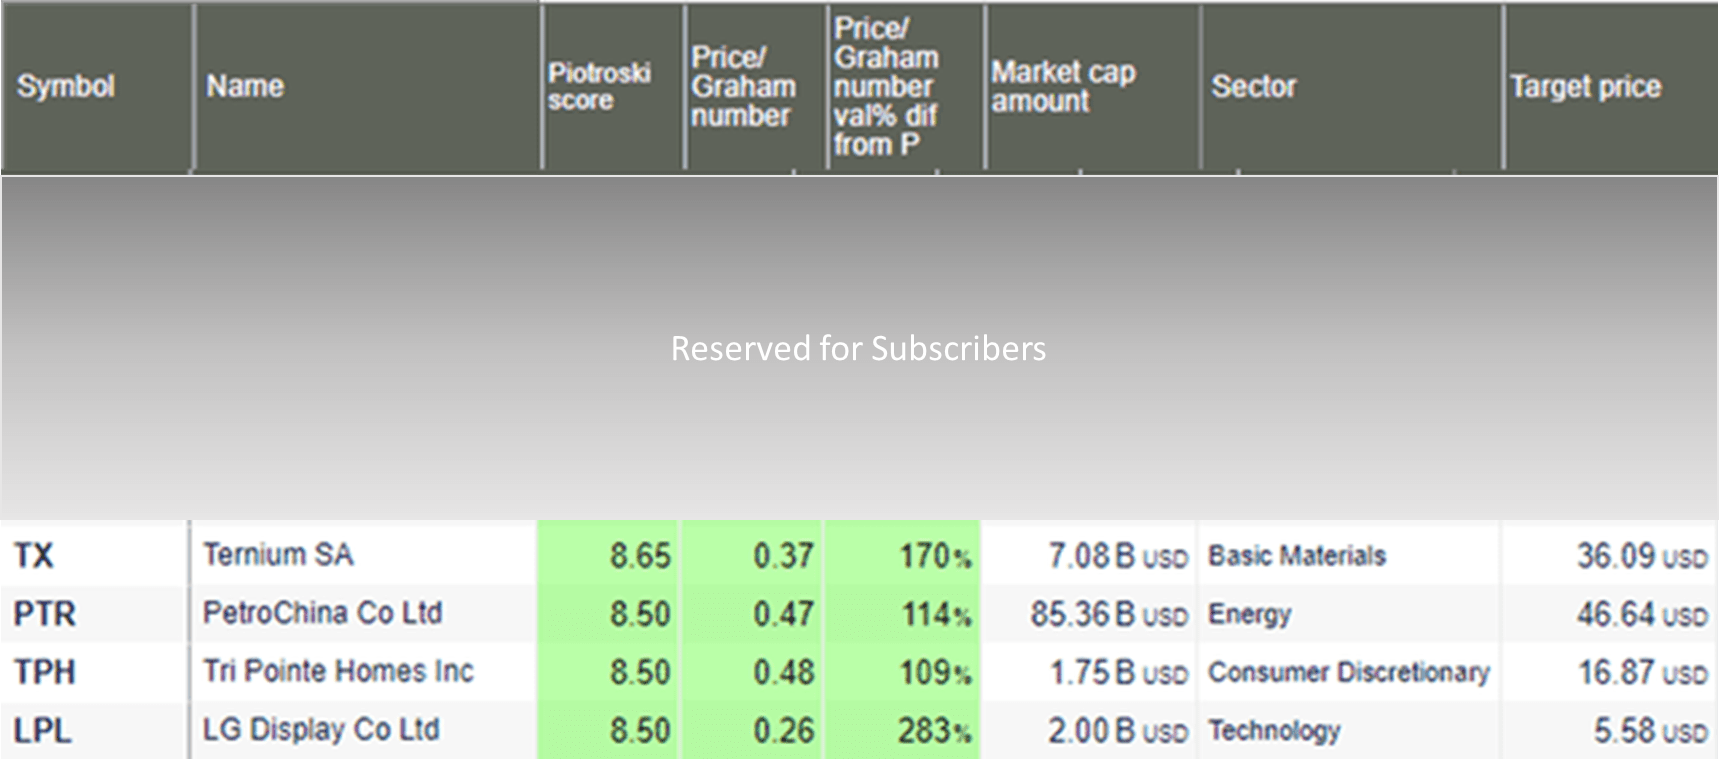
Overall Scores Independent of the Piotroski-Graham Algorithms
An independent ranking of these firms using other value and growth scores is shown below that may provide additional insight into the risk of these firms.
StockRover.com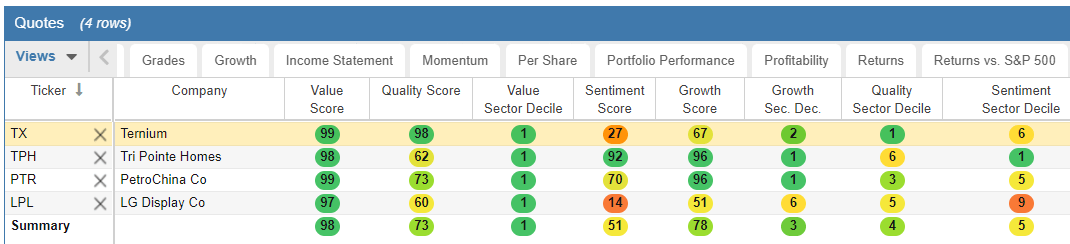
The full 10 stock portfolio belongs to the following sectors: 5 Basic Materials, 1 Energy, 1 Consumer Cyclical, 1 Industrials, 1 Real Estate, and 1 Technology sector stock. This suggests that the Basic Materials sector continues with strong long term growth potential into 2022 from a sampling of highly undervalued stocks from more than 7,500+ stocks.
Ternium S.A. (TX)
FinViz.com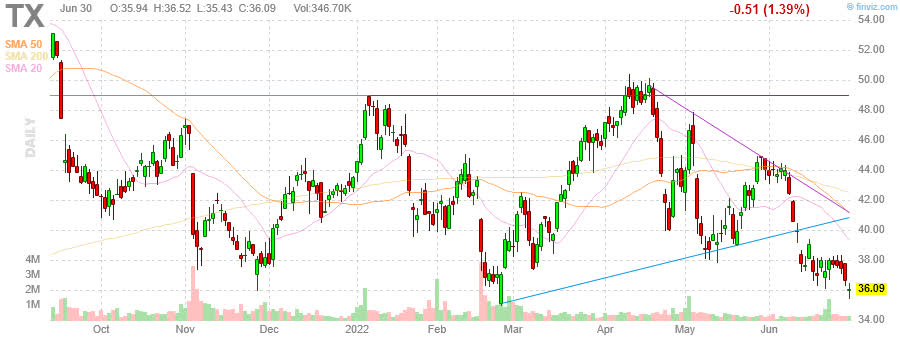
StockRover.com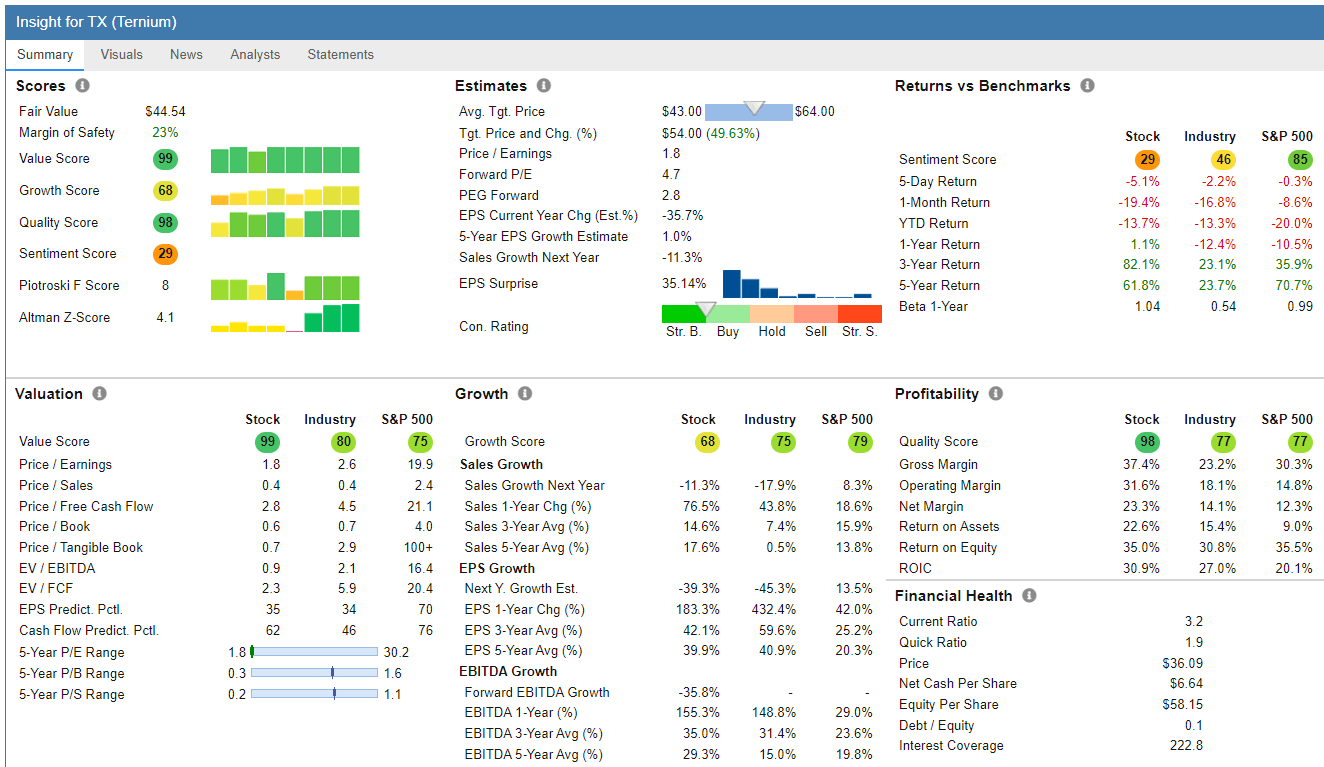
Tri Pointe Homes, Inc. (TPH)
FinViz.com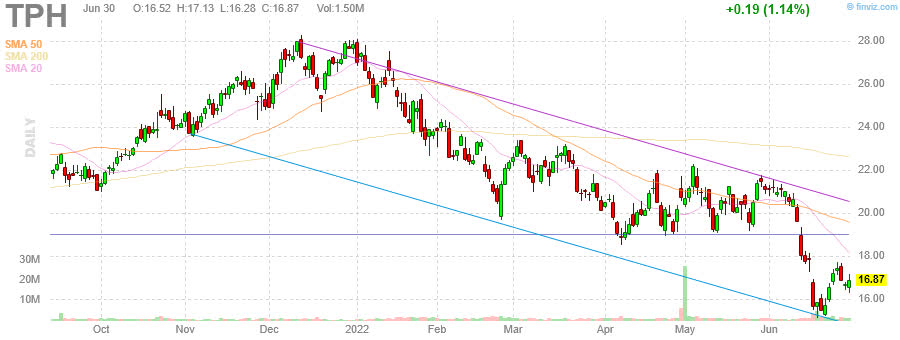
StockRover.com
PetroChina Company LTD (PTR)
FinViz.com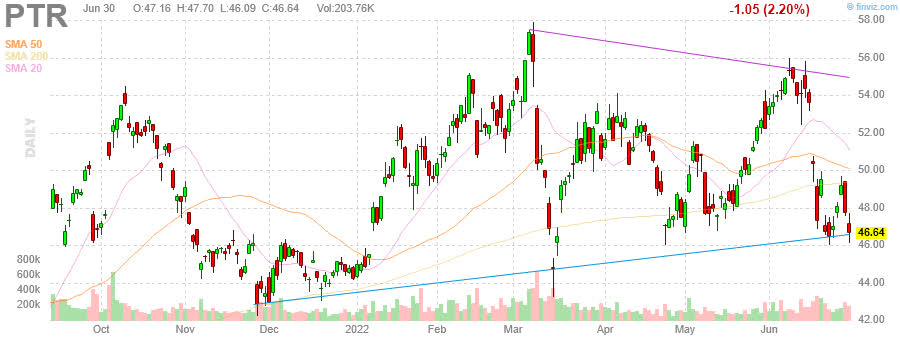
StockRover.com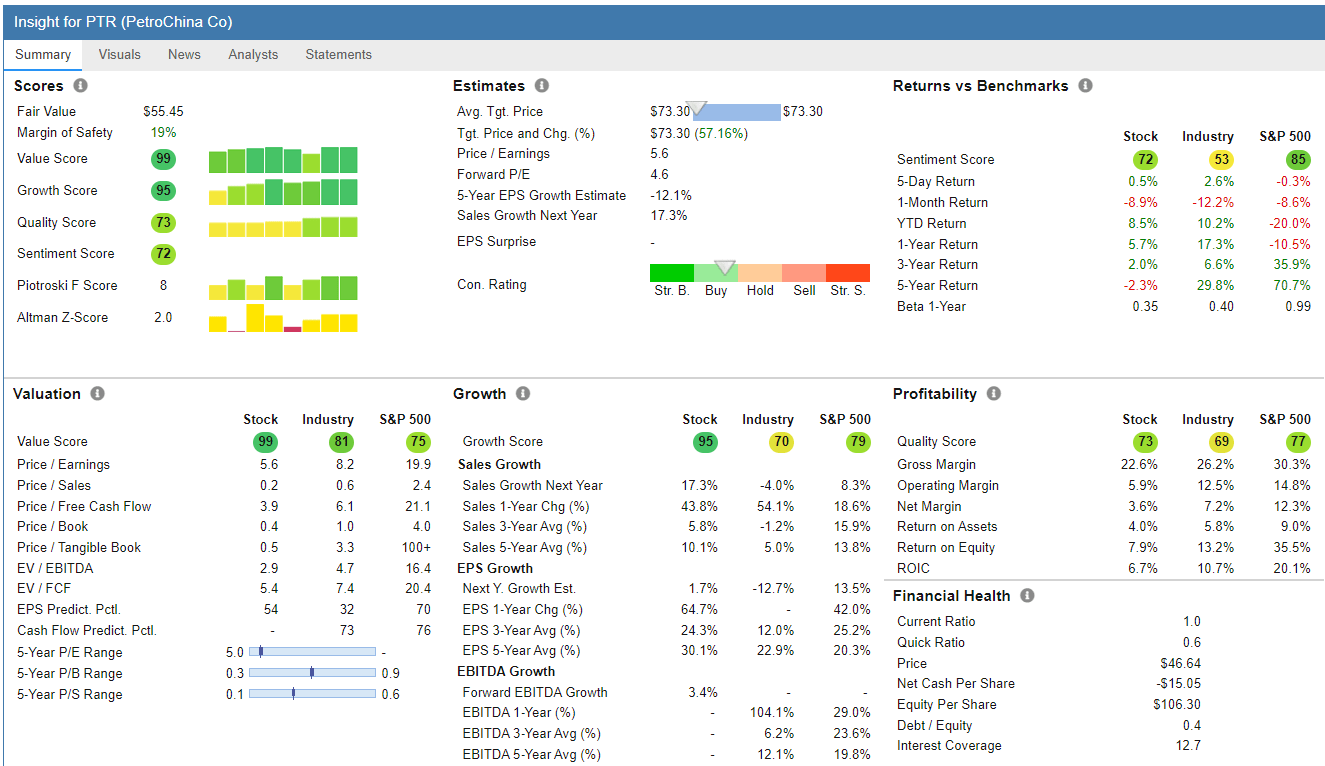
LG Display Co. LTD (LPL)
FinViz.com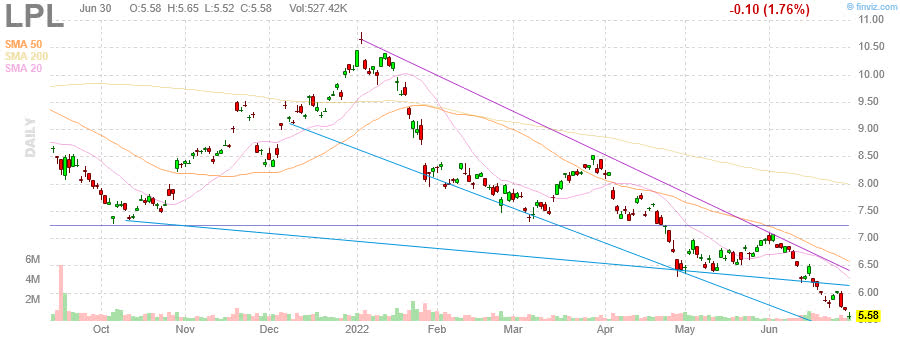
StockRover.com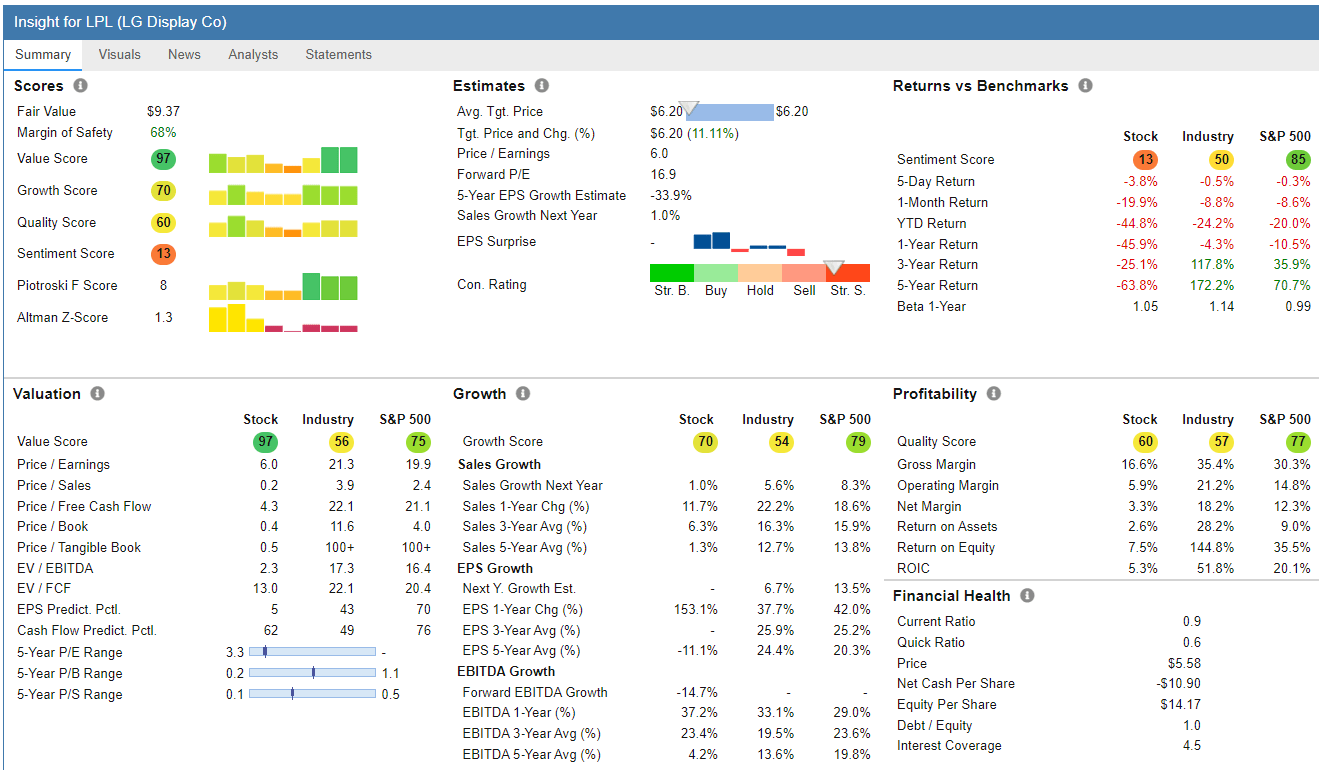
Review of January 2022: Piotroski/Graham Value Enhanced Selections
This review provides an updated screen on valuations of the ten stocks from the prior January 2022 Piotroski-Graham selections with today’s values. You can use this information to rebalance and restructure your prior long term buy/hold value portfolios.
Uncle Stock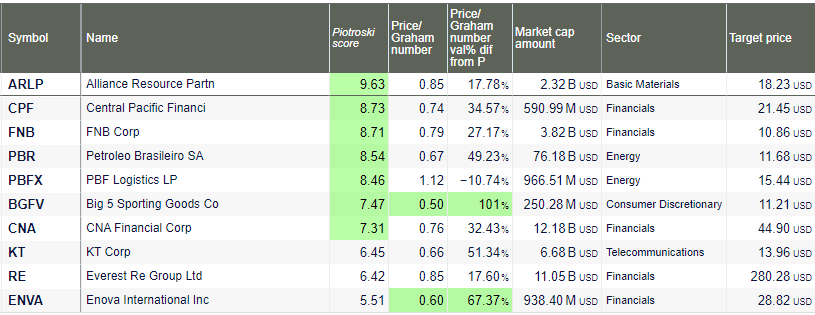
January 2022 top mid-year returns to date
No dividend returns included.
| Symbol | Company | Current Price | Start Price | Return from Selection |
| (ARLP) | Alliance Resource Partners, L.P. | 18.73 | 12.45 | 50.44% |
| (PBFX) | PBF Logistics LP | 15.59 | 11.28 | 38.21% |
| (KT) | KT Corporation | 14.13 | 12.59 | 12.23% |
| (PBR) | Petroleo Brasileiro S.A. – Petrobras | 11.76 | 10.99 | 7.01% |
The higher ranking Piotroski scored stocks have been consistently outperforming the lower ranked stocks on average YTD.
Introduction to Piotroski F-Score Methodology
This article continues the series of testing the best value investment research over a one-year time horizon for well-documented and substantial value-investing returns. This study is testing the Piotroski F-score model to see how many of the different value portfolios formed each month can outperform the market over a year-long period.
These Piotroski value selections are designed as a more stable, long-term investment approach to identify highly oversold stocks, in contrast to the Weekly Breakout Forecast based on highly volatile, short-term momentum stocks. The value selection formulas have been well-documented in the financial literature over the past 17 years to consistently outperform benchmark indexes.
- The Piotroski stock selections above build on the findings from the Amor-Tapia & Tascon (2016) research that evaluates top selection models in more detail in the initial August report that found the Piotroski model to be one of the best models tested for value investment selections.
- The American Association of Individual Investors also documents their own multi-year test results of the Piotroski F-score as one of the best-performing models with 17-year annualized total returns of 15.7%.
- These Enhanced Piotroski portfolios using Graham parameters and my additional liquidity price/volume limits consistently outperform the AAII Benchmark Piotroski portfolios with -5.0% in 2022, +20.3% in 2021, +0.3% in 2020, -19.1% in 2019, and -36.1% in 2018.
The values and methodologies from Joseph Piotroski and Benjamin Graham were devised for long-term value approaches that differ significantly from growth or momentum strategies. Like many models, they can cycle in/out of favor as economic conditions and markets change. The benefit of the inclusion of the different types of models that I offer is to identify when these larger cycles begin to shift and readers can reap significant gains from changing models. Additionally, there has been no other value strategy yet tested in the financial literature that has beaten the Piotroski approach in all the peer-reviewed studies over competitive 1-year tests.
Cycles can shift dramatically and this is another important reason for following the Momentum Gauges® closely:
Background on Value Scoring Systems
Calculating scores and assigning values to stocks based on fundamental data remain one of the most popular methods for value stock investing. Most of us are familiar with such scoring systems as the Value Line Rank (started in 1965), the CANSLIM composite ranking system (started in 1988), the Zacks Rank (started in 1982, first made public in 1992), and many other popular systems that have given us good results over the years. To this day, it is not uncommon to find substantial overlap among the best stocks identified by different value ranking methodologies. Most medium- to long-term investors are well served by taking these models into consideration.
Less well-known are the academic composite value models based on fundamentals that continue to be rigorously tested in peer-reviewed financial literature. Some of these published models have their measurement scoring integrated into publicly available stock screens from various stock analysis websites. One of the best academic models retested recently by Amor-Tapia and Tascon (2016) is the Piotroski score model created by Joseph Piotroski in 2000:
The Piotroski (2000) FSCORE: The Score consists of aggregating nine individual binary signals derived from accounting variables related to profitability. The most favorable value score is 9 and the least favorable is zero.
Amor-Tapia & Tascon, 2016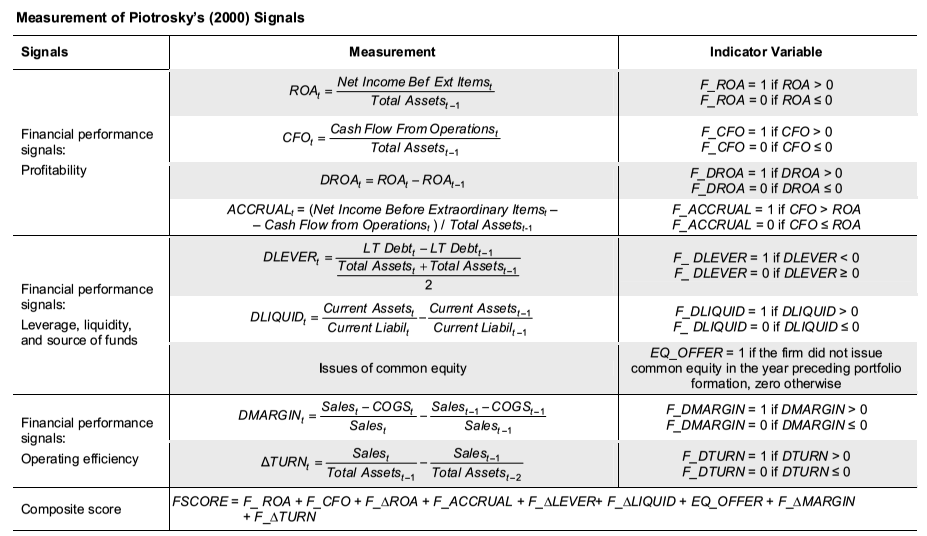
The Graham Number: Benjamin Graham, often called “the Father of Value Investing,” first leveraged key financial ratios to identify undervalued companies with strong growth potential. The Graham Number value score results from a formula developed by Benjamin Graham that is based on his assessment that good value stocks should have a P/E ratio below 15 and a P/B ratio below 1.5:
Benjamin Graham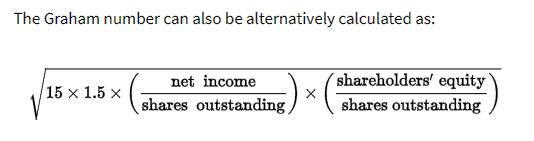
This Graham Number value equals the square root of 22.5 x EPS x P/B. Because it leaves out many other important characteristics it is better applied as an enhancement to the highly successful Piotroski F-Score value selection model.
Conclusion
The Piotroski F-Score model has been well-documented in the financial literature and by practitioners to generate significant excess returns on an annual basis. In addition the enhanced value model selections above also eliminate financial outliers and low-priced stocks that may jeopardize the best performance results possible. This value model remains one of the top selection models among dozens also tracked by the American Association of Individual Investors. The advantage of this model is described by Joseph Piotroski from his published research:
First, value stocks tend to be neglected. As a group, these companies are thinly followed by the analyst community and are plagued by low levels of investor interest. Given this lack of coverage, analyst forecasts and stock recommendations are unavailable for these firms.
Second, these firms have limited access to most “informal” information dissemination channels and their voluntary disclosures may not be viewed as credible given their poor recent performance. Therefore, financial statements represent the most reliable and most accessible source of information about these firms.
Third, high BM firms tend to be “financially distressed”; as a result, the valuation of these firms focuses on accounting fundamentals such as leverage, liquidity, profitability trends, and cash flow adequacy. These fundamental characteristics are most readily obtained from historical financial statements. ~ Joseph Piotroski
Since my testing began of this Enhanced Piotroski-Graham value model, it has consistently outperformed the benchmark AAII Piotroski selection models every year. Returns are greatly enhanced following the daily, weekly, or monthly Momentum Gauges. The monthly gauges for long term investing signals have been negative since November 2021 as shown below in the chart from the 2020 Covid correction until today.
app.VMBreakouts.com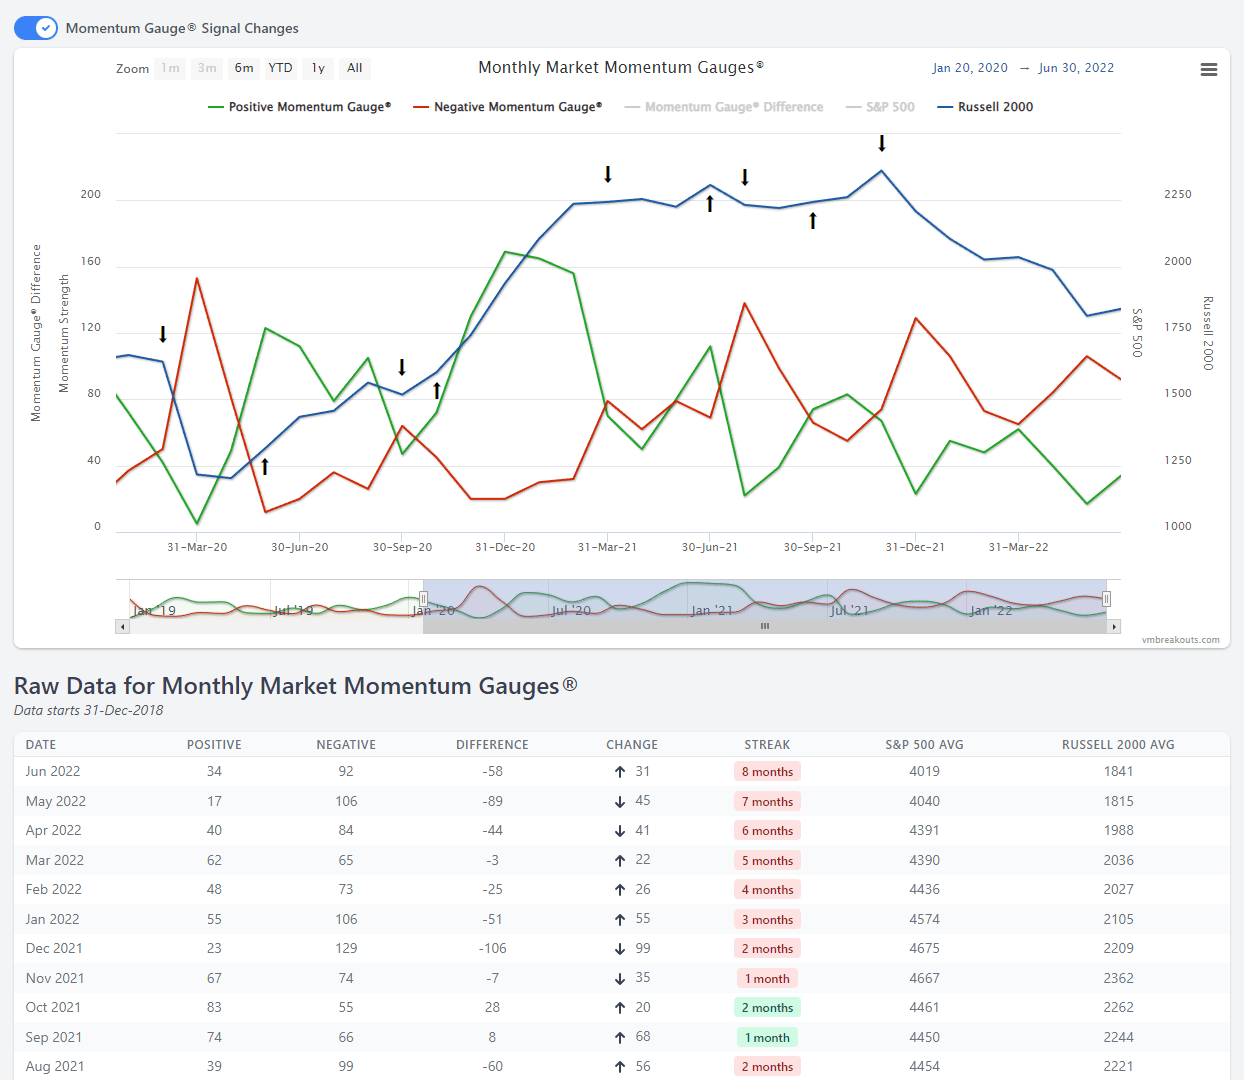
As we see more rotation into value stocks again, I trust this will be a profitable contribution to your investment objectives in 2022!
JD Henning, PhD, MBA, CFE, CAMS
References
Amor-Tapia, B. & Tascón, M.T. (2016). Separating winners from losers: Composite indicators based on fundamentals in the European context *. Finance a Uver,66(1), 70-94.
Piotroski, J. D. (2000). Value investing: The use of historical financial statement information to separate winners from losers. Journal of Accounting Research, 38, 1-41.
Graham, B. (1949). The Intelligent Investor: The Definitive Book on Value Investing
Editor’s Note: This article covers one or more microcap stocks. Please be aware of the risks associated with these stocks.
Be the first to comment