

M. Suhail/iStock Editorial via Getty Images
The TJX Companies, Inc. (NYSE:TJX) is the leader in off-price retail. Companies included within their umbrella include T.J. Maxx, Marshalls, and HomeGoods. Products at these stores are generally sold at prices lower than other retailers. In an environment where prices are rising everywhere, a bargain is not to be taken for granted.
As prices continue to rise, more consumers will choose discount retailers when they do decide to make discretionary purchases. This will favorably impact TJX in future periods. In addition, the company will benefit from the shopping habits of younger generations, who favor in-store experiences and bargain products.
Despite the favorable outlook, TJX has declined significantly over the past month. Shares are currently trading near their lows, and the company is underperforming against the broader S&P. The company currently has +$6.2B in cash on hand, and their dividend was recently increased by double-digits. In addition, they are effectively managing their working capital and consistently generating strong cash flows. Strong fundamentals such as these are at odds with the recent stock performance. For investors interested in adding a quality retailer to their portfolios, this bargain retailer is itself a bargain.
Business
TJX is the leading off-price apparel and home fashions retailer in the United States and worldwide. The company has over 4,500 stores that offer products at prices 20-60% below full-price retailers’ regular prices on comparable merchandise. TJX operates their business in four main segments: Marmaxx and HomeGoods, both of which are in the U.S, and TJX Canada and TJX International.
In calendar year 2021 (Fiscal 2022), TJX reported +$48.6B in net sales, as seen in the summary below from the annual 10-K filing. 60% of total sales were attributable to Marmaxx, which is the combination of T.J. Maxx and Marshalls. The next largest share of sales came from HomeGoods, who accounted for nearly 20% of the total.
Sales Disaggregation – Form 10-K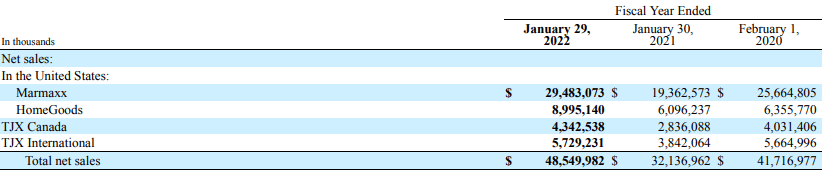
From a product category standpoint, nearly 50% of sales are from clothing and footwear. The next largest product category is home fashions at 38%. This segment is growing faster than apparel, and it’s possible that this segment will eventually reach 50% of sales at some point in the future.
Product Segment Breakout – Form 10-K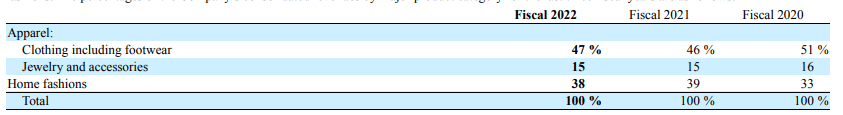
From a geographical perspective, 80% of net sales are derived in the United States. Remaining sales are attributable primarily to Canada and Europe, with Australia accounting for just 1%.
Geographical Sales Breakout – Form 10-K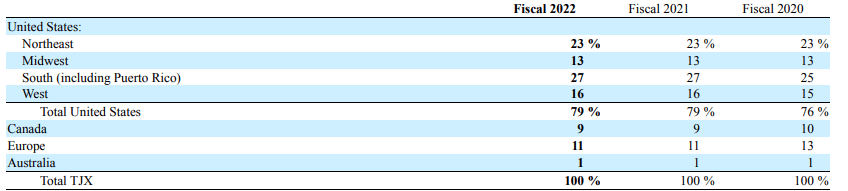
Competition
TJX operates in a highly competitive environment that affords the consumer with an excess of options. In addition to larger competitors, such as Target and Walmart, the company faces fierce competition from other specialty discount retailers, such as Ross Stores.
The summary below, available from the Seeking Alpha Peer Comparison Tool, provides a comparison of the market cap and size of related peers. TJX has the benefit of size and scale when compared to most other retailers. But Target is considerably larger, with a market cap nearing +$100B and more than 100K more employees.
Seeking Alpha Peer Comparison Tool – Market Cap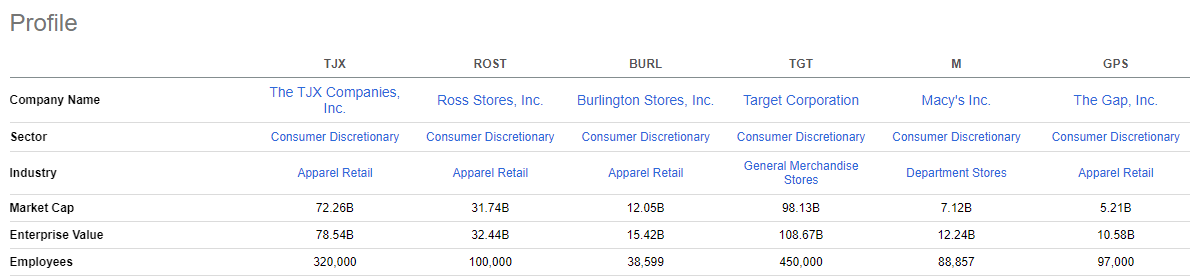
TJX is down 5% over the past month. This is comparable to most of their peers, but significantly worse than the broader S&P, which is up 5% for the month.
Seeking Alpha Peer Comparison Tool – Total Returns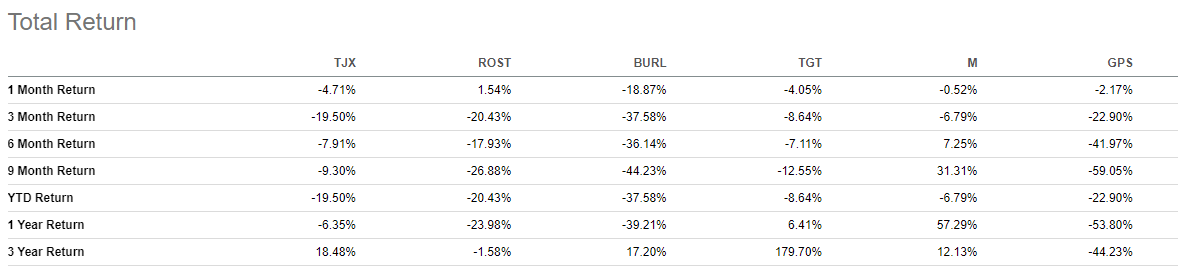
Over a ten-year horizon, TJX has consistently outperformed the broader market and most of their peers, including Target. The underperformance of late, therefore, appears overdone based solely on historical performance.
YCharts – Annualized Total Returns Comparison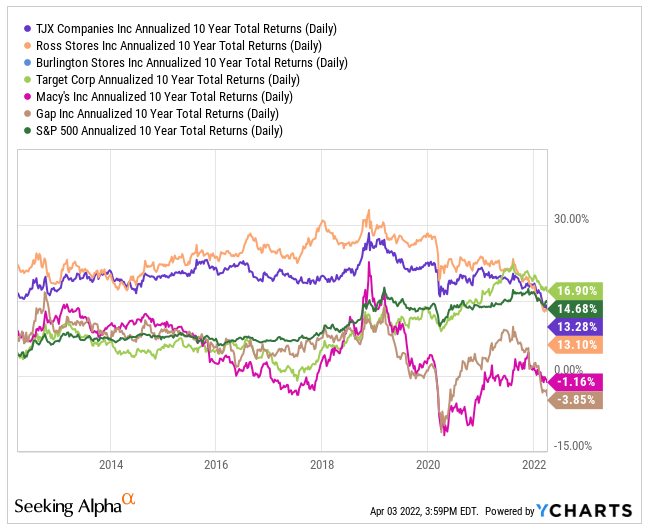
On various valuation metrics, however, TJX does appear overvalued compared to their peers. For example, their forward pricing multiple is about 19x, which is higher than most of the competition. While it is lower than their five-year average of 29x, it is still on the high side. Additionally, their EV/EBITDA multiple is also higher than their peers, but lower than their five-year average of 20x.
Seeking Alpha Peer Comparison Tool – Valuation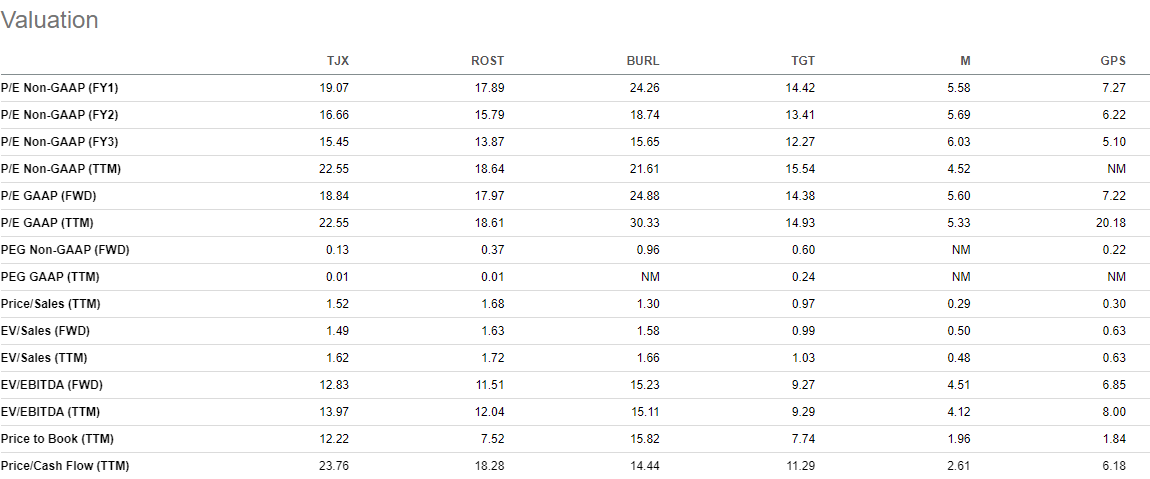
Though TJX appears overvalued from various pricing multiples, the current RSI suggests the share price is entering oversold territory.
YCharts – RSI 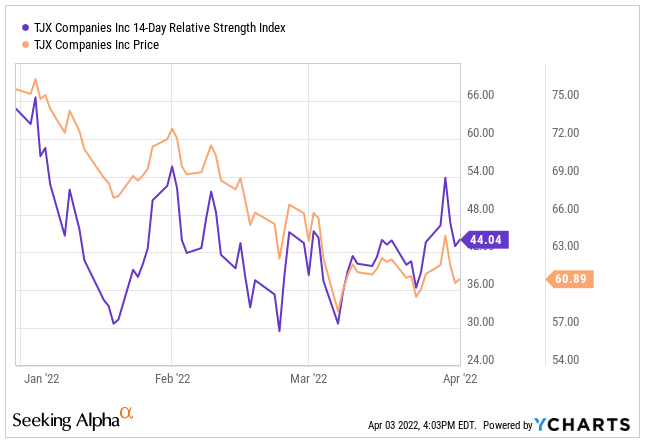
All considered, the returns of TJX over the past month are comparable to their peers, who have all declined due to concerns about a potential downturn in the overall economic environment. On valuation, however, TJX appears to be overvalued compared to their competition. While pricing multiples are lower than historical averages, they are still on the high side. The RSI, on the other hand, suggests that the company is entering oversold territory. Given historical outperformance against their peers and the broader market, it’s possible the company is in fact undervalued. To confirm, a deeper look into the company’s earnings and fundamentals is necessary
Earnings and Outlook
For the 2022 fiscal year (2021 calendar year), TJX reported strong sales over the prior year. Comparisons, however, are skewed because of the number of store closures in the 2021 fiscal year (2020 calendar year). For a more useful comparison, the company utilized a measure known as “open-only comparable store sales.” For perspective, stores were closed for approximately 4% of fiscal 2022 and 24% of fiscal 2021 due to COVID-19. While overall sales were up 51%, U.S. open-only stores increased 17% and overall open-only stores increased 15%. A driving force behind the increase was the HomeGoods segment, which is promising to be a solid growth segment for the company in future periods.
Q4 Earnings Release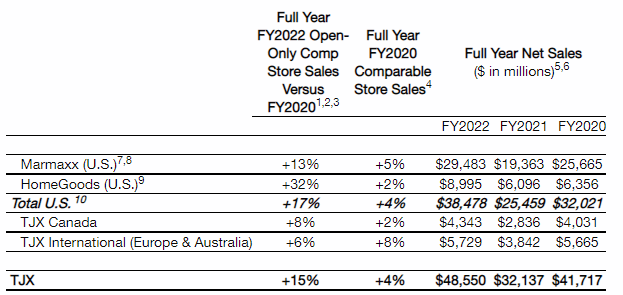
For the quarter, TJX missed by $0.13 on GAAP EPS and missed by +$330M on revenues. The misses were largely due to freight and wage cost pressures that negatively impacted the company’s ability to meet demand and maintain bottom-line margins. Shares dropped to a low of $58.33 post-earnings but have since recovered. Still, the shares are trading lower than they were prior to their earnings release.
YCharts – Earnings/Price Performance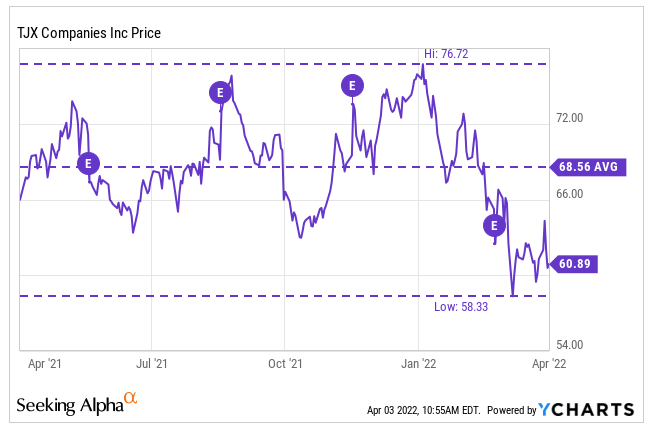
Despite the misses in the fourth quarter, the company saw strong increases in their average basket across all divisions, driven by customers placing more items into their carts. Additionally, traffic was up slightly at all their stores.
Looking ahead to fiscal year 2023, management expects comparable store sales to be up 3% to 4%. Capital expenditures are expected to be in the range of +$1.7B to +$1.9B, which appears to be on the higher end from historical averages. Furthermore, the company expects to add about 170 new stores, representing a store growth of approximately 3%. In addition to CAPEX, the company expects to buy back +$2.25B to +$2.5B of stock. Finally, the company is anticipating a tax rate of 25.8%.
One further event to consider is the divestment of the Familia acquisition. In fiscal year 2020, TJX invested +$225M for a 25% non-controlling, minority interest in privately held Familia, who is domiciled in Luxembourg and has 400 stores in Russia. As a result of recent events, it was disclosed that TJX would divest their interests in the company. The impact of this divestment would be the recognition of an investment loss of up to +$225M. On +$3.3B of net income, this does not amount to as significant of a loss as would have been reported if the company had a more controlling stake.
Liquidity Analysis
Author’s Assessment of Short-Term Liquidity Strength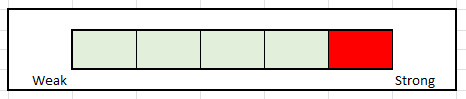
TJX reported +$13.3B in total current assets and +$10.5B in total current liabilities for the year ended January 29, 2022. Nearly 50% of total current assets were comprised of inventory in the current period versus 28% last year. The increase was attributable in part to increased purchases, as evidenced by the +$4.2B decrease in the cash balance. Still, the company has a sizeable balance of cash on hand of +$6.2B, which is nearly 50% of total current assets.
Balance Sheet – Form 10-K Balance Sheet – Form 10-K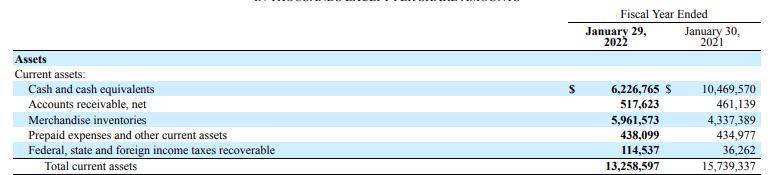
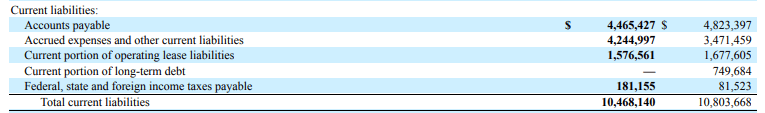
The seven liquidity ratios below provide further insight into the short-term financial position of the company. The current ratio and the quick ratio both measure the ability of the company to satisfy its current obligations with their current assets. While the current ratio includes all current assets, the quick ratio only includes the most liquid assets, such as cash and A/R. As a benchmark, a ratio of 1.00 is desirable for both calculations.
The current ratio is comfortably above 1x. The quick ratio, on the other hand, is below. This is not concerning, however. Since a large portion of current assets are in the form of inventories, a lower quick ratio is expected. One may note that the ratio was above 1x in 2020. That is true, but collections on A/R were slower in 2020, as evidenced by the two extra days it took to collect. While the ratio appears healthy at first glance, the delay in collection times resulted in an overall net negative in 2020.
Author’s Calculations of Various Short-Term Liquidity Ratios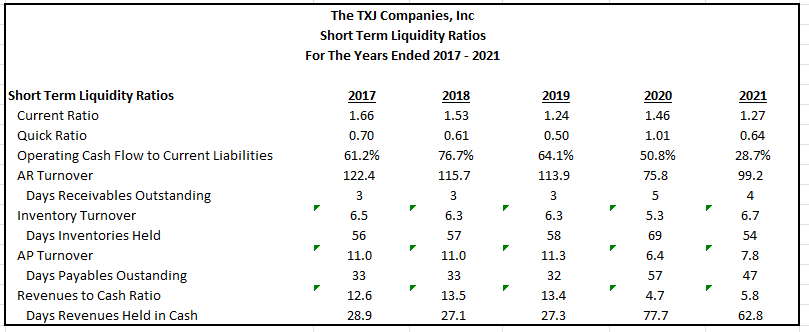
What is most important is TJX’s ability to sell off their inventory. If inventories were to remain unsold for an unreasonable amount of time, the company would incur significant costs and may potentially have a negative liquidity event. However, this appears to be a non-issue for TJX. There was an excess build-up in 2020, but inventory turnover returned to more normal levels in 2021. On average, it takes between 55-60 days for TJX to sell inventory. They are then able to collect on that sale within 5 days. During the 58 days that cash conversion is pending, the company holds off payment to their suppliers for 47 days. Thus, in 2021, there were only 11 days in which the company had to either tap into existing cash on hand or other longer-term arrangements to fund their current working capital needs. This suggests effective working capital management by the company.
Author’s Calculations of Days of Other Financing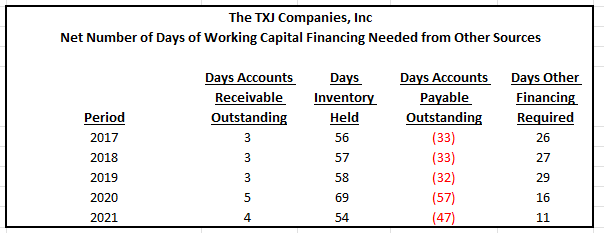
Valuable insights are often gained from analyzing the relationship between the COGS/Sales ratio and the inventory turnover ratio. There are various observations that one can make, and they are listed below for reference. Consider 2020, for example. In 2020, the COGS/Sales ratio increased from 0.72 to 0.76. Additionally, inventory turnover declined from 6.32 to 5.33. This indicates that weak economic conditions lead to reduced demand, which forced the company to reduce prices. Despite their actions, however, inventory continued to build up.
Now look at 2021. In 2021, the COGS/Sales ratio decreased from 0.76 to 0.72, while inventory turnover increased from 5.33 to 6.74. This would indicate strong economic conditions that lead to increased demand, allowing the company to increase prices. Additionally, the inability of TJX to replace their inventory as fast as they could sell it led to increased inventory turnover. This is reflective of the actual operating environment in 2020 and 2021.
Author’s Analysis of Inventory Turnover and COGS/Sales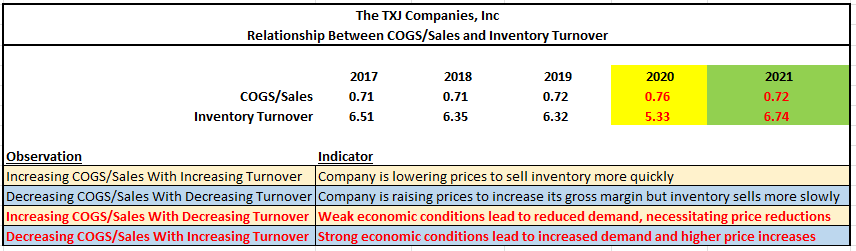
TJX is in a strong short-term liquidity position. They have ample cash on hand to fund their working capital needs, and they are experiencing no issues selling their inventory or collecting on A/R. In 2021, demand did, however, exceed the company’s ability to replenish their inventory. To respond to this demand, the company acquired a significant amount of inventory, which is reflected in the year-end balance. As long as the company is able to continue turning over their inventory in a timely manner, the assessment on short-term liquidity will remain strong.
Long-Term Solvency Analysis
Author’s Assessment of Long-Term Solvency Strength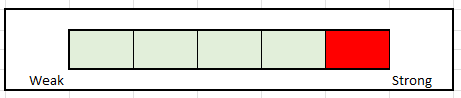
TJX’s non-current liabilities primarily include their term debt and their operating lease liabilities. Together, they totaled +$10.9B in the current year. When factoring in EBITDA of +$5.4B and cash on hand of +$6.2B, net debt was approximately 0.87x.
Long-Term Debt Summary – Form 10-K
Various solvency ratios are provided below for further support. Based on the results of these ratios, there are no concerns regarding the company’s indebtedness. The interest coverage ratio is very high, indicating a low cost of debt and significant earnings strength. Furthermore, the high Z-Score suggests a virtually 0% chance of bankruptcy.
Author’s Calculations of Various Long-Term Solvency Ratios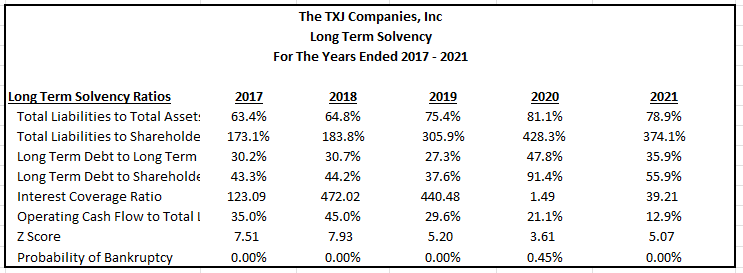
85% of the long-term debt obligations are due after 2026, and there are essentially no near-term maturities. Therefore, there are no concerns regarding repayment risk.
Debt Maturity Summary – Form 10-K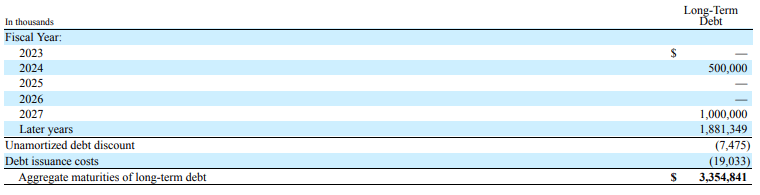
The lease obligations are due evenly every year, and this makes sense given the nature of the contracts. The company has more than enough cash on hand to cover these payments, so, again, there are no concerns regarding repayment risk.
Lease Obligations Summary – Form 10-K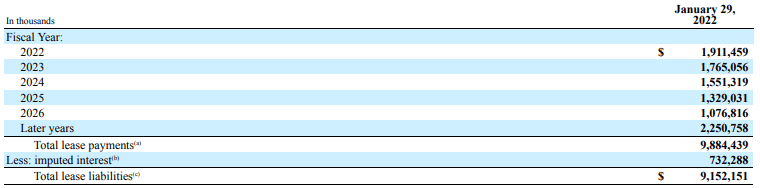
Overall, the long-term viability of TJX is solid. The company is not excessively indebted, and their earnings and existing cash on hand are sufficient to meet their obligations as they come due, which primarily won’t be until later years. As such, a strong rating is appropriate.
Profitability Analysis
Author’s Assessment of Profitability Strength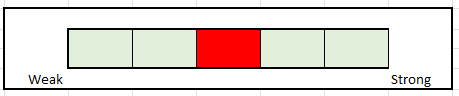
Revenues in 2021 were up over 50% from 2020. However, the comparison is not as meaningful because of COVID. Still, even when compared to 2019, revenues were still up about 16%, which is historically high for the company. Gross profit margins remained consistent despite rising freight costs. Higher selling prices offset much of the increases in their cost of sales. Margins elsewhere, however, were down. For example, net income margins came in at 6.8% versus in the upper 7s in the years prior to 2020. The compression in margins were primarily attributable to higher wage costs. FCF appears weak at first glance but remember that there were significant purchases of inventory during the year. The effect would be a reduction in working capital, which negatively affects operating cash flow. In a more normalized year, margins on FCF would have likely been higher.
Author’s Calculations of Various Profitability Metrics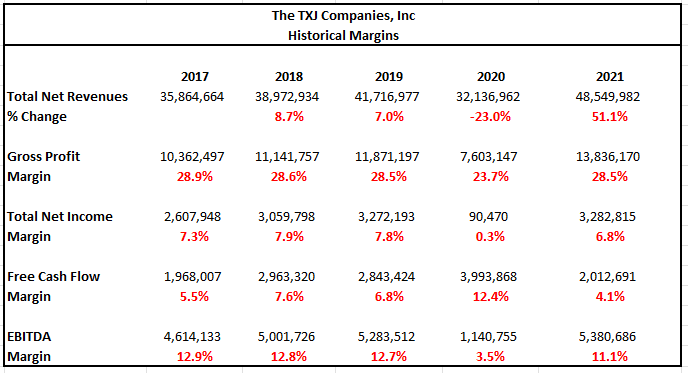
When compared to competitors, five-year revenue growth appears underwhelming. Forward projections appear strong, however.
Seeking Alpha Peer Comparison Tool – Growth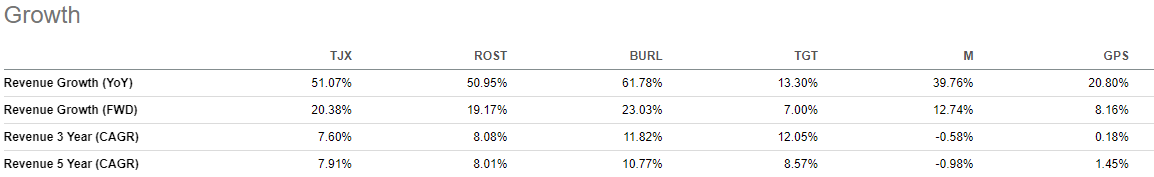
Overall profitability also appears to be lower than most of their peers. Their revenue per employee is well below the competition. In a period of rising wages, a more productive workforce is desirable to mitigate costs. Productivity at TJX appears low. Further margin compression is possible without improvements in this metric.
TJX is outperforming on cash flow generation. Other than Target, who is generating nearly +$9B in operating cash flow, no other competitor is generating as much cash as TJX.
Seeking Alpha Peer Comparison Tool – Profitability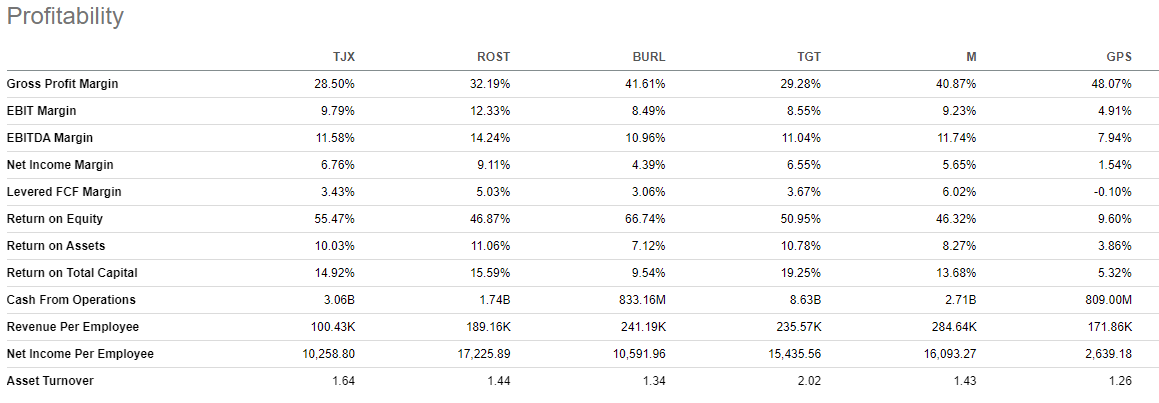
Higher selling prices are preserving gross profit margin. But rising labor and freight costs are impacting margins on net income and EBITDA. Additionally, their workforce doesn’t appear to be as productive as their peers and revenue growth leaves much to be desired. While growth prospects are solid, it is best to remain neutral until margins improve to more normalized levels.
Cash Flow Analysis
Author’s Assessment of Cash Flow Strength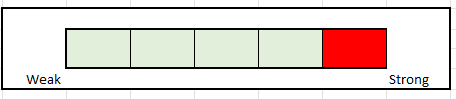
TJX reported +$3.1B in operating cash flow in the 2021 calendar year. This was lower than the prior two years. In the current year, net inventory changes reduced operating cash flow by +$1.7B. This was due to higher purchases and inventory in transit. In 2020, net A/P had a +$2.1B positive impact on operating cash flow. This was due to the company holding payment to their suppliers to retain their cash reserves due to the uncertainty of COVID. At normalized levels, operating cash flow in 2021 would have been +$1.5B higher than originally reported.
Cash Flow Statement – Form 10-K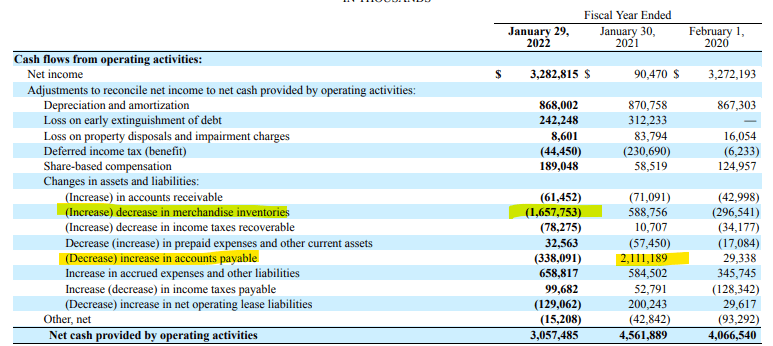
The summary below was obtained from the data within the cash flow statement. As can be seen, the company is generating strong FCFs, despite the challenging operating environment. As stated previously, FCF would have been even higher if inventory activity was at more normalized levels. The +$3.2B net cash received from financing activities in 2020 was due to receipts of long-term debt of +$6.0B. That was partially paid back in 2021.
In the current year, TJX returned +$3.5B to shareholders in the form of dividends and buybacks. The dividend is well covered by both free cash flow and operating cash flow and the payouts are less than 50% of net income. When including share repurchases, coverage drops, but that is not a concern since the company has enough cash on hand to cover the excess payment. The dividend was cut in 2020, but it has since been restored to a new high. Overall, the dividend is safe and is likely to continue growing in future periods.
Author’s Summary of Cash Flow Statement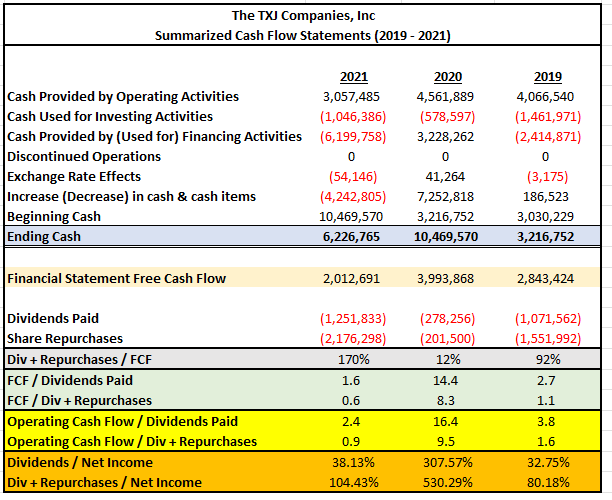
TJX is consistently generating strong operating cash flows that are being used to invest in growth and to reward shareholders via dividends and buybacks. The cut in 2020 was overdone, but understandable given the uncertainty at the time. Moving forward, the dividend payout is fully covered and is likely to grow in future years. A strong rating is thus appropriate for cash flow strength.
Target Share Price
Various methodologies were utilized to obtain an indication of the intrinsic share price of TJX. The results are provided in the chart below. The quickest methods involved simply applying the historical multiples to current pricing. Doing so yielded target prices with a low of $54 to a high of $93.
When applying models involving future cash flows, results came in at a low of $61 and a high of $75. With these models, the rate on the 10-YR U.S. Treasury is a critical variable in the computations. Since rates are projected to increase, the model incorporated the current rate, which was 2.5% at the time of analysis, as reported in The Wall Street Journal. For hypothetical purposes, the analysis also utilized a rate of 3%.
When considering the results of all methods, the average target price is approximately $72.
Author’s Summary of Various Valuation Methodologies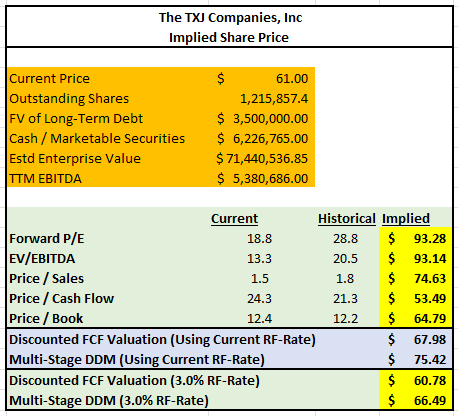
For illustrative purposes, what follows is an expansion of the results of the FCF valuation method.
The first step in the model was to input the historical data from the past five years. For simplicity, a fixed tax rate of 25% was used for all periods in arriving at NOPAT. This tax rate is consistent with current period rates. Furthermore, total operating capital was defined as the combination of total current assets and net PP&E, less total current liabilities. The net new operating capital was simply the year-over-year change. FCF, then, was the difference between NOPAT and net new operating capital.
Author’s Calculations of Historical FCFs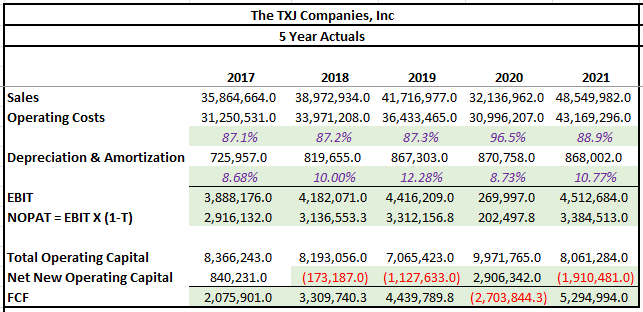
The next step in the model was to input the various assumptions required to calculate the future cash flows to the company. The growth rate of sales for this model was expected to be fixed at 5%, with long run FCF growth settling in at 3%. The sales figures are generally in-line with management’s outlook. The long-run FCF growth, on the other hand, was meant to track long-run GDP growth, which is projected to be in the low-single digits.
Operating costs as a percentage of sales have historically been in the high 80s, while depreciation and amortization as a percentage of operating capital has been around 10% over the past two years. For this model, higher percentages for operating costs were used for near-term periods before returning to more normal levels in the later years. Depreciation was kept at 10.75% for all periods.
Finally, the discount rate was obtained by applying the CAPM formula. This formula incorporates the stock beta, the risk-free rate, and an expected risk premium. The beta of TJX is 0.93, as reported in Morningstar. The risk-free rate was 2.50%, as stated earlier. The historical risk premium is 5.5%. Thus, the expected return on market is 8.0%. The result of the CAPM upon inputting these variables is 7.62%
The summary below provides the projected FCFs over the next five years. The results of this model are on the conservative side to account for the risk of deviations and setbacks from management’s outlook.
Author’s Full Projections of Future FCFs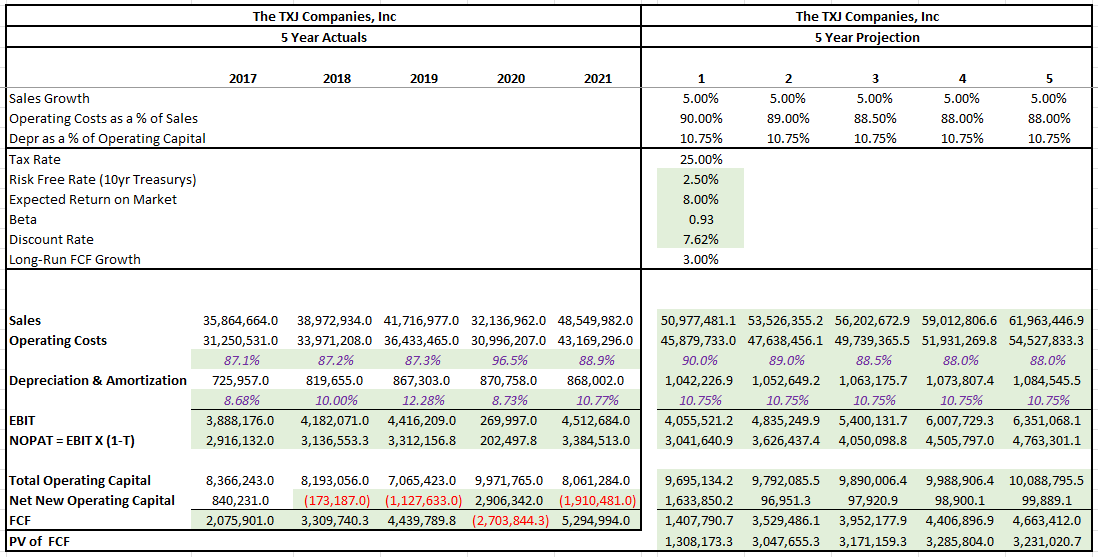
The final step in the model was to calculate the terminal value using the long-run FCF growth rate and combine that result with the sum of the present value of the future FCFs above. Additionally, the market value of debt needed to be deducted from the totals to arrive at the intrinsic value to common shareholders. In the notes to the financial statements, it was disclosed that the market value of debt was +$3.5B. Therefore, that is what was used in the calculation.
Author’s Final Intrinsic Share Price Calculation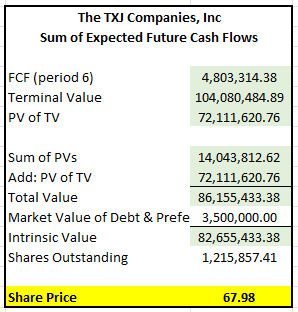
As seen above, the intrinsic share price using this model is $68.00. Taken together with the other methods, this further supports a target price of $72.
Primary Risks
As a discretionary apparel company, TJX is highly dependent on discretionary spending. In times of economic turmoil with periods of significant stress to household budgets, TJX’s products will be among the first to be cut as consumers reorient a larger share of their budget to more essential items. In addition, the rising cost of food and energy is a further strain on household incomes. As these costs continue to rise, consumers will increasingly cut back on discretionary spending.
The purchasing strategy of TJX places considerable discretion with their merchants. The merchants typically buy throughout the year, with much of the company’s merchandise purchased for the current or immediately upcoming season. If the merchants do not properly assess the desirability and value of the merchandise or if they fail to identify changing opportunities and trends in the market, customer traffic and sales could be negatively impacted. Additionally, if merchants do not purchase products at prices sufficiently below prices paid by conventional retailers, the company may not be able to maintain an adequate pricing differential to full-price retailers. This would adversely affect customer traffic and sales.
Continued increases in labor costs could further compress operating margins. Furthermore, to retain existing employees and attract new ones, the company must offer competitive wages or benefits. In a tight labor market with high turnover rates, it can be difficult for the company to match the wages and benefits being offered by their competitors. In addition, many of their associates in their distribution centers are members of unions. This exposes the company to the risk of various labor actions, including work stoppages and potential material expenses associated with multiemployer plans.
In addition to inflationary wage related risks, the company faces supply-side risks as well. Significant supply-related disruptions can have a negative impact on future sales if the company is unable to match an increasing amount of demand with associated products. Furthermore, if any of their suppliers, many of whom are oversees, fail to deliver products according to the company’s specifications, delays may occur in meeting customer demand, and this would negatively affect the company’s reputation and future sales.
The company leases virtually all their store locations, and they own or lease for long periods their primary distribution centers and administrative offices. While the company has the right to terminate some of their leases, they may not be able to terminate most of their leases if or when they would like to do so. For example, if they decide to permanently close stores, they would typically be required to continue to perform their lease obligations, such as paying rent and operating expenses for the balance of the lease term. This can result in unnecessary and unavoidable expenses that could tie up the company’s cash flows.
Conclusion
The decline in the share price of TJX since their earnings release has presented an opportunity for new shareholders that are interested in adding a quality retailer to their diversified portfolios. The liquidity position of the company is strong, as evidenced by the company’s effectiveness in managing their working capital and their cash on hand balance of +$6.2B, which represents nearly 50% of total current assets.
In addition, there are no solvency issues or concerns about the company’s long-term viability. Longer term debt is primarily due in later years, and the company is generating sufficient earnings to cover their obligations. The financial flexibility allows the company to invest in growth projects and to return excess cash to shareholders. In addition, the dividend was recently increased by double-digits and further increases are likely moving forward.
As rising prices continue to impact consumers, more will shop at off-price retailers when they do decide to make discretionary purchases. This will favorably impact TJX in the immediate future. In the longer-term, the company should benefit from the shopping habits of the Gen-Z generation, who focus on value and the in-store experience.
At present pricing, shares appear at least 15% undervalued. Strong fundamentals and a favorable outlook further support the opportunity in the shares. As such, this discount retailer is itself a bargain in the overall industry and the broader market in general.
Be the first to comment