

BernardaSv/iStock via Getty Images
The unionization of Starbucks and other companies is spreading:
Employees at six more Starbucks coffee shops in Upstate New York voted to unionize Thursday and Friday, delivering a string of wins for the nascent organization effort at one of America’s most ubiquitous coffee retailers.
…..
The elections come at a time when organized labor is asserting itself as a combination of strong corporate profits, inflation, worker shortages and pandemic-inflicted hardship has given unions additional leverage.
Labor unions are hoping to capture the moment to expand their reach after decades of retrenchment. They have been pressing hard on contract negotiations, winning back long-lost benefits for their members amid a rash of strikes. And they are moving aggressively to organize nonunion shops. There have been 641 petitions filed with the National Labor Relations Board in 2022 as of Friday, the fastest pace of new petitions since 2008, according an analysis of NLRB data.
This is a truly fascinating development from the current economic environment.
Ten-year yields climbed through 2.75% for the first time since March 2019 as investors priced in the impact of the Federal Reserve’s tightening plan and accelerating inflation. The move pushed the greenback higher, the yen through the 125 per dollar level and erased the more than decade long premium benchmark Chinese bonds held over their U.S. counterparts. Most stocks fell.
“A move this profound from a corner of markets that has such pervasive effects — from pricing of credit to the determination of ‘risk free returns’ is a cause for major risk re-pricing, one would suspect,” said Vishnu Varathan, head of economics and strategy at Mizuho Bank Ltd. “I think the impact of such sustained and strong moves in Treasury yields will be hard to dodge for anyone.”
Here are the charts:
10, 30, 2, and 5-year treasury yields (FRED)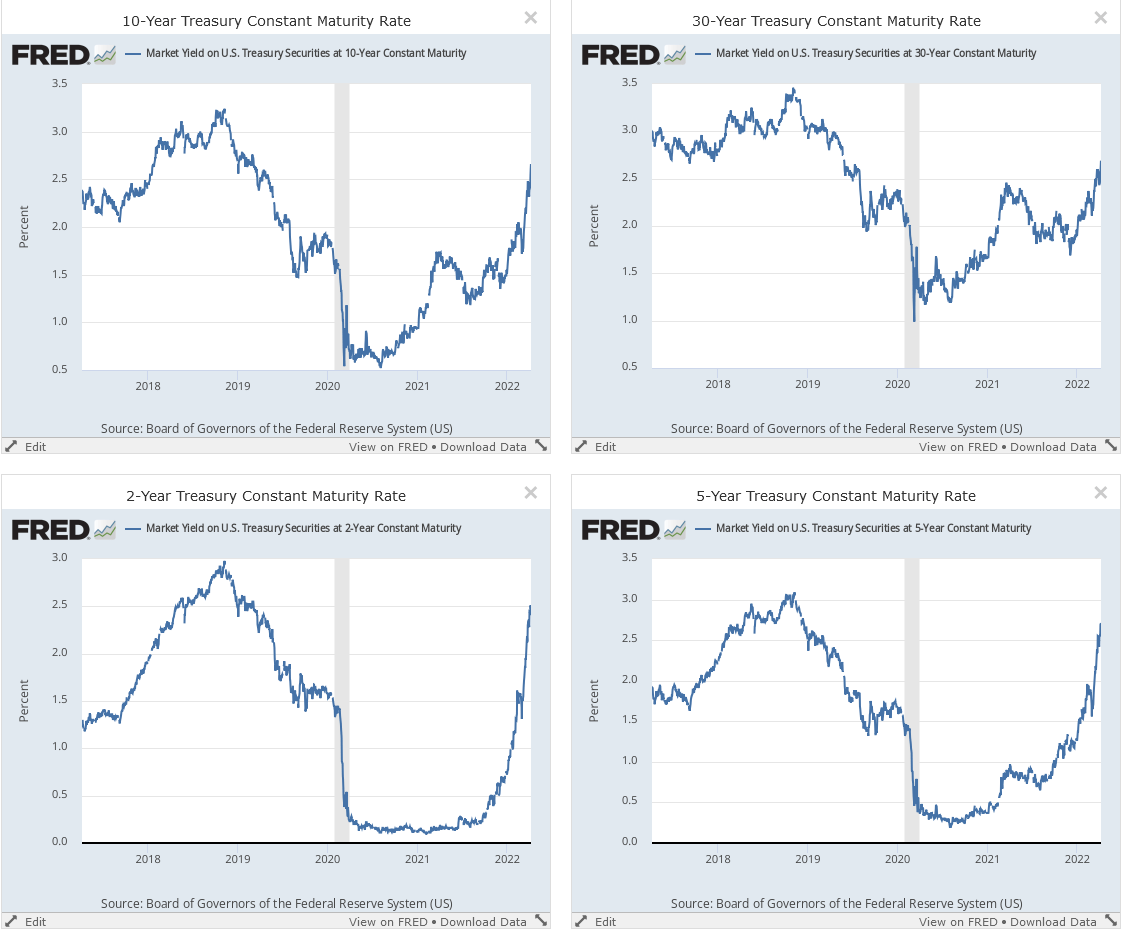
The entire yield curve has moved higher in the last 4-6 months. The move in the short end of the curve has been the most pronounced. But even the 30-year is up about 65 basis points. All of these interest rates are used in time value of money calculations, which means the overall impact has spread across the entire financial world.
The market has turned very defensive:
RRG chart of the 11 major index-tracking ETFs (Stockcharts)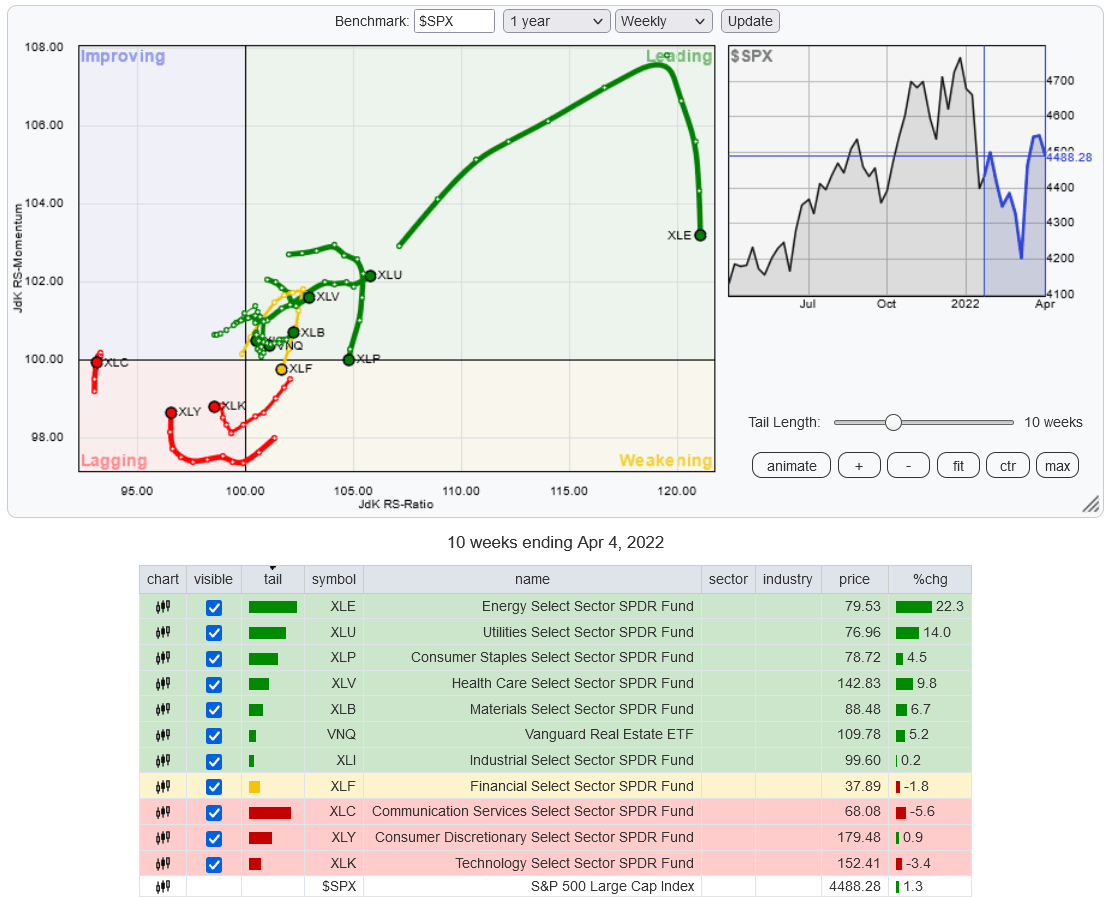
Staples, utilities, and health care (all defensive sectors) are three of the strongest-performing sectors on the RRG chart. Meanwhile, technology, communication services, and consumer discretionary (all aggressive sectors) are lagging.
This is a very defensive tone.
Today, let’s take the long view and see where we are on the weekly charts:
Weekly DIA (Stockcharts)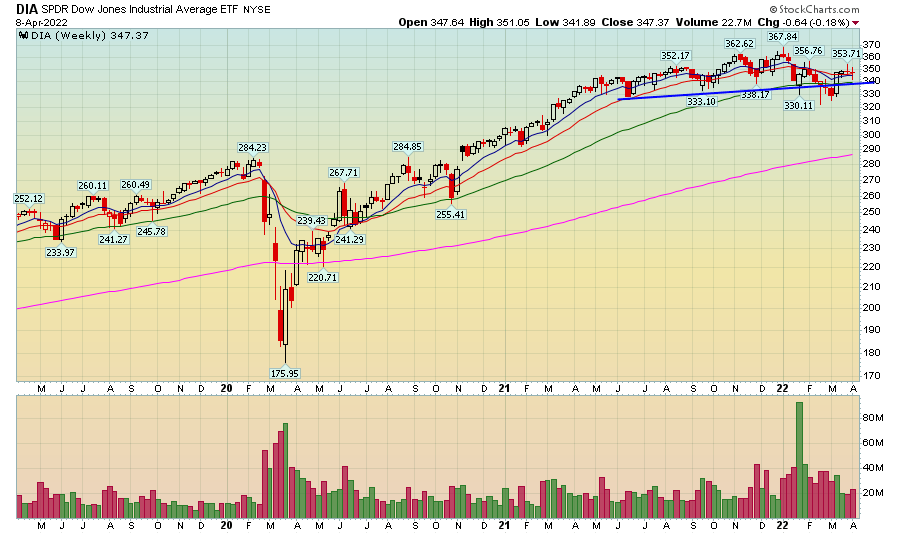
The DIA is actually pretty close to a pure sideways consolidation. Prices dipped below support a few weeks ago, but quickly rallied above that level.
SPY Weekly (Stockcharts)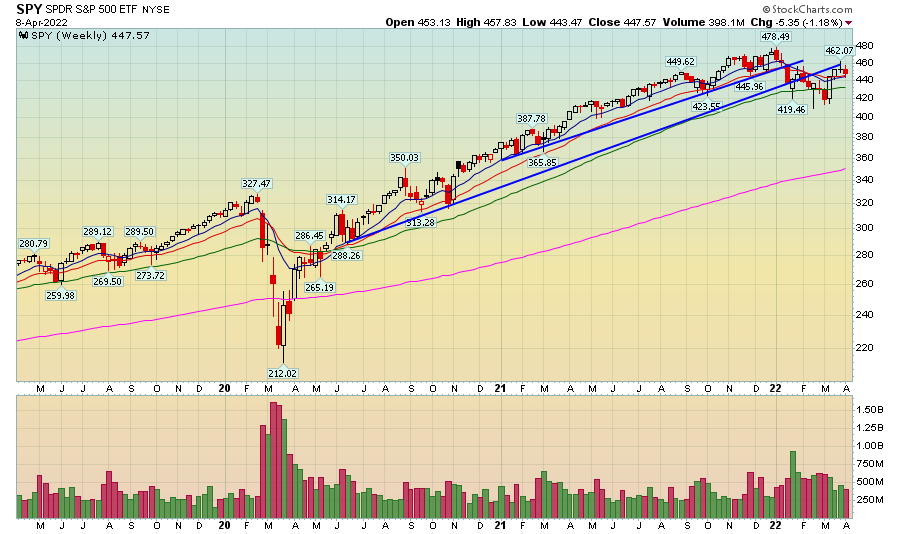
The SPY has broken several long-term trend lines since the start of the year. But in the last few weeks, the index has rallied pretty strongly.
QQQ weekly (Stockcharts)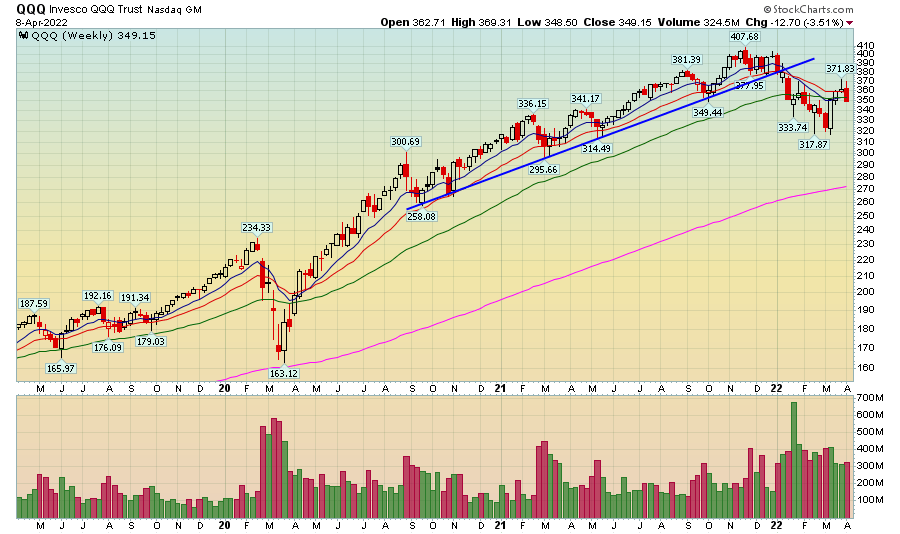
The QQQ is the most bearish of the lot. It printed an extended downward move for most of this year.
IWM Weekly (Stockcharts)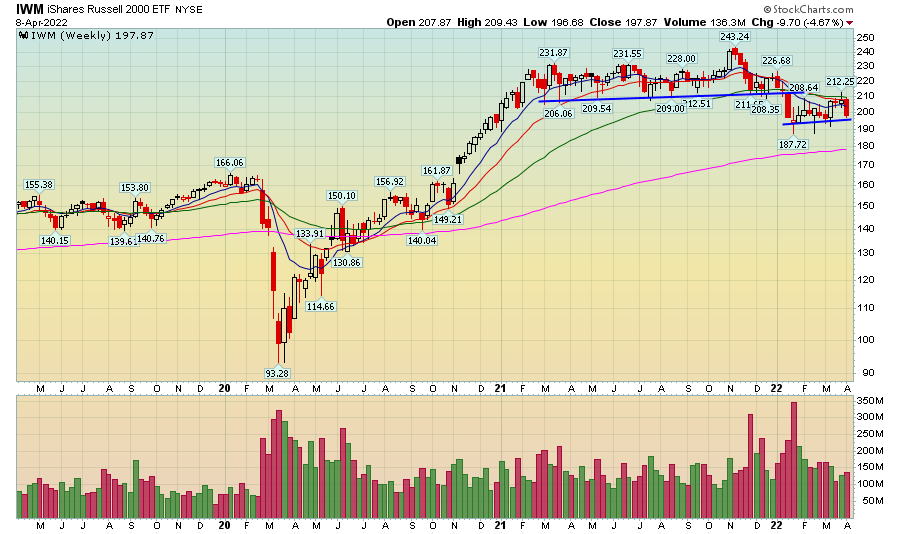
The IWM has printed two sideways consolidations in the last year.
The weekly charts really aren’t that bad. They show that markets aren’t in freefall. Instead, they’re repricing risk. Expect this trend to continue throughout the 2Q22 as the Fed embarks on its rate hiking program.
Be the first to comment