

matdesign24/E+ via Getty Images
Shallow men believe in luck. Strong men believe in cause and effect.” – Ralph Waldo Emerson
While we all need a bit of luck, navigating 2022 will take quite a bit of skill as well. This year we’ll more than likely see a continuance of a theme that dominated 2021. An obsession with calls for THE market top. Why not, the equity market as measured by the S&P 500 has been on an incredible bull market journey.
The S&P ended up gaining 26+% in 2021, while dividends boosted its total return up to 28.7%. There were three down months – January (-1.1%), September (-4.8%), and November (0.8%). The best stretch of the year was the seven months from February through August when the S&P gained over 21% with no down months. The best month of the year was October, however, which saw the S&P gain 6.9% and easily recover all of September’s losses. In terms of drawdowns, there were just four multi-day declines of more than 4%, and there was just one drawdown of more than 5%. The 5% drawdown occurred from September 2nd through October 4th for a total drop of 5.2%.
Contrarian investors might be prone to think that the market is likely to fall after a big up year, while momentum investors like to trade on strength. One year of positives turning into strength the next year. But if we look at the correlation between returns one year to the next, there isn’t any. What we do find however is that after huge gains there is a period of rest, consolidation, and perhaps a retest of a bullish investor’s will. Market participants, especially all of the “newbies” that have been drawn to equities recently haven’t experienced the latter recently. A 28% gain for the S&P in 2019 was followed by a 16% rally which was then followed by last year’s 27% gain for the S&P.
So with that setup, investors are pondering how the equity market might perform in the coming year. Regular readers know I like to take the scene in small increments, 3 to 6 months at best when viewing the stock market. I start with a review of what is in front of us, then assign probabilities for events occurring to come up with scenarios. That produces a set of conclusions that takes many variables into account.
The issues facing the market today are very much intertwined, all making the situation very fluid. Predicting where the S&P 500 is going to be one month from now is hard enough, so trying to predict where prices will be a full year from now is sheer folly. Far too many developments can take place that will toss the best plans aside.
One thing I won’t do is to fool anyone and talk about a black swan. I’ll leave that to the gurus that proclaim they have the insight into predicting a market-changing event. I’ve alerted members of my service that this year will require a BROAD outline that will act as a CORE for my market strategy. That will be followed with timely updates every quarter as the investment backdrop unfolds, while never losing sight of what the stock market is telling investors along the way.
A Look Back
To look forward, we have to look back and see how and why things developed the way they did. In general far too many never realized how strong the “V” shaped recovery that was made possible by the strong economic setting before the COVID event. A low tax pro-business environment that was already in place helped companies rebound quickly. Many analysts were caught flat-footed as their EPS forecasts remained woefully low for the better part of last year. A situation that was highlighted here right from the start. Earnings drive the market and the quarter after quarter earnings surprises kept driving the market higher.
The fact that many if not all of the tax “proposals” never saw the light of day last year kept that old winning formula in place. That was the cherry on top of the cake as the S&P closed at new highs in the last week of December.
Now if I believed the probability was HIGH that this backdrop would remain in place, that inflation will be tamed quickly, supply chains resolved in short order, and the Fed not forced to act aggressively, I would join the crowd and make predictions for 2022. Instead, the “change” I have commented about in the latter half of 2021 is already here in the form of a Fed policy that is now more aggressive than originally thought.
How that change unfolds and how the key players react to that “change” will dictate the course of the equity market in 2022.
The Week On Wall Street
The New Year started the way last year ended. New highs for the S&P 500 and the DJIA were forged on the first day of trading in 2022. There was a slight twist. While “defensives” were the best performing sectors last month they were the biggest losers on Monday. Instead, it was time for the Value/Cyclical sectors to shine.
That trend carried into Tuesday and while we saw “Value” rally strong, the HIGH PE sectors were sold off hard. The DJIA made it back-to-back days with new highs.
The Dow and S&P 500 entered the day on Wednesday in an overbought condition. When an overbought market meets a negative Fed headline the result is a selling event and that is what transpired. The Growth-oriented stocks were once again demolished, while some of the value names did manage to hold their own.
It was “stabilization” on Thursday, but plenty of indecision on Friday leaving the S&P testing support as trading ended for the week. All of the major indices closed the week with losses. An interesting start to the New Year as investors are already being “tested”.
The Fed
Minutes from the Federal Reserve’s last policy meeting stated:
In light of elevated inflation pressures and the strengthening labor market, participants judged that the increase in policy accommodation provided by the ongoing pace of net asset purchases was no longer necessary. They remarked that a quicker conclusion of net asset purchases would better position the Committee to set the policy to address the full range of plausible economic outcomes. Participants judged that it would be appropriate to double the pace of the ongoing reduction in net asset purchases.
Such a change would result in reducing the monthly pace of net purchases of Treasury securities by $20 billion and of agency MBS by $10 billion starting in January. Participants also expected that economic conditions would evolve in a manner such that similar reductions in the pace of net asset purchases would be appropriate each subsequent month, resulting in an end to net asset purchases in mid-March, a few months sooner than participants had anticipated at the November FOMC meeting.
In addition, participants remarked that the Committee should continue to be prepared to adjust the pace of purchases if warranted by changes in the economic outlook. Participants continued to stress that maintaining flexibility to implement appropriate policy adjustments on the basis of risk-management considerations should be a guiding principle in conducting policy in the current highly uncertain environment.
Participants generally noted that, given their individual outlooks for the economy, the labor market, and inflation, it may become warranted to increase the federal funds rate sooner or at a faster pace than participants had earlier anticipated. Some participants also noted that it could be appropriate to begin to reduce the size of the Federal Reserve’s balance sheet relatively soon after beginning to raise the federal funds rate.
Some participants judged that a less accommodative future stance of policy would likely be warranted and that the Committee should convey a strong commitment to address elevated inflation pressures. These participants noted, however, that a measured approach to tightening policy would help enable the Committee to assess incoming data and be in position to react to the full range of plausible economic outcomes.
I warned that inflation could bring the Fed into the picture much earlier than anticipated and the market was NOT priced for that. An aggressive Fed posture to fight inflation is now squarely on the table.
Yield Curve
A trading range under 1% for the 10-year Treasury note had been in place for quite some time, and the 10-year started 2021 at 0.93%. The 10-year closed trading on Friday at 1.76%. More importantly, it is the speed of the recent ascent that is catching investors off guard. The 10-year has gone from 1.52% to 1.76% in a week. Last year’s high was 1.77%. From a technical standpoint, a rally that takes the 10-year above that level for a few days can lead to a move to 2%.
The 2-year/ 10-year Curve stood at 123 basis points in June of last year. That simply implies the difference between the two notes was positive indicating neither yield curve was inverted. An inverted yield curve reflects a scenario in which short-term debt instruments have higher yields than long-term instruments of the same credit risk profile.
At the close, on Friday, the 2-year/10-year spread was 89 basis points. It was 88 a week earlier.
The Political Scene
When we talk about the positive pro-business, low tax environment, it’s for a reason; that backdrop spurs growth. There are plenty of reasons I keep harping on all of the spending proposals that also have increased taxes associated with them.
Recent Income data published by the IRS clearly show that on average ALL income brackets benefited substantially from the tax reform law, with the biggest beneficiaries being working and middle-income filers, not the top 1%. That 1 % argument has been disproved over and over and now the IRS data disputes those false claims.
A careful analysis of the IRS tax data, one that includes the effects of tax credits and other reforms to the tax code, shows that filers with an adjusted gross income of $15,000 to $50,000 enjoyed an average tax cut of 16 percent to 26 percent in 2018.
Filers who earned $50,000 to $100,000 received a tax break of about 15 percent to 17 percent, and those earning $100,000 to $500,000 in adjusted gross income saw their income taxes cut by around 11 percent to 13 percent.
By comparison, no income group with an AGI of at least $500,000 received an average tax cut exceeding 9 percent, and the average tax cut for brackets starting at $1 million was less than 6 percent.
Why is this important? It led to a poverty rate of 10.5% in 2019 compared to 14% in 2016. That was due to the lowest unemployment rate in history across ALL demographics. Growth was seen in abundance at every level.
Open your mind, mute the “bias” issues and deal with the facts. With interest rates about to be raised to fight a battle with inflation, it will be imperative to see the economy stay on a growth trajectory. The mere idea of raising taxes at any level and adding more stimulus that will fuel inflation is a policy error. A mistake that compounds the policy error that has the greatest tax of all, INFLATION, at elevated levels.
Ironically, the same day the Fed announced their hawkish stance on rates, Congress was proposing another stimulus package. While this spending proposal has a lot of merits, the timing couldn’t be worse. The fact that is even being discussed is worrisome. Congress used their inflation-causing spending bullets chasing clean air and electric vehicle dreams instead of assisting the everyday business owner. Instead the enforced lockdowns with regulations that simply didn’t work put tens of thousands of businesses and their employees in jeopardy.
Opening the spigots, adding more money to this inflation backdrop spells more trouble. For those that STILL don’t get it, more spending equals more inflation, and we have a glimpse of how the Fed has to attack inflation.
The Economy
Labor Scene
Another big miss on the job scene. When the November payroll report came out well under the estimates analysts claimed there had to be something wrong with that number. The December jobs report missed estimates by 50% and the prior month’s numbers weren’t revised. December nonfarm payrolls were up 199,000 vs. last month, the consensus was for 400,000. I’m not convinced there are “issues” with the reported numbers. Average hourly earnings continue to increase (inflation), while that labor participation rate remains elevated. Working-age women have left the scene as the combined issues of the enhanced child care credit and the ongoing closing of schools have kept them home. Vaccine mandates and the group that has opted for early retirement have impacted the available workforce as well. The unemployment rate is now at 3.9%, simply because the ‘disappearing’ workforce grows as people aren’t coming back into the job market.
JOLTS – job openings declined 529K to 10.5 million in November following the 489K increase to 11.09 million in October. The rate tumbled to 6.6% after rising to 7.0% previously. Hirings bounced 191K to 6.6 million after falling 40Kto 6.5 million. The rate inched up to 4.5% from 4.4% in the prior 3 months. Quitters increased 370K to 4.5 million. The rate bounced to 3.0% following the drop to 2.8% previously.
The “quit rate” says employees are now emboldened to seek better pay and benefits. Employers are forced to pay and then they raise prices. That will add to the inflation scene making the FED’s job tougher to navigate.
Manufacturing
December PMI data from IHS Markit indicated a further subdued upturn in production across the US manufacturing sector. Except for October and November, the pace of output growth was the slowest since October 2020.
The seasonally adjusted IHS Markit US Manufacturing Purchasing Managers’ Index posted 57.7 in December, down from 58.3 in November but broadly in line with the earlier released ‘flash’ estimate of 57.8. The improvement in the health of the US manufacturing sector was the slowest in 2021 amid subdued output and new order growth. Ongoing efforts to build safety stocks and a severe deterioration in vendor performance, ordinarily signs of improving conditions, continued to lift the headline PMI, however.
While the pace has slowed, the PMI index remains at or above pre-pandemic levels.
In the meantime, services providers registered another steep expansion in business activity at the end of 2021, according to the latest PMITM data. The upturn eased slightly to the slowest for three months but was supported by a sharper increase in new business.
The seasonally adjusted final IHS Markit US Services PMI Business Activity Index registered 57.6 in December, down from 58.0 in November, but broadly in line with the earlier released ‘flash’ estimate of 57.5. The latest data signaled a sharp upturn in service sector business activity, despite the pace of growth easing to a three-month low. The expansion was driven by stronger client demand, according to survey respondents.
ISM undershot estimates with a drop to a 13-month low of 58.7 that was also seen last January versus 61.1 in November and a 37-year high of 64.7 in March that was last seen in 1983. The headline was pulled down by a plunge for prices paid to a 13-month low of 68.2 from 82.4 versus a 42-year high of 92.1 in June.
This week’s ISM drop accompanies small gains for the Chicago PMI and Richmond Fed, a solid Empire State report, a Dallas Fed drop, and a weak Philly Fed figure to leave what is still an optimistic overall sentiment path despite a pull-back on the month. Most measures through Q4 have remained at or near record highs.
Construction spending edged up 0.4% in November, weaker than projected. But the prior two months were revised higher to give the data a better look. October was bumped up to a 0.4% (was 0.2%) gain, with September now posting a 1.0% increase (was -0.1%). Though conditions have been improving, construction spending continues to see headwinds from shortages of labor, construction materials, and buildable land that are capping home sales which in turn have been impacted by lean inventories, record sales prices, and rising mortgage rates.
Global Scene
The rate of global economic expansion slowed slightly at the end of 2021, as a weaker increase in services activity offset faster growth of manufacturing production.
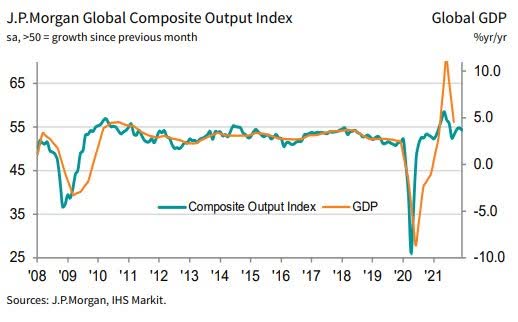
The J.P. Morgan Global Composite Output Index slipped to a three-month low of 54.3 in December, down from 54.8 in November. The headline index has now signaled expansion in each of the past 18 months.
The global manufacturing sector ended 2021 on a positive note. Rates of increase in output, new orders, and employment all accelerated, while business optimism data indicated companies expect output to rise further over the coming year.
The J.P. Morgan Global Manufacturing PMI continued to track sideways in December, posting 54.2 for the third successive month. PMI readings signaled growth for all three broad sub-sectors covered by the survey, with faster growth at investment goods producers offset by slightly weaker rates of expansion in the consumer and intermediate goods industries.
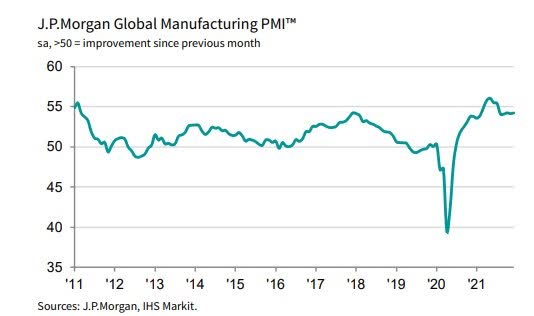 The index remains ABOVE pre-pandemic levels.
The Eurozone
December PMI data showed a further easing of the supply chain crisis as average lead times lengthened to the softest extent since February. The IHS Markit Eurozone Manufacturing PMI fell to 58.0 during December, down from 58.4 in November and its lowest reading in ten months. Sector data revealed that consumer goods makers drove the slower improvement in manufacturing conditions, with intermediate and capital goods producers registering marginally quicker upturns. Momentum may be slowing but the Manufacturing PMI data for the Eurozone is still near all-time highs. Following a brief acceleration in November, overall economic growth in the euro area eased to a nine-month low during December, resuming a slowdown trend amid a resurgence of COVID-19 infections. This had a notable effect on the service sector, restricting increases in both activity and new business.
After accounting for seasonal factors, the IHS Markit Eurozone PMI Composite Output Index fell to 53.3 in December, down from 55.4 in November, to signal the softest expansion in combined manufacturing and services output since March.
The U.K.
The U.K. manufacturing sector saw further growth in production, new orders, and employment at the end of 2021. Although a slight easing in supply chain delays helped lift output volumes and take some of the heat out of input price increases, logistic disruptions and staff shortages were nonetheless still stymieing the overall pace of expansion.
The seasonally adjusted IHS Markit/CIPS Manufacturing Purchasing Managers’ Index rose to 57.9 in December, little changed from November’s three-month high of 58.1. The PMI has remained above the neutral 50.0 mark for 19 months.
U.K. service providers highlighted a considerable reversal of fortunes during December as the Omicron variant led to a steep fall in spending on face-to-face consumer services, escalating business uncertainty and disruptions due to staff absences.
At 53.6 in December, the headline seasonally adjusted IHS Markit/CIPS UK Services PMI Business Activity Index was down sharply from 58.5 in November and the lowest since February. The latest reading was nonetheless comfortably above the neutral 50.0 thresholds, which extended the current phase of output expansion to 10 months.
China
Operating conditions across China’s manufacturing sector improved slightly at the end of the year, according to the latest PMI data. Firms signaled the strongest increase in output for a year amid a renewed uptick in total sales. The headline seasonally adjusted Caixin China Purchasing Managers’ Index, a composite indicator designed to provide a single-figure snapshot of operating conditions in the manufacturing economy – rose from 49.9 in November to 50.9 in December, to signal a renewed improvement in the health of the sector. Though marginal, the rate of improvement was the strongest seen since June.
Chinese service providers signaled a strong end to 2021, with firms registering faster increases in both business activity and overall new work. Improved sales and efforts to increase capacity led to a further rise in staffing levels.
The headline seasonally adjusted Caixin China Business Activity Index increased from 52.1 in November to 53.1 in December, to indicate a stronger rise in services activity at the end of 2021. Output has now increased in each of the past four months, with the latest rise solid overall. Companies that registered higher activity levels often mentioned that improved market conditions, new product releases, and higher sales had supported growth.
Japan
The Japanese manufacturing sector registered a solid, albeit slightly softer improvement in operating conditions at the end of 2021, according to December PMI data.
At 54.3 in December, the headline au Jibun Bank Japan Manufacturing Purchasing Managers’ Index dipped from 54.5 in November. This indicated a softer improvement in the health of the sector but was well above the average seen in 2021 as a whole (52.7).
The Japanese service sector witnessed a softer expansion at the end of 2021. Both the activity and new orders indices signaled softer, yet still moderate rates of growth in December, as businesses continued to report a steady recovery in demand.
The seasonally adjusted Japan Services Business Activity Index dipped from 53.0 in November to 52.1 in December to indicate a moderate expansion in business activity. Despite the slight easing in the growth rate, the average reading over the final quarter was the strongest quarterly performance since the third quarter of 2019.
India
The health of the Indian manufacturing industry improved further in December, with the growth of new work and production remaining sharp despite losing momentum.
At 55.5 in December, the seasonally adjusted IHS Markit India Manufacturing Purchasing Managers’ Index pointed to a robust improvement in overall operating conditions that were elevated by historical standards. This was despite the headline figure slipping from November’s ten-month high of 57.6. Moreover, the latest quarterly reading was at 56.3, its highest since the final quarter of the fiscal year 2020/21.
Indian services companies continued to report growth in sales and business activity in December. Rates of expansion moderated but were nevertheless marked by historical standards. Despite falling from 58.1 in November to a three-month low of 55.5 in December, the seasonally adjusted India Services Business Activity Index was still consistent with a marked rate of economic expansion. The upturn was often associated with improving market conditions and accommodative demand.
Canada
The concluding month of 2021 revealed another robust expansion in operating conditions in Canada’s manufacturing sector. Sustained increases in output, new orders, and employment were recorded as well as the fastest uptick in pre-production inventories for over 11 years of data collection.
The headline seasonally adjusted IHS Markit Canada Manufacturing Purchasing Managers’ Index registered at 56.5 in December, down from 57.2 in November. Growth has been seen in each month since July 2020, but the latest expansion was the weakest for five months.
Earnings
I’m already starting to hear the noise about how corporate buybacks will decline next year inferring trouble for the market. While there may be issues that are headwinds in ’22, share repurchases aren’t one of them. The notion that share buybacks are manipulating the stock market is nonsense.
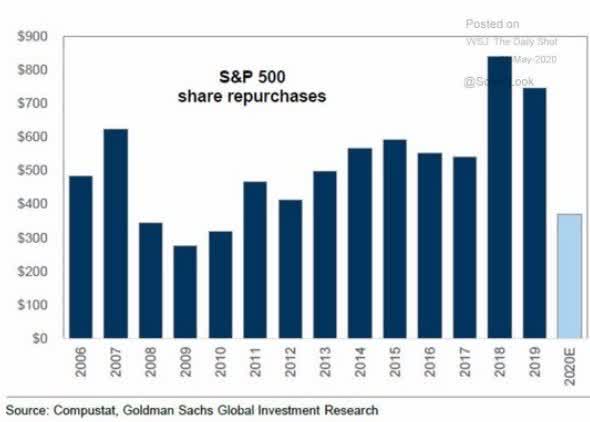
The S&P rose a scant 4% in 2007, had one of its best years in 2009 (+23%), and fell 1% in 2015 and 6% in 2018 (highest buyback total in history). There’s more to share prices than corporate repurchases.
Higher revenues and margins have accounted for 95% of profit growth in the past 20 yrs. ‘Financial engineering’ is only a tiny part of the earnings picture.
Food For Thought
Bank of America reports the cost of reaching zero net emissions will cost $150 Trillion to achieve. Perhaps it is time to stop chasing dreams and concentrate on a viable common-sense plan and put this entire political issue into perspective. 690 million people are undernourished in the world, looking for their next meal, and could care less what a climate that has been changing for centuries is supposed to do to mankind. (The average global temperature has risen 1.4 degrees since 1880.)
If nothing else the $5 trillion for the next 30 years will surely keep inflation around for a while, and that in turn will destroy the economies that are trying to feed the undernourished today. The sad part, these goals have little to no chance of being met. In the meantime, people will starve.
Global economies simply can’t afford that price tag without major economic repercussions.
The Daily chart of the S&P 500 (SPY)
New highs for the S&P 500 on Monday, followed by a quick test of support levels on Friday. The much-anticipated volatility that will be driven by “headlines” arrived earlier than expected.
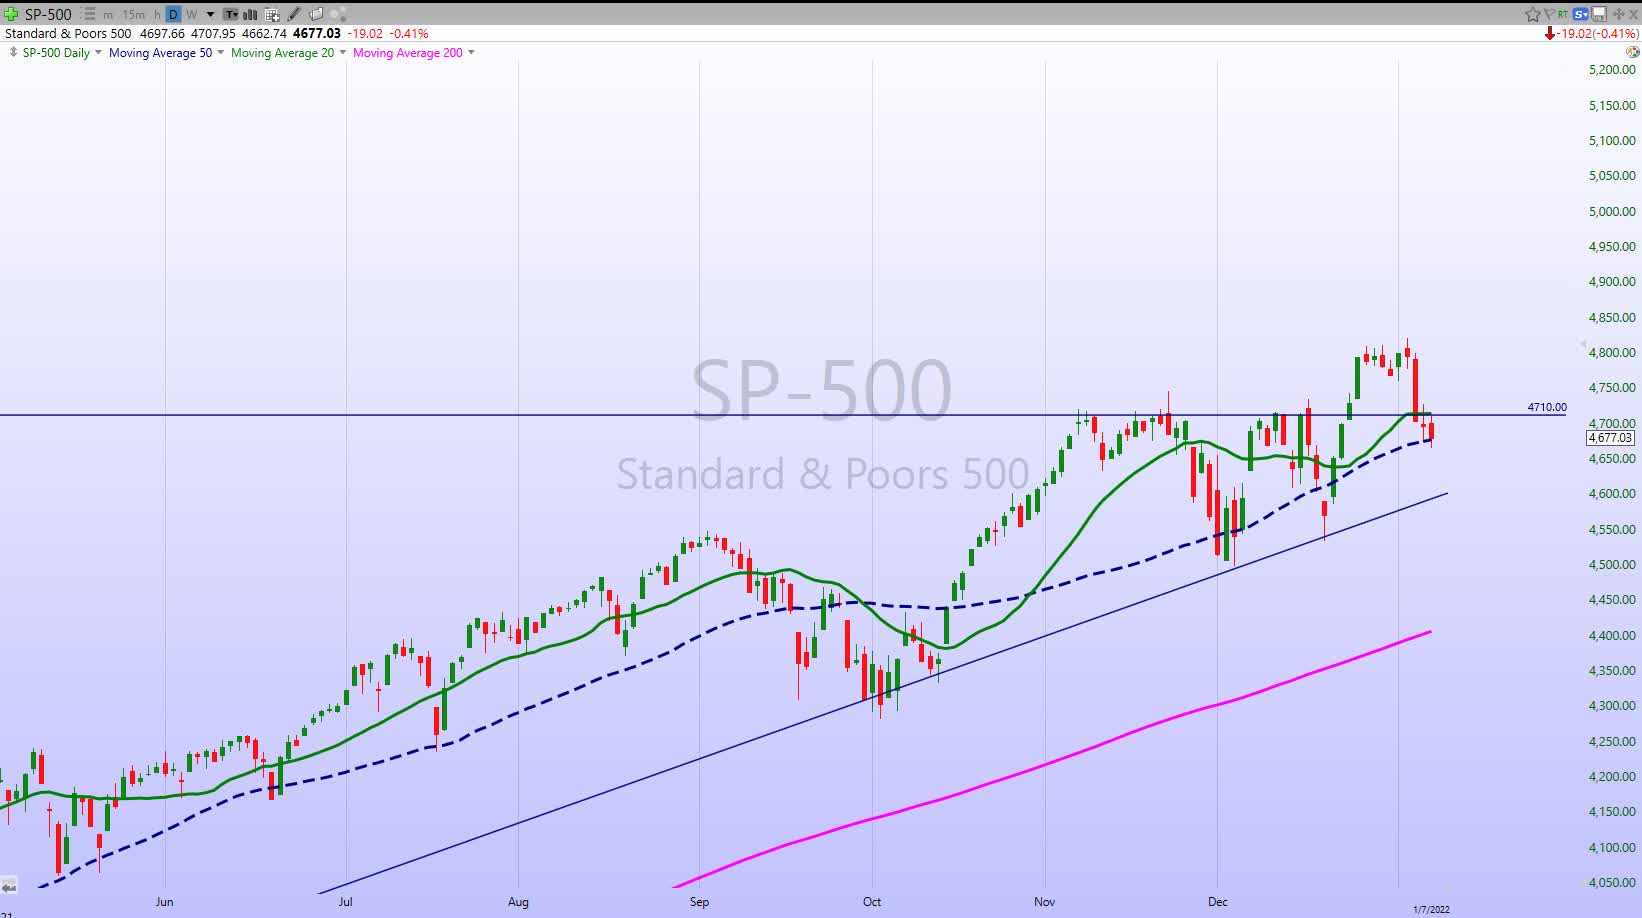
With this week’s price action, the short-term looks murky, but that can be said more times than not. We have seen a stair-step pattern higher with all of the intermediate/longer-term trend lines remaining in a positive uptrend.
The two major indices, DJIA and the S&P, remain resilient but there is plenty of damage that has occurred under the surface. 2022 starts with a bifurcated market scene and the gap is widening between the “haves” and “have nots”.
The 2022 Playbook Is Full Of Opportunities
There is a new generation of investors who increasingly know nothing about slumping markets, never mind a LONG drawn-out BEAR market (I’m not predicting one). While most of us still have vivid memories of the financial crisis, and others also remember the dot-com bust, just about every 30-year old out there have never experienced a bear market since they graduated from college. The newbies to the investing scene have never experienced a “down” market. One has to wonder how they will handle that and if it will have ramifications on how the market behaves once in a true downtrend. Perhaps it will be this group that will have a say in how the equity market behaves. Just another factor to be added to the ALGO trading and the proliferation of ETFs that exacerbate market moves.
The Bifurcated Stock Market
The “themes” for 2022 are on display in the first full week of trading. The move into cyclicals, (financials, energy, industrials) was apparent as HIGH PE growth stocks were sold off. For example, XOP, the Oil & Gas E&P ETF, is up around 9+% in the first week of ’22 while the NASDAQ-100 and many Growth areas were sold off hard. The Vanguard Small-Cap Value ETF (VBR) was up 1+%, while the Vanguard Small-Cap Growth ETF (VBK) was down 1+%. The Energy Sector (XLE) is up 9%, while Financials (XLF) has rallied 3.8%. That tells the story of how and where institutions are setting themselves up for ’22.
I never underestimate what emotion can do to stock prices, but some of these moves (up and down) are amazing. What once occurred in a month occurs in a day. When momentum gets rolling in either direction it usually winds up being overdone in the short term. I see no need to step in front of this train. My ’22 HIGH conviction stock selections had a strong lean to value, and the other names I’m looking at for ’22 should round out that list nicely. There will be plenty of time at a later date to pick up the pieces on the tech trade.
A week does not make a trend but it sure appears institutional money is taking the “cyclical/value trade seriously. In addition, the “bounce” that so many were waiting for after “tax selling” has not arrived for the HIGH PE stocks. Mr. Market has fooled us again. Maybe it has a lot to do with rates shooting higher, with the benchmark 10-Year U.S. Treasury moving from the low 1.50s to the low 1.70s in a week.
Rate expectations are all over the place but with inflation readings where they are, it seems like rates are almost going to have to go higher, even if inflation moderates some (that’s questionable). That could put even more pressure on the Growth areas in the short run. Investors are working with the premise that earnings are less valuable as rates rise. And rates are rising to fight inflation and they could wind up going higher as the economy slows.
Growth vs. Value
In case you haven’t received the market’s message over the past several weeks, groups such as Energy, Industrials, Financials, Materials, Commodities, Real Estate, etc. rather than the high growth, low-to-no earnings stocks have taken over the leadership role. That is a reversal away from the areas that have mostly led the way in recent years.
So even a simple reversion to the mean in the general market is another reason to ponder the merits of “Value” now. The forward P/E ratio of Value vs Growth is well below the 20- year average and touching new lows as we enter 2022. In other words, Value has never been cheaper relative to Growth since 2000. From a technical standpoint, the MSCI Value Factor ETF (VLUE) has broken out of a consolidation period, adding another sign of an impending uptrend.
Yet, even among these favored groups, there can be some disparity across various stocks so an investor will still have to do some digging to uncover true value and low risk/high reward opportunities.
Small Caps
Another frustrating week for this group. After coming off the mat in mid-December after what many feared was a complete breakdown, IWM rallied right to resistance and fell apart again. The Fed headwinds have come early and it appears yet another test of long-standing support looks to be in the cards.
Energy
The sector continues to reap huge rewards. The decision to stay with this group and add to positions during the weakness in mid-December has paid off. While many areas of the general market suffered, the Energy ETF vaulted to a new high this week.
Trying to predict where oil prices will be is next to impossible, but with WTI hitting $80 this week it is clear there is an uptrend in place. There will be pullbacks, but unless the fundamental “backdrop” in the U.S. changes (doubtful), they will be for buying.
Financials
This group also experienced some weakness in December when the 10-year Treasury dipped to 1.36% and it was the perfect time to add exposure. Many of the regional banks have simply taken off and broken above trading ranges that have been in place. The large center money banks as measured by XLF recorded a new all-time high this week.
Similar to Energy, pullbacks are for buying. Many if not all of these banks were making solid profits as the 10-year Treasury languished. They are lean and mean and the trend in rates is higher. These stocks represent “value” and they will follow.
Homebuilders
The sector sold off on Friday over fears of runaway interest rates hurting the housing market. The same thing occurred in 2018. An opportunity is about to be presented. I’m in the process of deciding which stocks I want to add more exposure to.
Technology
It’s a tale of two Technology sectors now. Old established large-cap tech with solid balance sheets and growing earnings versus the new speculative tech group with little earnings but loaded with potentials. The latter was sold off hard this week, and the former has been such a large outperformer for so long it too will have its moments of weakness as new leadership in the market is emerging. This sector is truly a stock pickers paradise. Not every small speculative growth stock is a throwaway. Large-cap tech stocks are prime candidates to enter a long sideways pattern, but there will be a few that continue to shine.
Semiconductors
Despite the fact that many of the semiconductor stocks do not fall into the HIGHLY speculative, little to no earnings category, this group was also sold this week. The SOXX and its components have been leaders for so long, it may now be set up for its first correction since mid-2021 if critical support levels do not hold. This is a pause that is well overdue.
ARK Innovation ETF (ARKK)
The speculative Innovation ETF (ARKK) issued a BEAR market warning signal in December. The breakdown continued this week. I’ve taken advantage of what could turn out to be a full-blown BEAR market by taking a position in the Short Innovation ETF (SARK). I am net short ARKK and will give this position plenty of time to play out. ARKK is volatile and there will be times to take profits along the way. Then press the downside on any bounce until the trend shows a meaningful turn.
Healthcare – Biotech/Pharma
An area of the market that I thought would have a reversion to the mean in ’22 and show gains was also trashed this past week. Once the Fed came back into the picture much earlier than anticipated that outlook has materially changed.
So it’s back to what represents “value” and pays dividends in the sub-sector called big-pharma.
Cryptocurrency
A couple of months ago I noted that Crypto-assets were anything but a “safe haven”, nor a store of value. This week’s action in the asset during a speculative stock selloff, confirms that view. BTC was hammered as it is also a speculative trading vehicle. It offers no dividend income, nor value, and it simply followed the other speculative assets that were thrown away. Crypto is down ~35% since its November peak. A garden variety selloff for this asset.
That doesn’t mean a market participant can’t make money in the asset. It simply means these assets contain great risk, like any other speculative asset.
Final Thoughts
What I have been writing about for weeks/months has entered the scene. My “policy error” commentary that some questioned has arrived. Unnecessary stimulus tossed at a solid economy has the ability to make the inflation problem very tough to handle. As predicted, the fear of persistent inflation has now brought the Fed into the picture much earlier than anticipated. Select areas of the stock market were NOT priced for that. What we will be witnessing is a re-pricing based on this “change”. That complicates the investment scene much quicker than originally thought.
A diversified portfolio is weathering this storm very nicely and that has been the message here since last year.
Postscript
Please allow me to take a moment and remind all of the readers of an important issue. I provide investment advice to clients and members of my marketplace service. Each week I strive to provide an investment backdrop that helps investors make their own decisions. In these types of forums, readers bring a host of situations and variables to the table when visiting these articles. Therefore it is impossible to pinpoint what may be right for each situation.
In different circumstances, I can determine each client’s situation/requirements and discuss issues with them when needed. That is impossible with readers of these articles. Therefore I will attempt to help form an opinion without crossing the line into specific advice. Please keep that in mind when forming your investment strategy.
THANKS to all of the readers that contribute to this forum to make these articles a better experience for everyone.
Best of Luck to Everyone!
Be the first to comment