

putilich
REIT Performance
REITs continued to recover in November yet still on average remain far below where they began the year, thus far averaging a -18.42% total return YTD. The REIT sector averaged a +3.33% return in November, which underperformed the NASDAQ (+4.5%), S&P 500 (+5.6%) and the Dow Jones Industrial Average (+6.0%). The market cap weighted Vanguard Real Estate ETF (VNQ) had a better total return than the average REIT in November (+6.15% vs. +3.33%), but remains deeper in the red YTD (-22.33% vs. -18.42%). The spread between the 2023 FFO multiples of large cap REITs (17.5x) and small cap REITs (12.1x) widened in November as multiples expanded by 1.1 turns for large caps and 0.8 turns for small caps. Investors currently need to pay an average of 44.6% more for each dollar of FFO from large cap REITs relative to small cap REITs. In this monthly publication, I will provide REIT data on numerous metrics to help readers identify which property types and individual securities currently offer the best opportunities to achieve their investment goals.
Source: Graph by Simon Bowler of 2nd Market Capital, Data compiled from S&P Global Market Intelligence LLC. See important notes and disclosures at the end of this article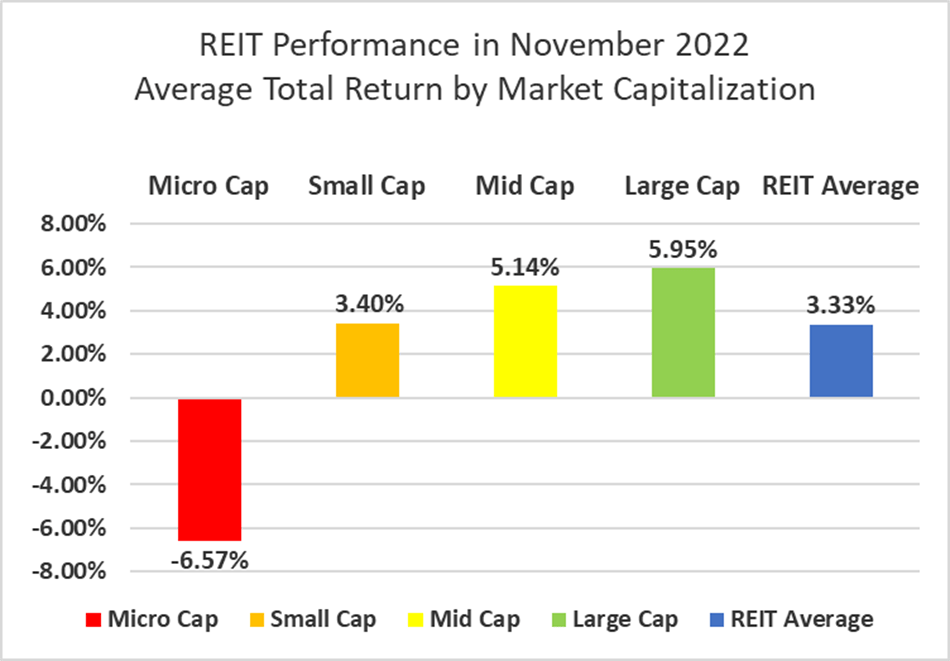
There was a strong correlation in November between total return and market cap. Large cap (+5.95%) and mid cap (+5.14%) REITs led, with small caps (+3.40%) also continuing to recover. Micro caps fared far worse, however, averaging a dismal -6.57%. Small cap REITs (-16.33%) are outperforming large caps (-18.06%) by 173 basis points on YTD 2022 total return.
Source: Graph by Simon Bowler of 2nd Market Capital, Data compiled from S&P Global Market Intelligence LLC. See important notes and disclosures at the end of this article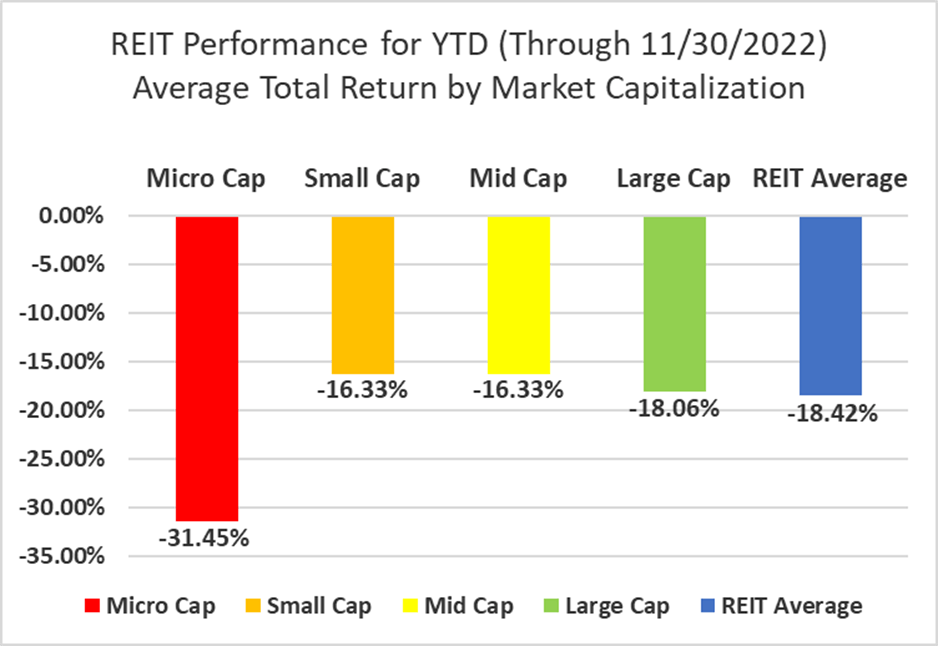
14 out of 18 Property Types Yielded Positive Total Returns in November
77.78% percent of REIT property types averaged a positive total return in November, with an 18.77% total return spread between the best and worst performing property types. Hotel (-4.38%), Self-Storage (-3.01%), Malls (-1.50%) and Land (-1.04%) were the only REIT property types in the red.
Data Center (+14.40%) and Infrastructure (+12.56%) significantly outpaced the REIT sector as a whole in November. The strong month for Data Centers was driven by the big earnings beat by massive data center REIT Equinix (EQIX) (+22.5%), which also included raised guidance.
Source: Table by Simon Bowler of 2nd Market Capital, Data compiled from S&P Global Market Intelligence LLC. See important notes and disclosures at the end of this article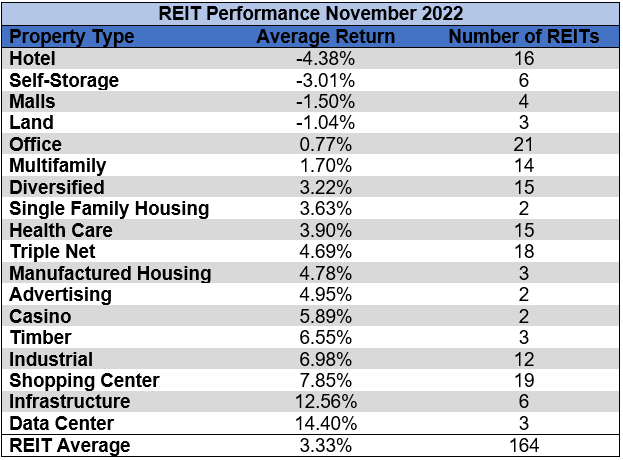
After the first eleven months of the year, Student Housing (+14.02%) and Casino (+11.44%) REITs remain the only property types in positive territory. The Student Housing gains came in the first 7 months of the year prior to the only Student Housing REIT being acquired. Office (-32.62%) is now the worst performing REIT property type year to date, followed by Malls (-32.03%) and Infrastructure (-31.96%).
Source: Table by Simon Bowler of 2nd Market Capital, Data compiled from S&P Global Market Intelligence LLC. See important notes and disclosures at the end of this article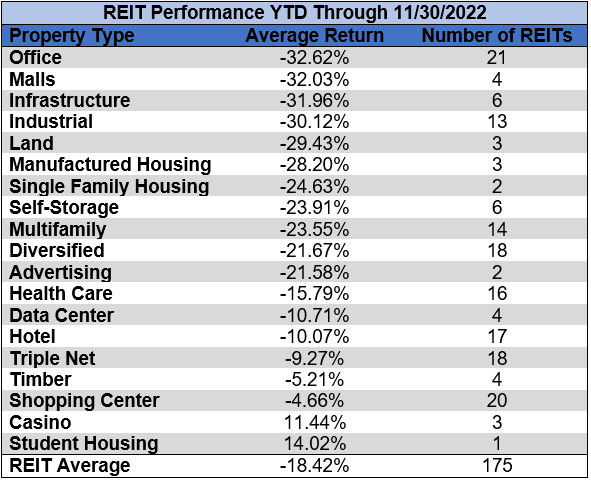
The REIT sector as a whole saw the average P/FFO (2023Y) increase 1.0 turns in November (from 12.6x up to 13.6x). The average FFO multiple expanded for 87.5% of property types and contracted for 12.5%. There are no recent 2023 FFO/share estimates for either of the Advertising REITs or any of the Timber REITs. Land REITs (27.0x) trade at the highest average multiple followed by Data Centers (21.9x), Industrial (20.2x) and Manufactured Housing (20.2x). Mall (5.7x), Office (8.2x) and Hotel (8.5x) REITs are the only property types currently trading at a single digit multiple.
Source: Table by Simon Bowler of 2nd Market Capital, Data compiled from S&P Global Market Intelligence LLC. See important notes and disclosures at the end of this article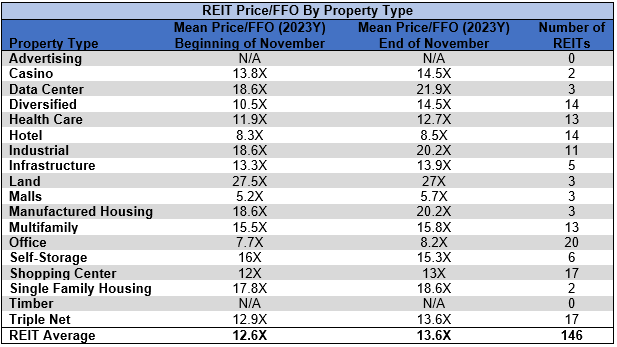
Performance of Individual Securities
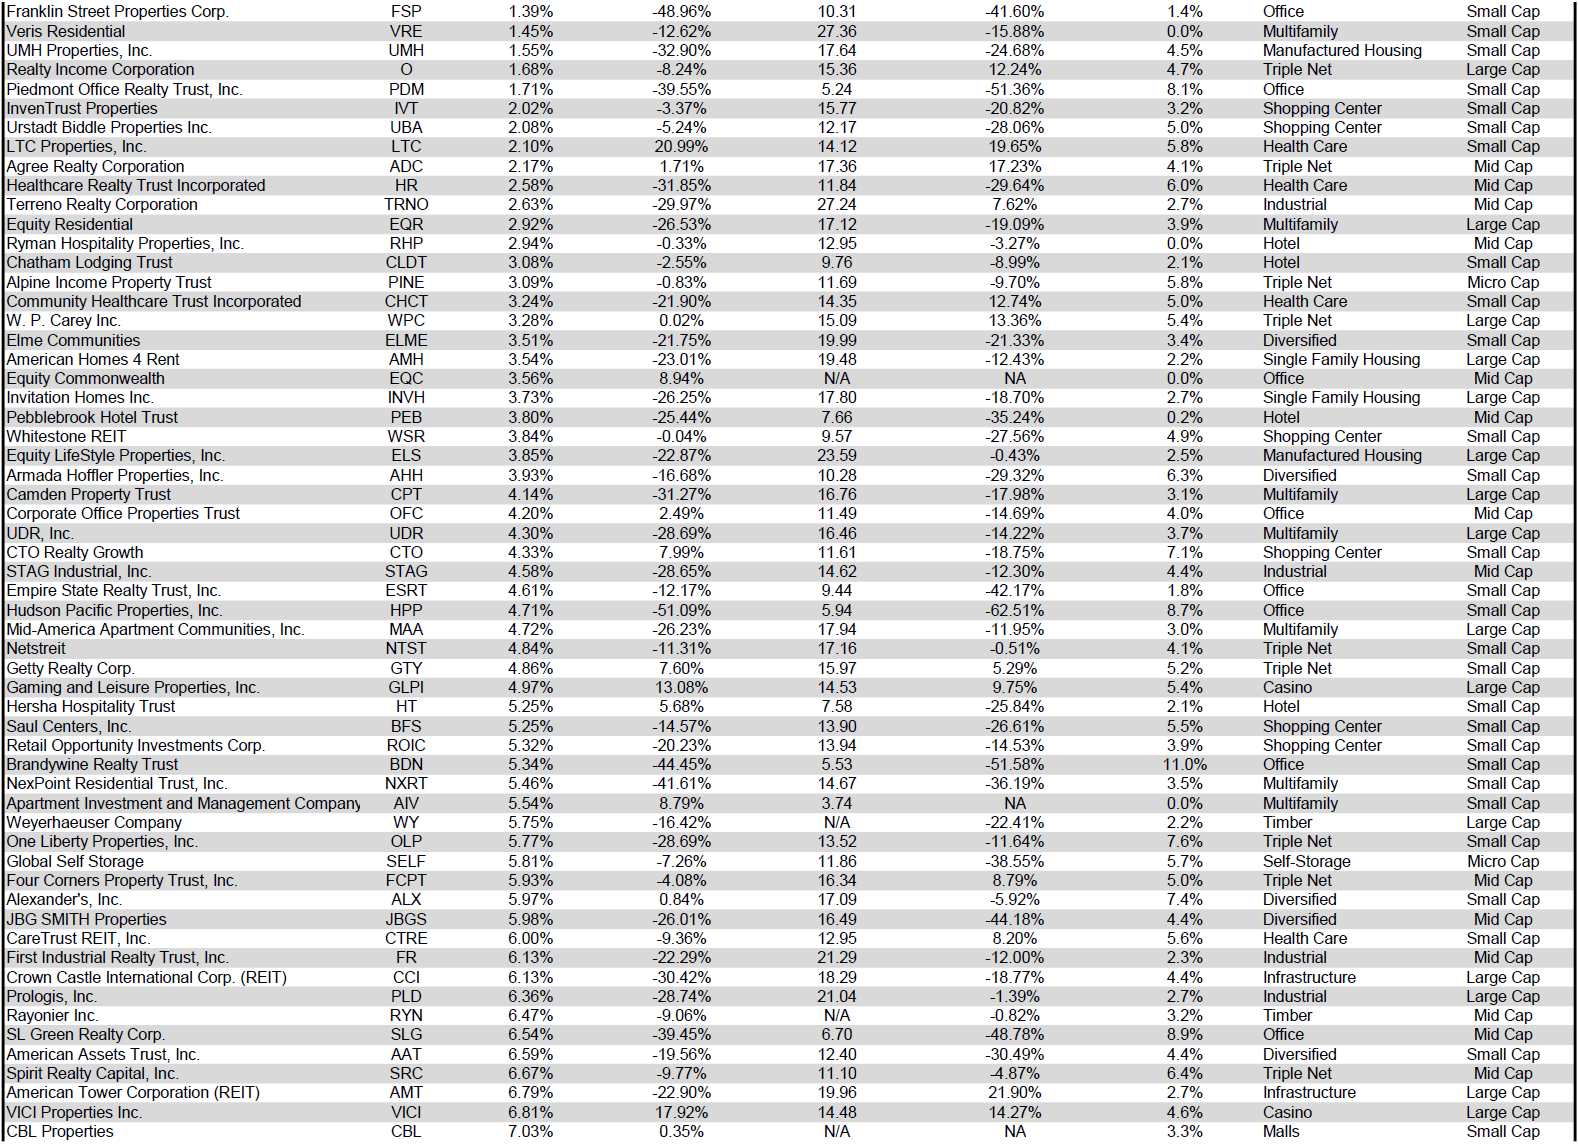
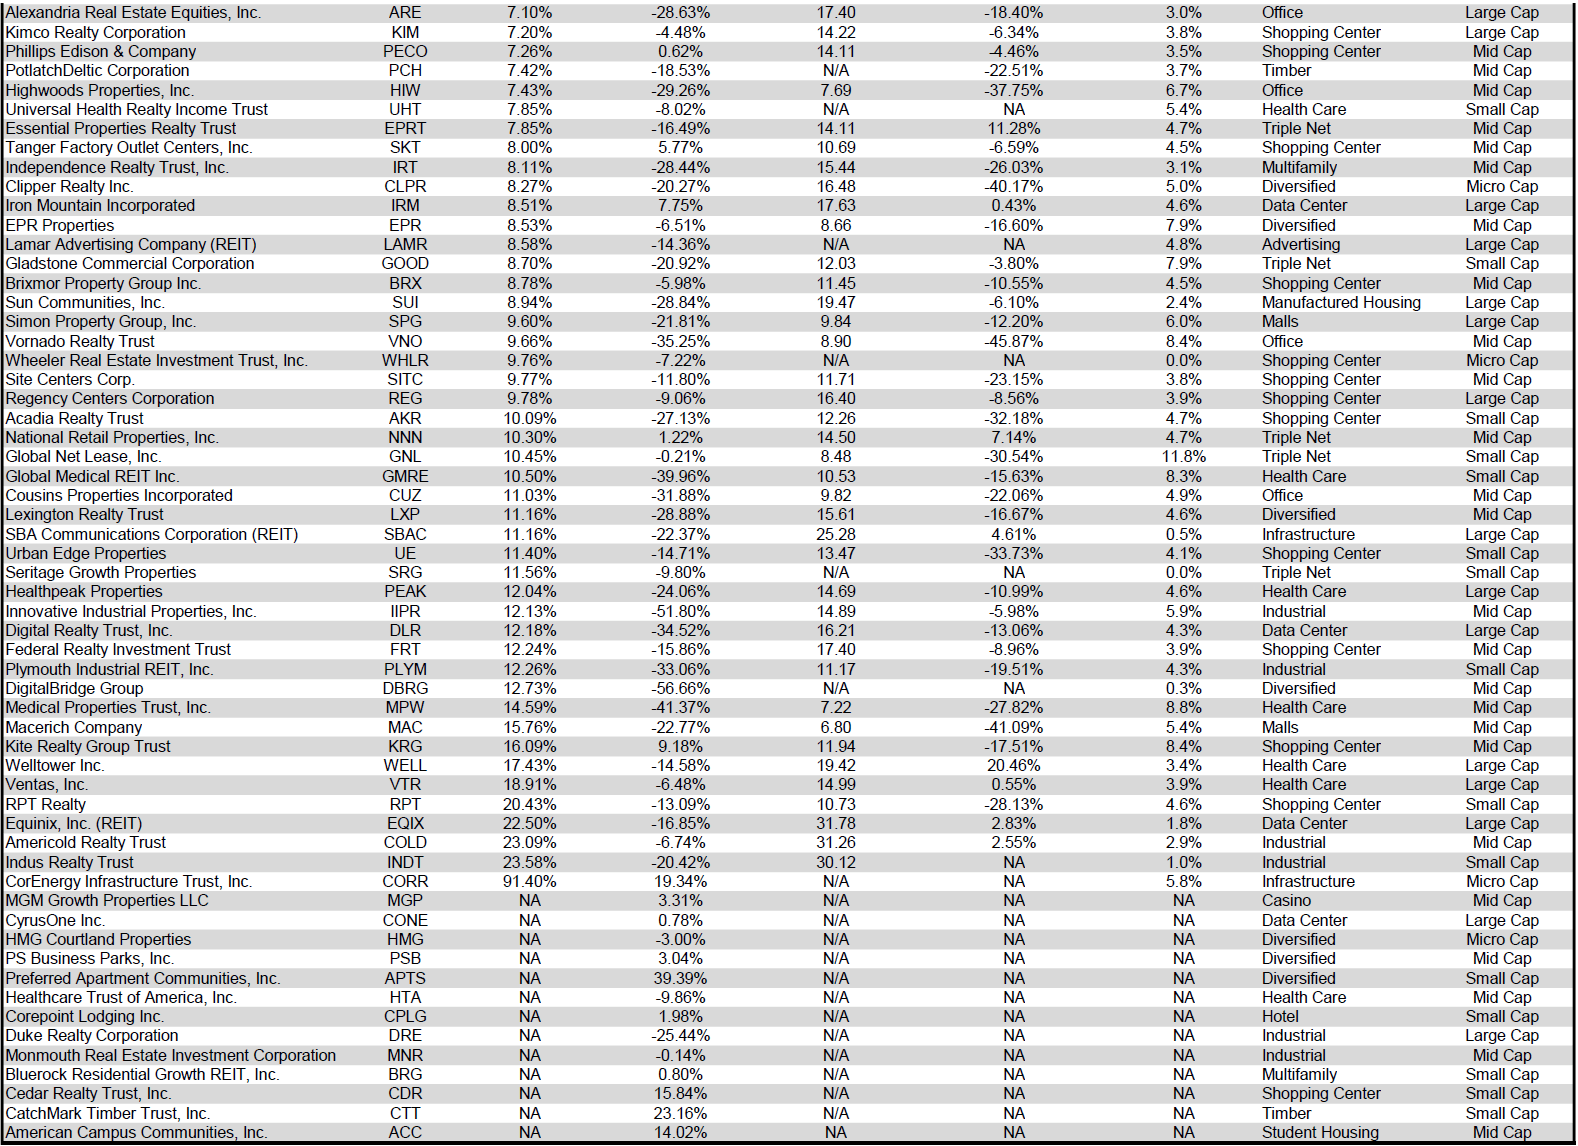
CorEnergy Infrastructure Trust (CORR) (+91.40%) did not cut or suspend their dividend and even posted a quarter over quarter increase in revenue in their Q3 earnings. The REIT is certainly still in a challenging position, but the magnitude of risk that investors have priced in has shifted post earnings.
Pennsylvania REIT (PEI) (-38.38%) was the only Mall REIT in the red in November as PREIT’s freefall continued, reaching a YTD total return of -83.89%. Despite some meaningful improvements year over year to core mall occupancy (94.4% up from 89.6%) and SS-NOI (+3.3%), PREIT has seen non-same store NOI decline due to asset sales. The largest concern, however, remains the extraordinary debt burden PREIT is facing. The Mall REIT is pursuing a strategy of asset sales to pay off debt, but the pace of sales remains slow and their ability to successfully execute on planned sales is heavily dependent on sufficient appetite for their non-core assets.
72.84% of REITs had a positive total return in November, but only 20.00% are in the black year to date. During the first eleven months of last year the average REIT had a +28.48% return, whereas this year the average REIT has seen a -18.42% total return.
Source: Table by Simon Bowler of 2nd Market Capital, Data compiled from S&P Global Market Intelligence LLC. See important notes and disclosures at the end of this article Source: Table by Simon Bowler of 2nd Market Capital, Data compiled from S&P Global Market Intelligence LLC. See important notes and disclosures at the end of this article Source: Table by Simon Bowler of 2nd Market Capital, Data compiled from S&P Global Market Intelligence LLC. See important notes and disclosures at the end of this article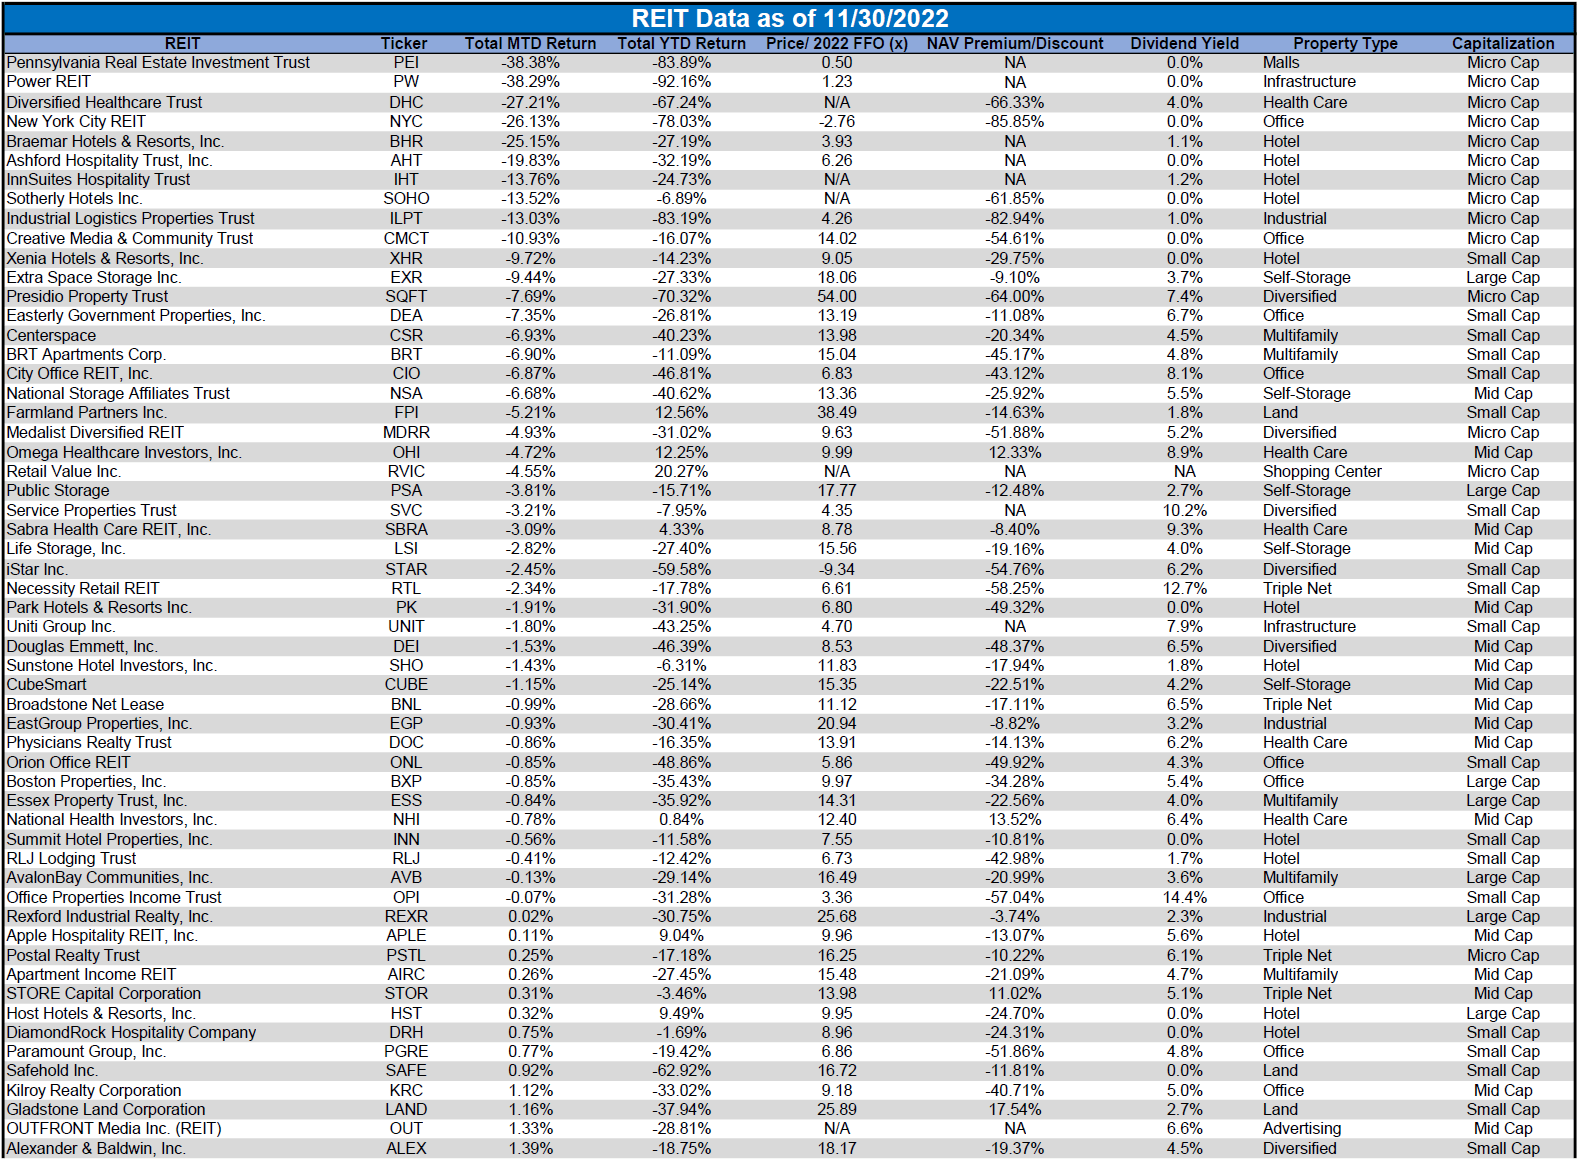
For the convenience of reading this table in a larger font, the table above is available as a PDF as well.
Dividend Yield
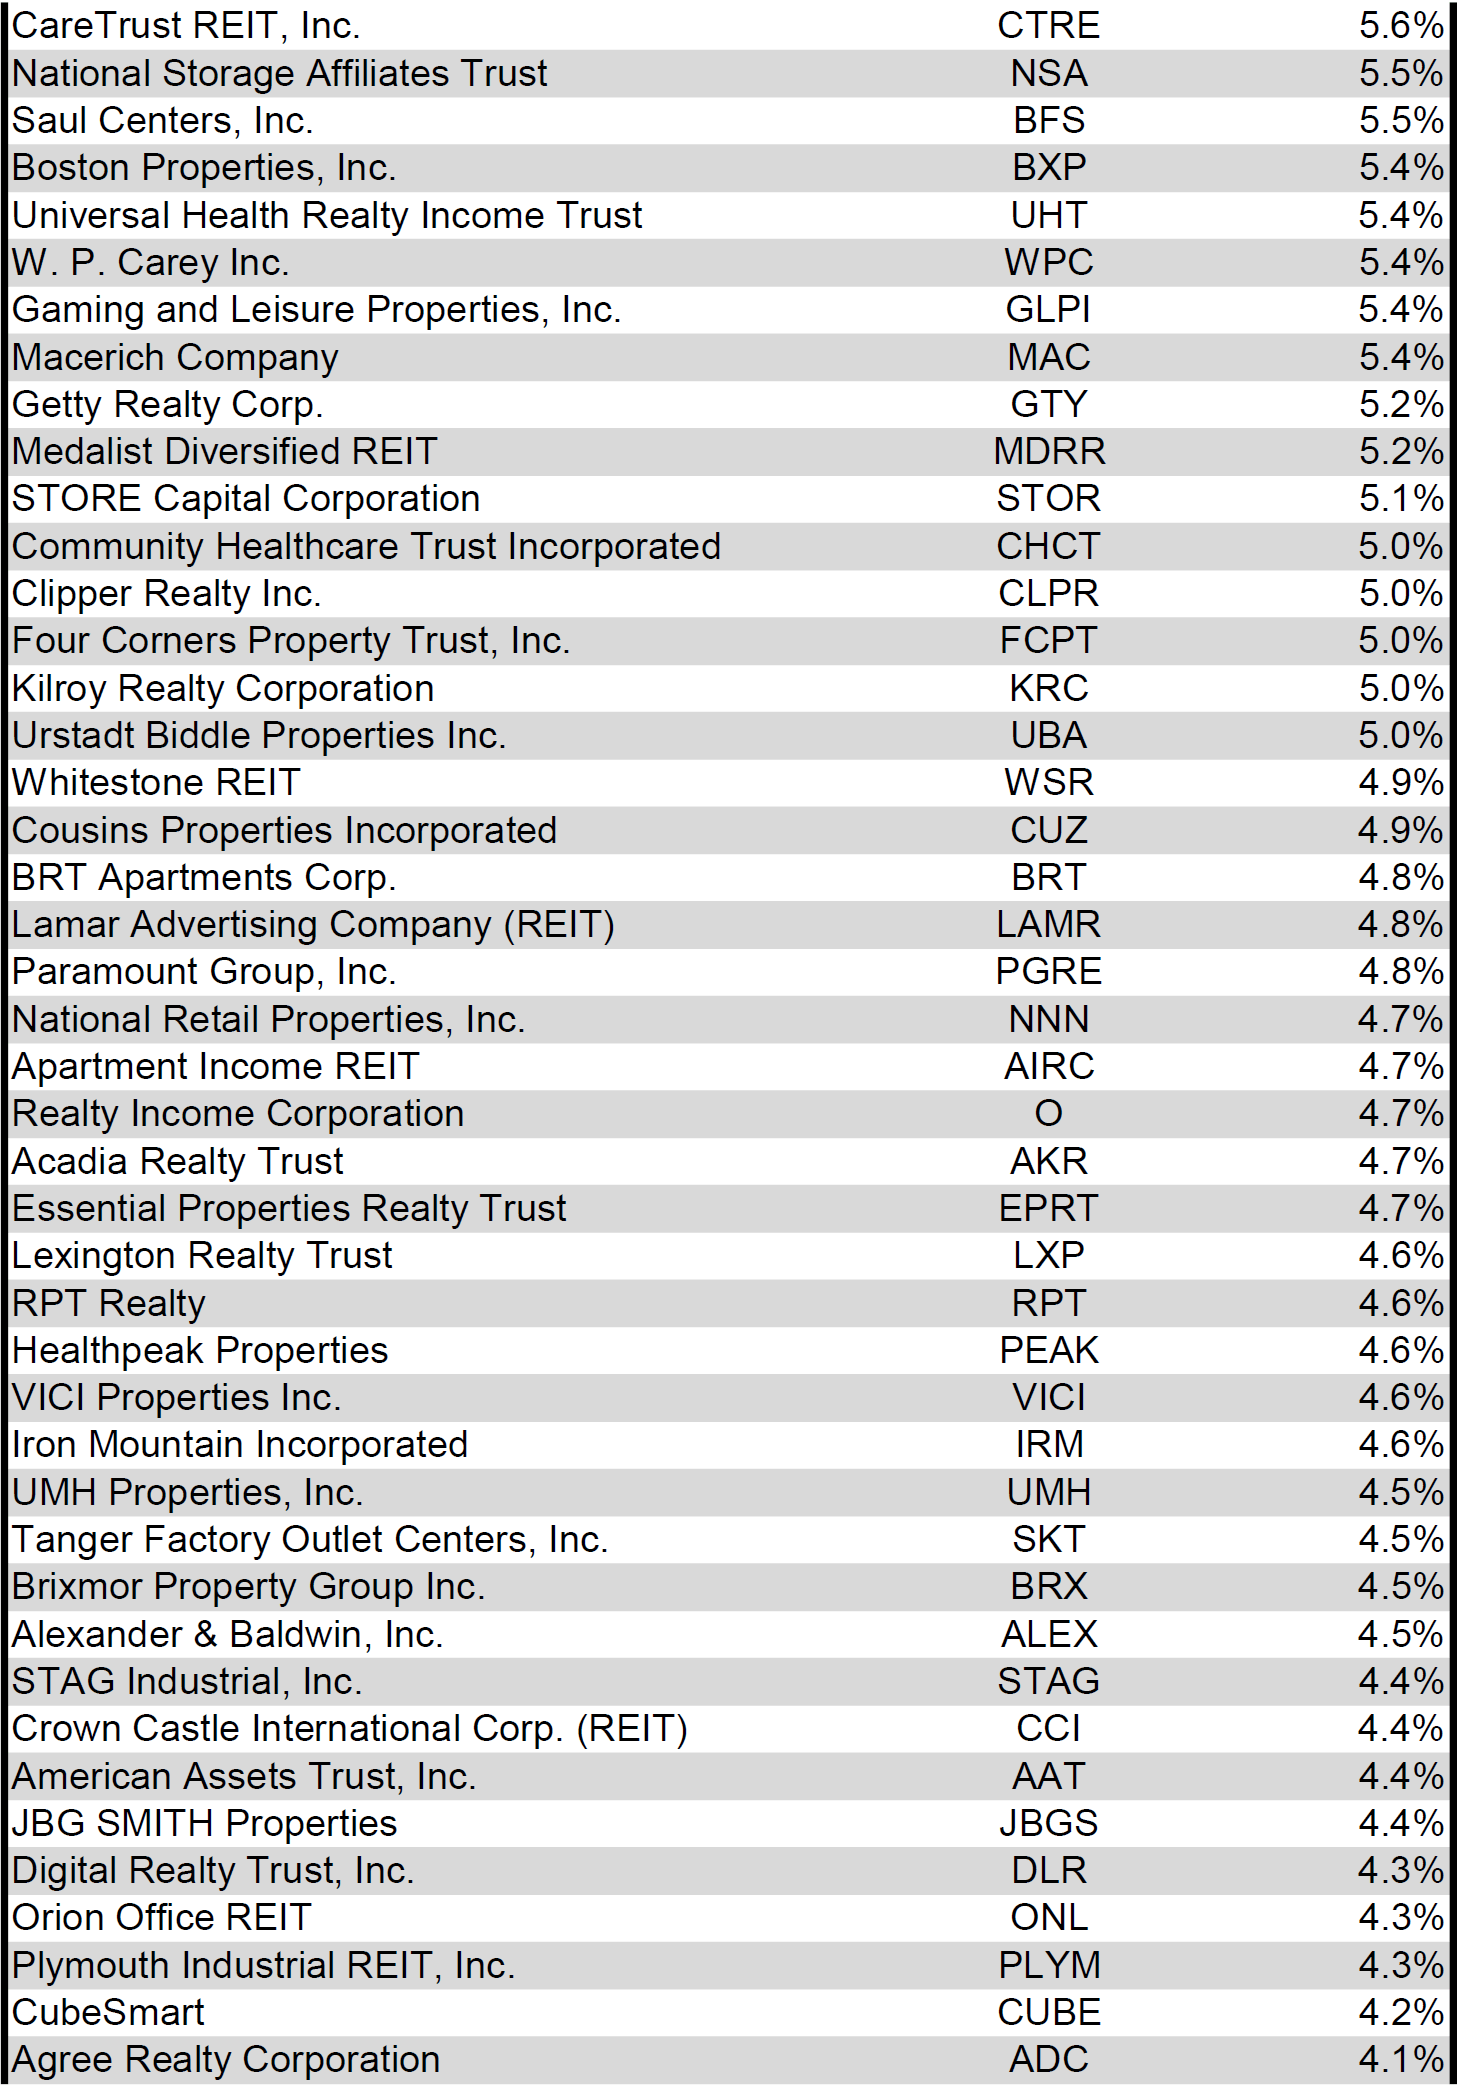
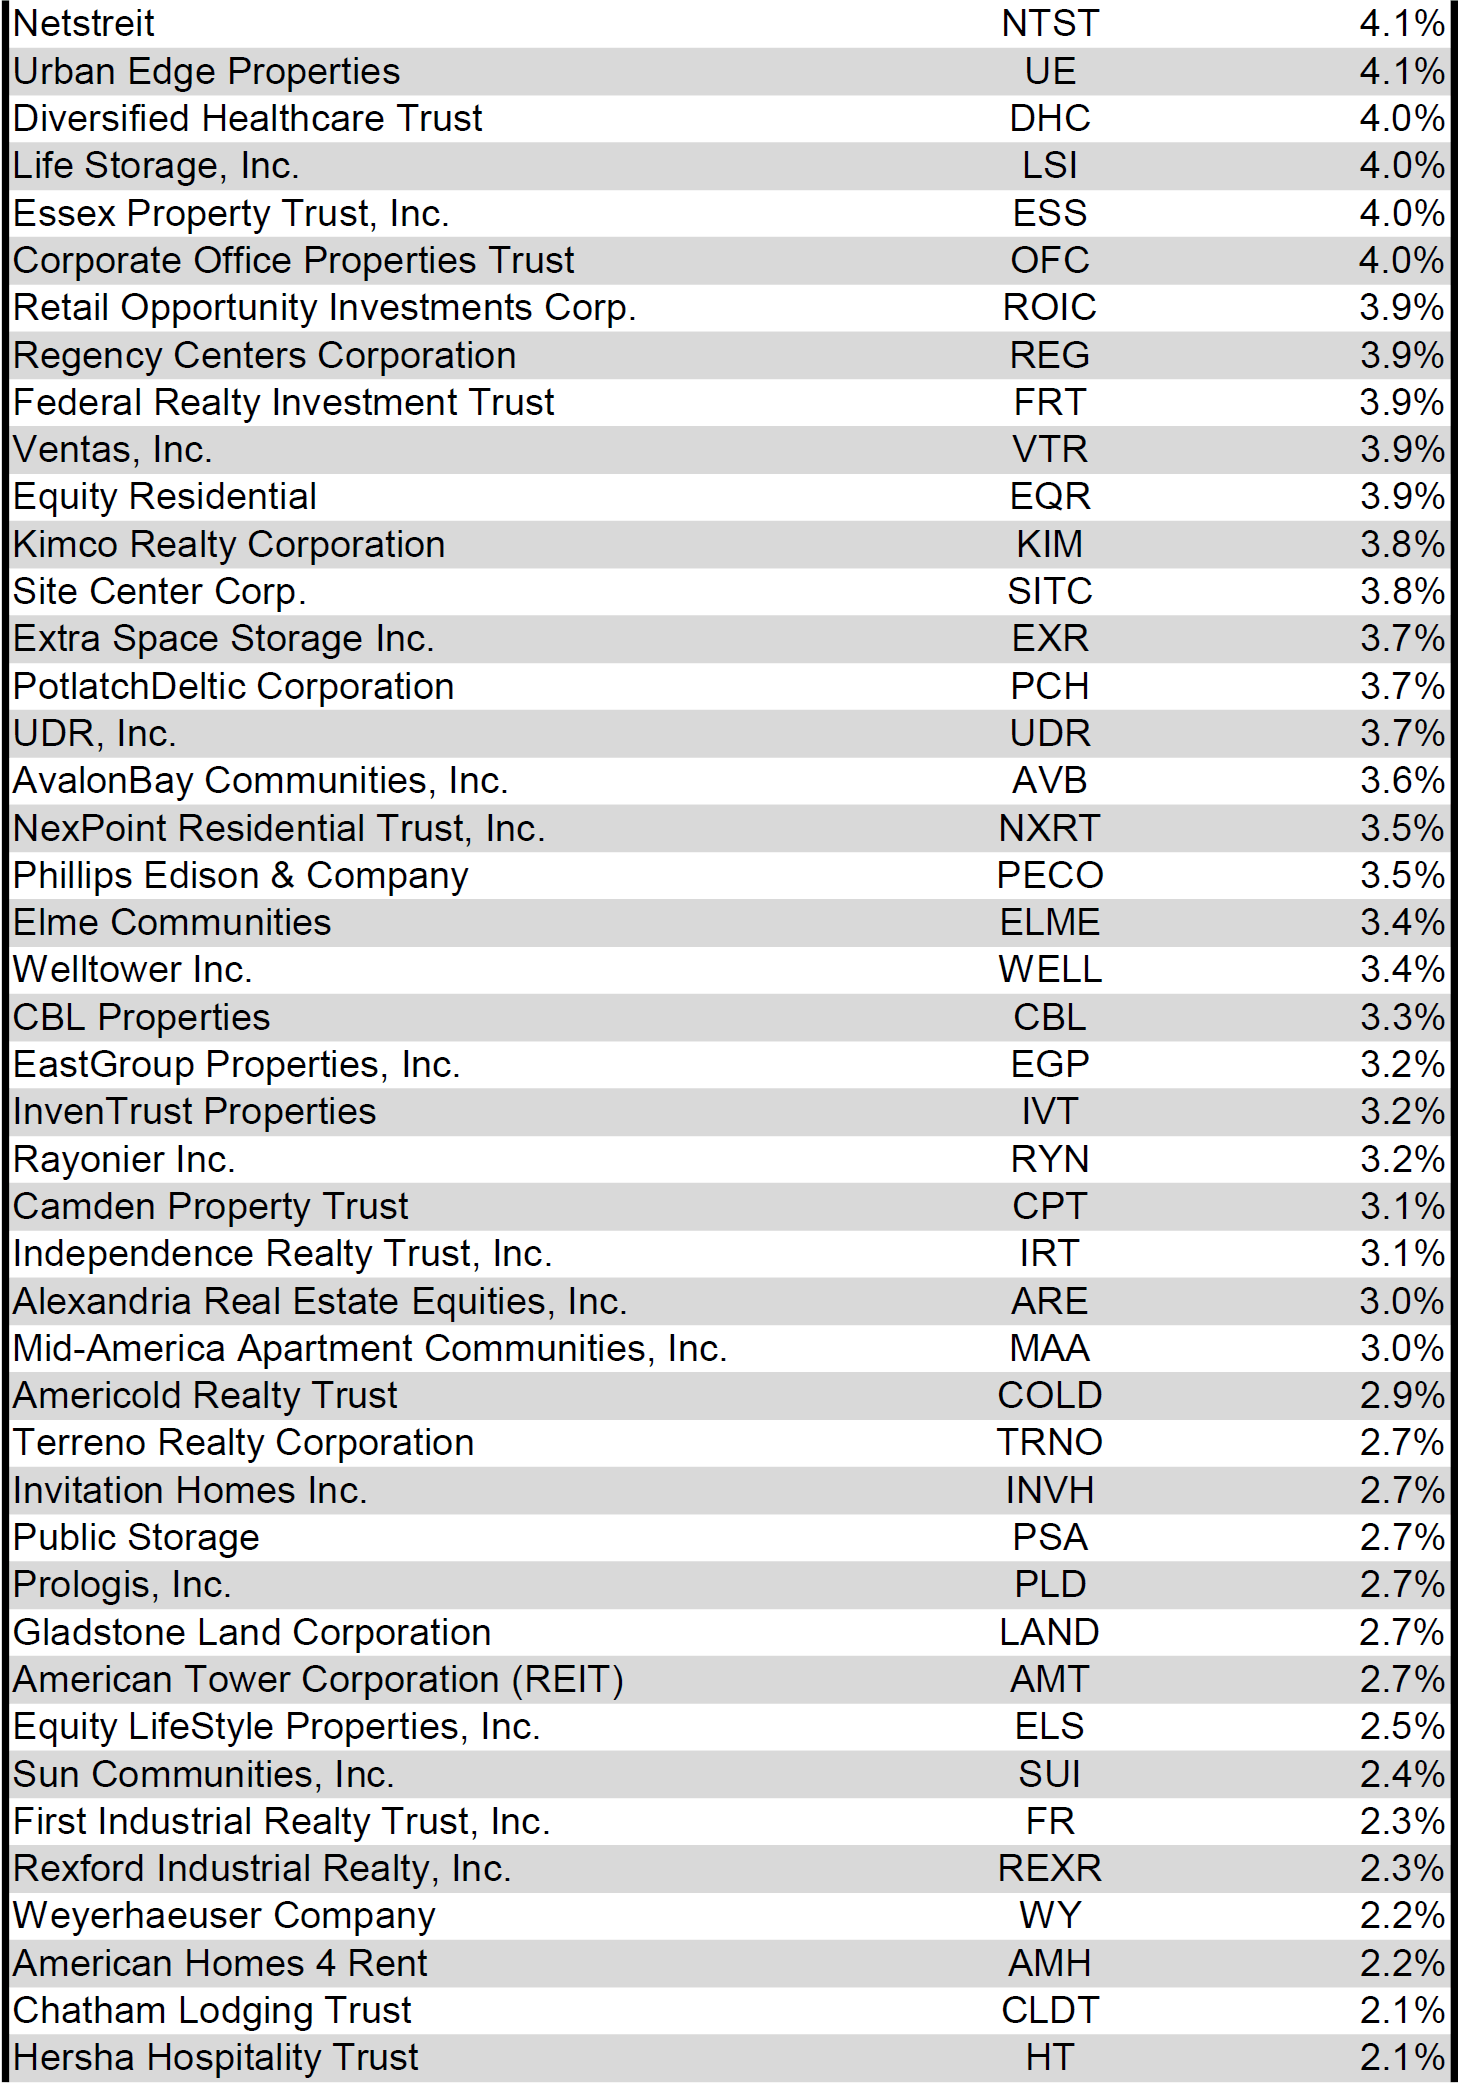
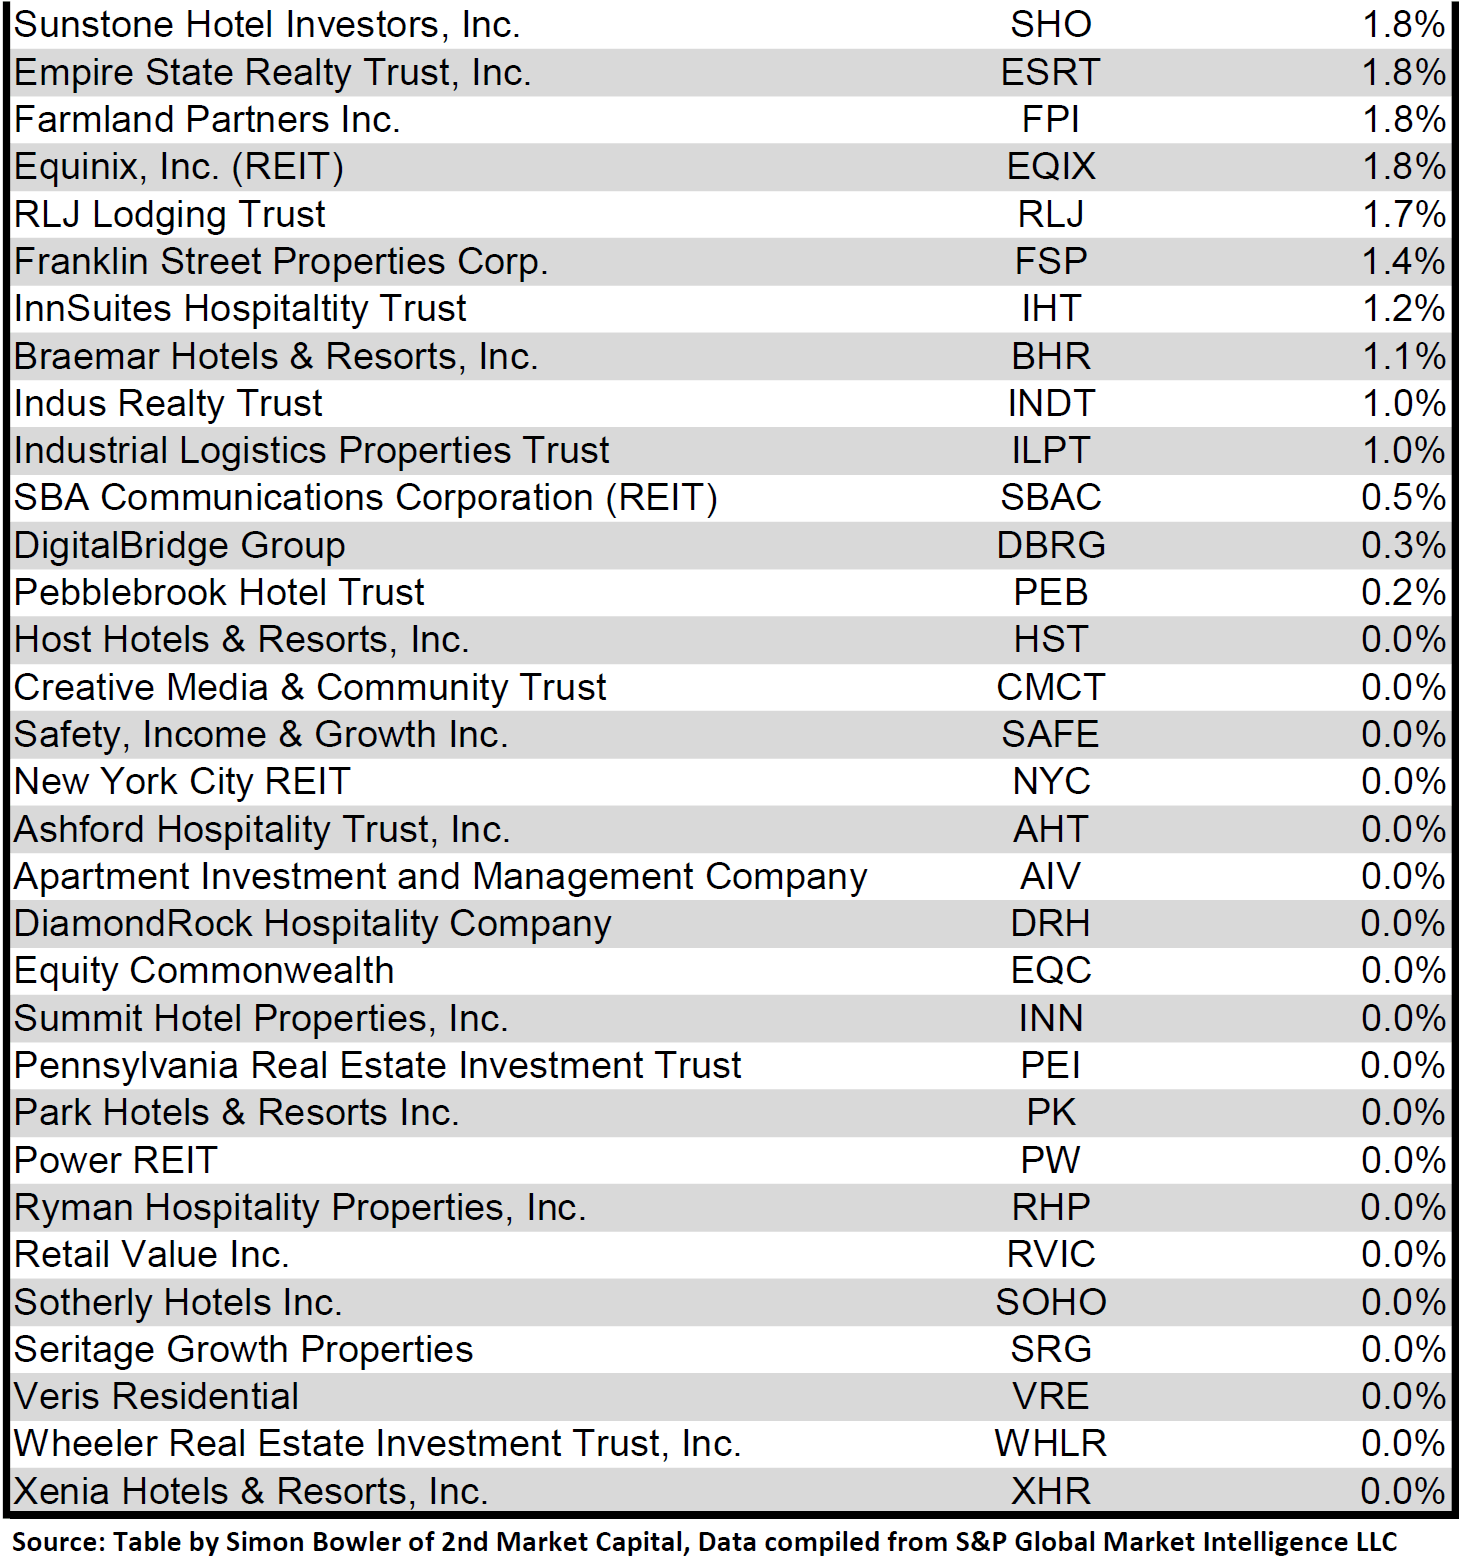
Dividend yield is an important component of a REIT’s total return. The particularly high dividend yields of the REIT sector are, for many investors, the primary reason for investment in this sector. As many REITs are currently trading at share prices well below their NAV, yields are currently quite high for many REITs within the sector. Although a particularly high yield for an REIT may sometimes reflect a disproportionately high risk, there exist opportunities in some cases to capitalize on dividend yields that are sufficiently attractive to justify the underlying risks of the investment. I have included below a table ranking equity REITs from highest dividend yield (as of 11/30/2022) to lowest dividend yield.
Source: Table by Simon Bowler of 2nd Market Capital, Data compiled from S&P Global Market Intelligence LLC. See important notes and disclosures at the end of this article Source: Table by Simon Bowler of 2nd Market Capital, Data compiled from S&P Global Market Intelligence LLC. See important notes and disclosures at the end of this article Source: Table by Simon Bowler of 2nd Market Capital, Data compiled from S&P Global Market Intelligence LLC. See important notes and disclosures at the end of this article Source: Table by Simon Bowler of 2nd Market Capital, Data compiled from S&P Global Market Intelligence LLC. See important notes and disclosures at the end of this article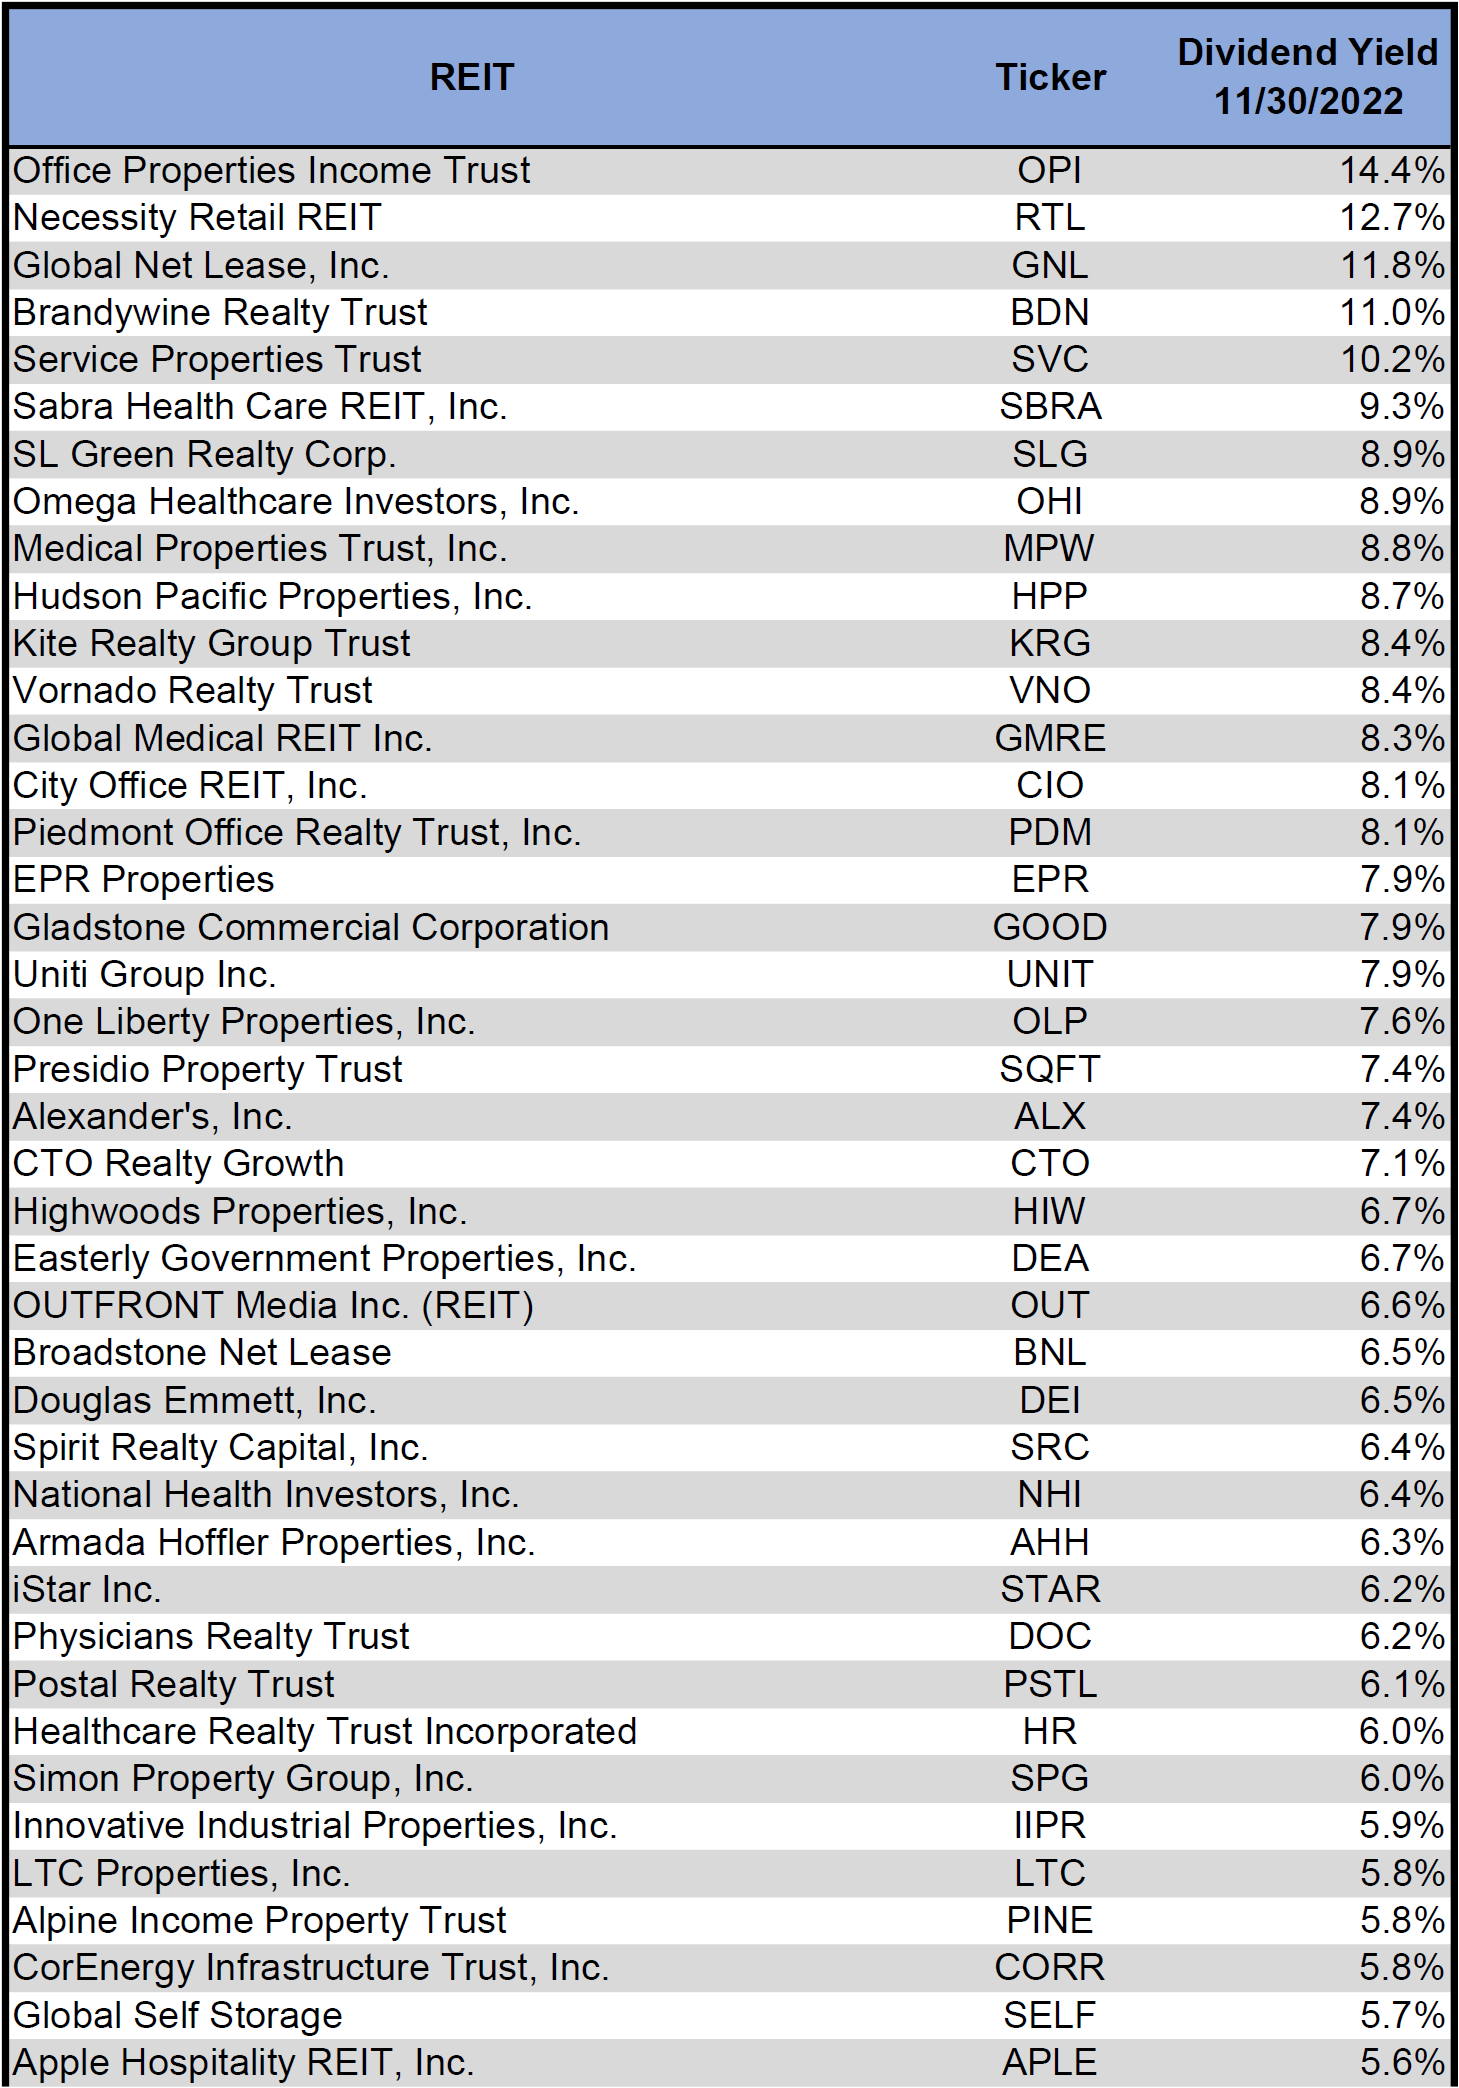
For the convenience of reading this table in a larger font, the table above is available as a PDF as well.
Although a REIT’s decision regarding whether to pay a quarterly dividend or a monthly dividend does not reflect on the quality of the company’s fundamentals or operations, a monthly dividend allows for a smoother cash flow to the investor. Below is a list of equity REITs that pay monthly dividends ranked from highest yield to lowest yield.
Source: Table by Simon Bowler of 2nd Market Capital, Data compiled from S&P Global Market Intelligence LLC. See important notes and disclosures at the end of this article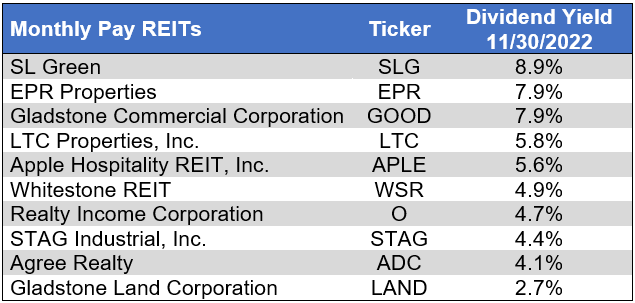
Valuation
REIT Premium/Discount to NAV by Property Type
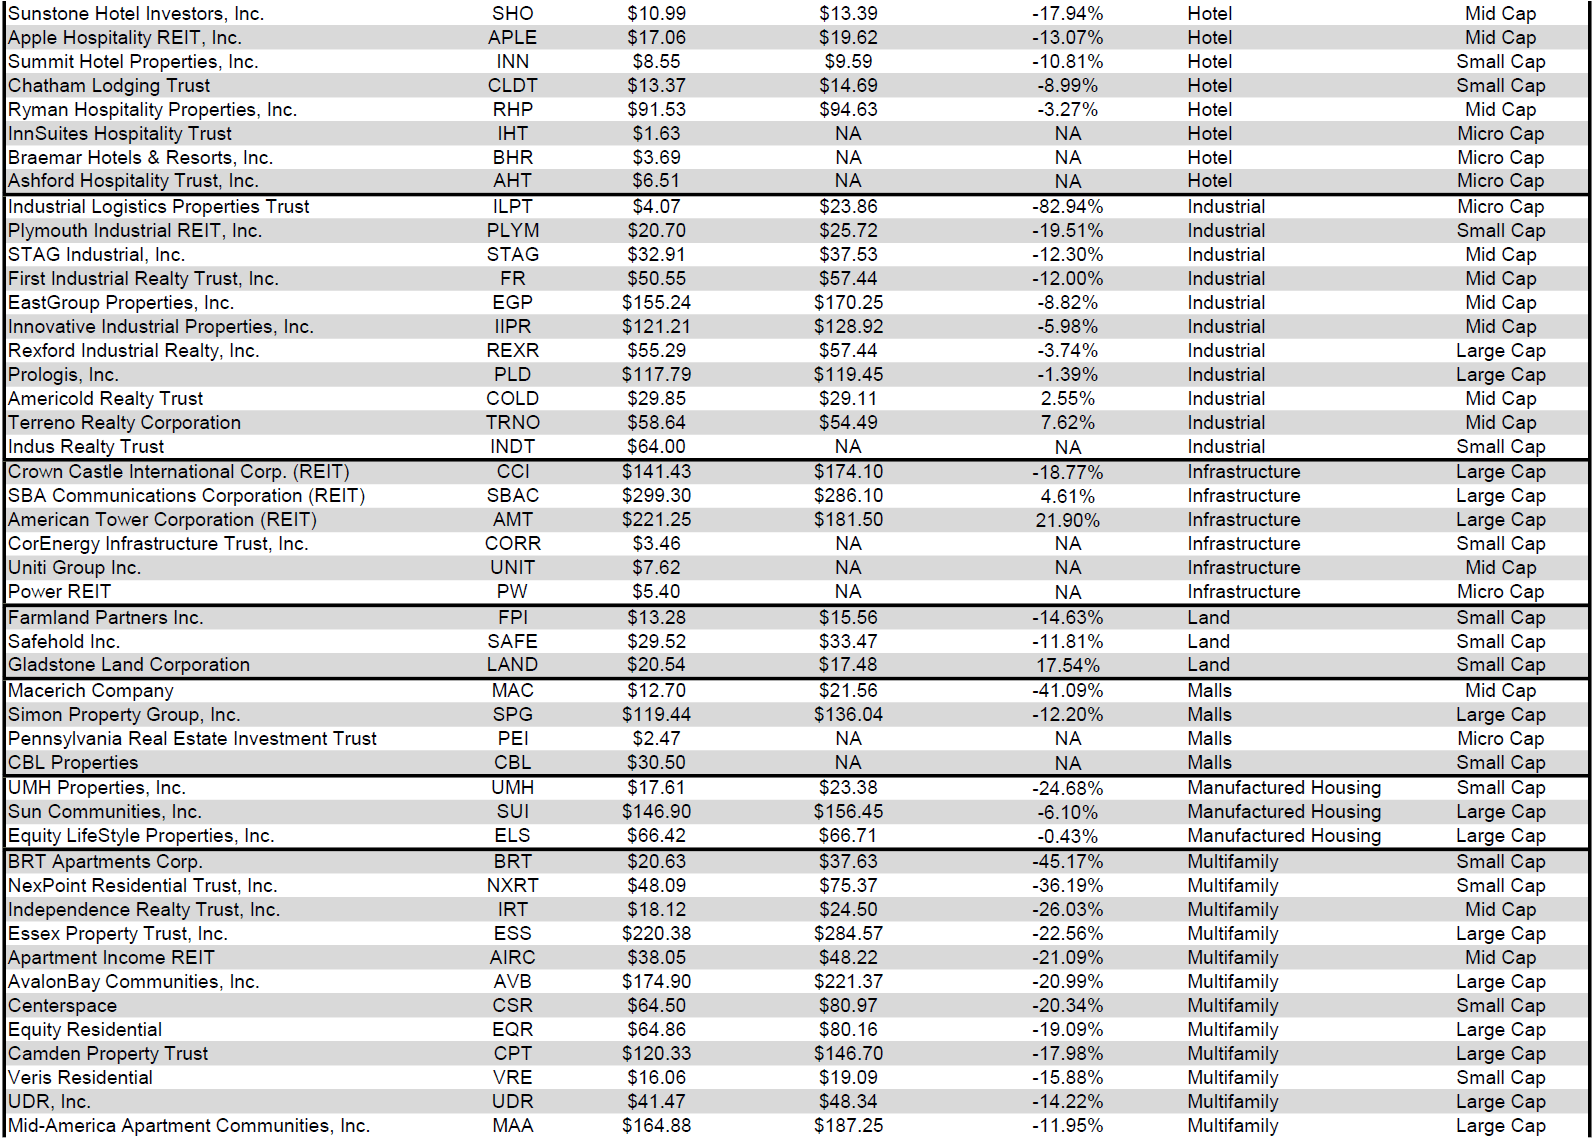
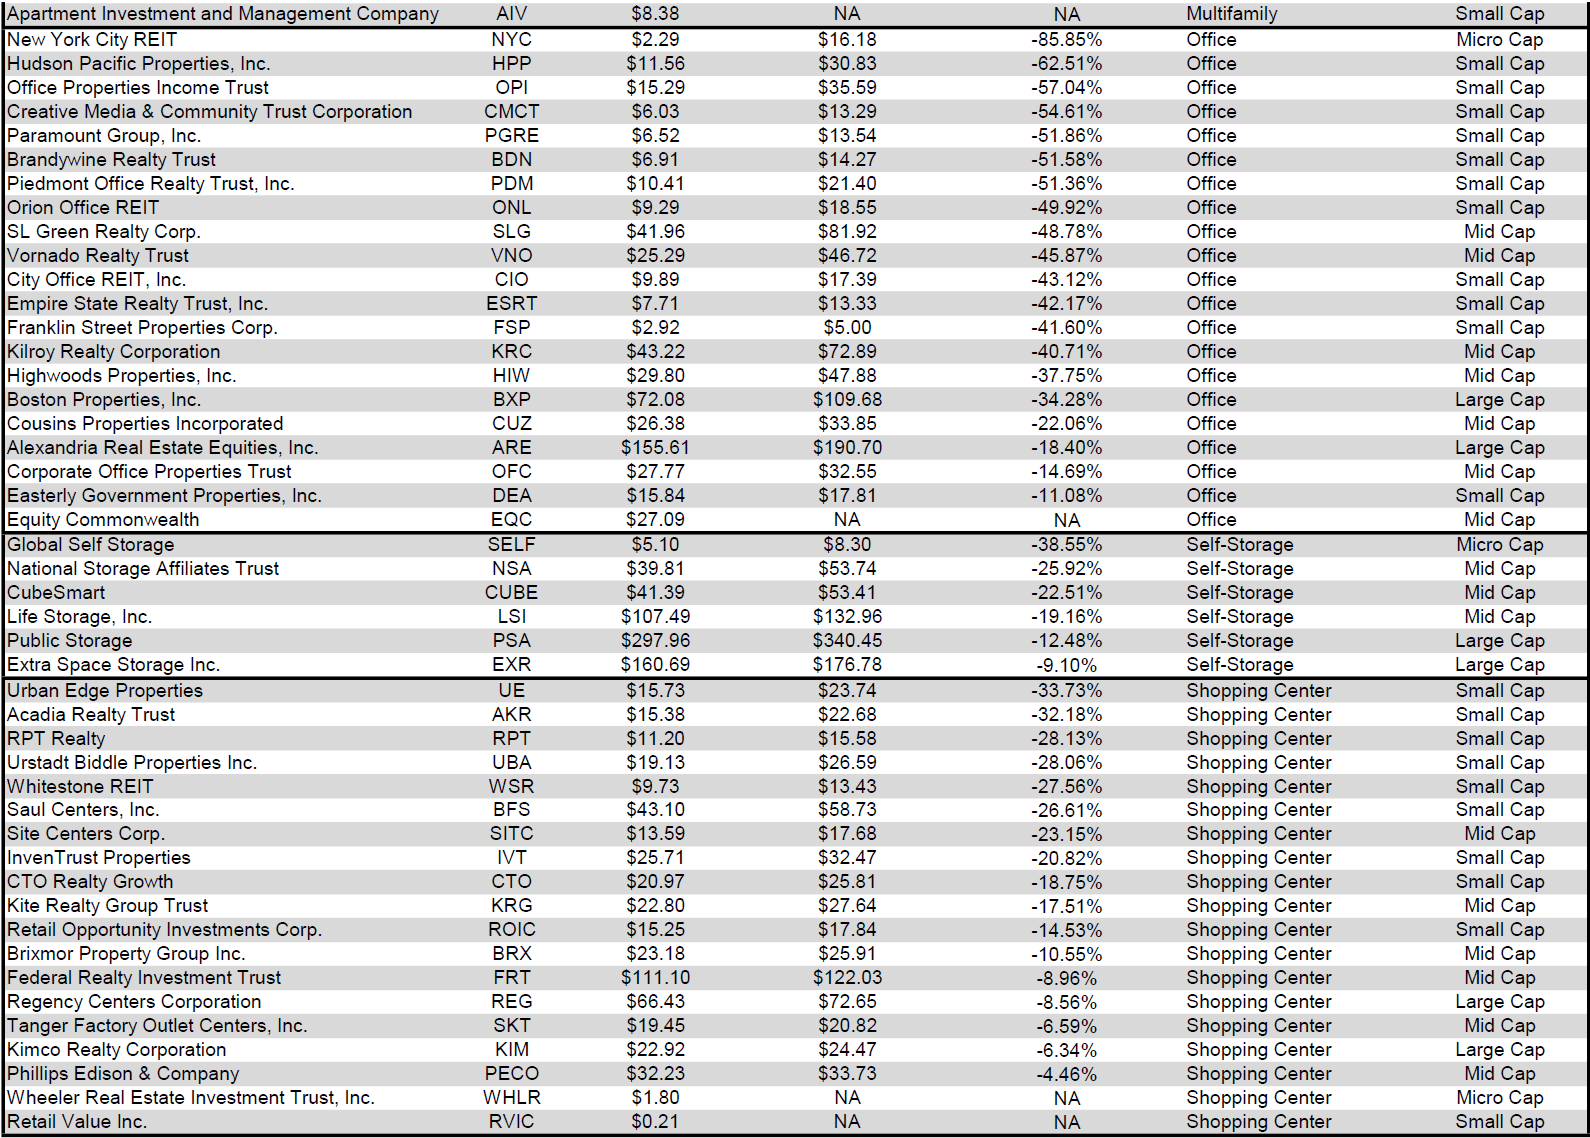
Below is a downloadable data table, which ranks REITs within each property type from the largest discount to the largest premium to NAV. The consensus NAV used for this table is the average of analyst NAV estimates for each REIT. Both the NAV and the share price will change over time, so I will continue to include this table in upcoming issues of The State of REITs with updated consensus NAV estimates for each REIT for which such an estimate is available.
Source: Table by Simon Bowler of 2nd Market Capital, Data compiled from S&P Global Market Intelligence LLC. See important notes and disclosures at the end of this article Source: Table by Simon Bowler of 2nd Market Capital, Data compiled from S&P Global Market Intelligence LLC. See important notes and disclosures at the end of this article Source: Table by Simon Bowler of 2nd Market Capital, Data compiled from S&P Global Market Intelligence LLC. See important notes and disclosures at the end of this article Source: Table by Simon Bowler of 2nd Market Capital, Data compiled from S&P Global Market Intelligence LLC. See important notes and disclosures at the end of this article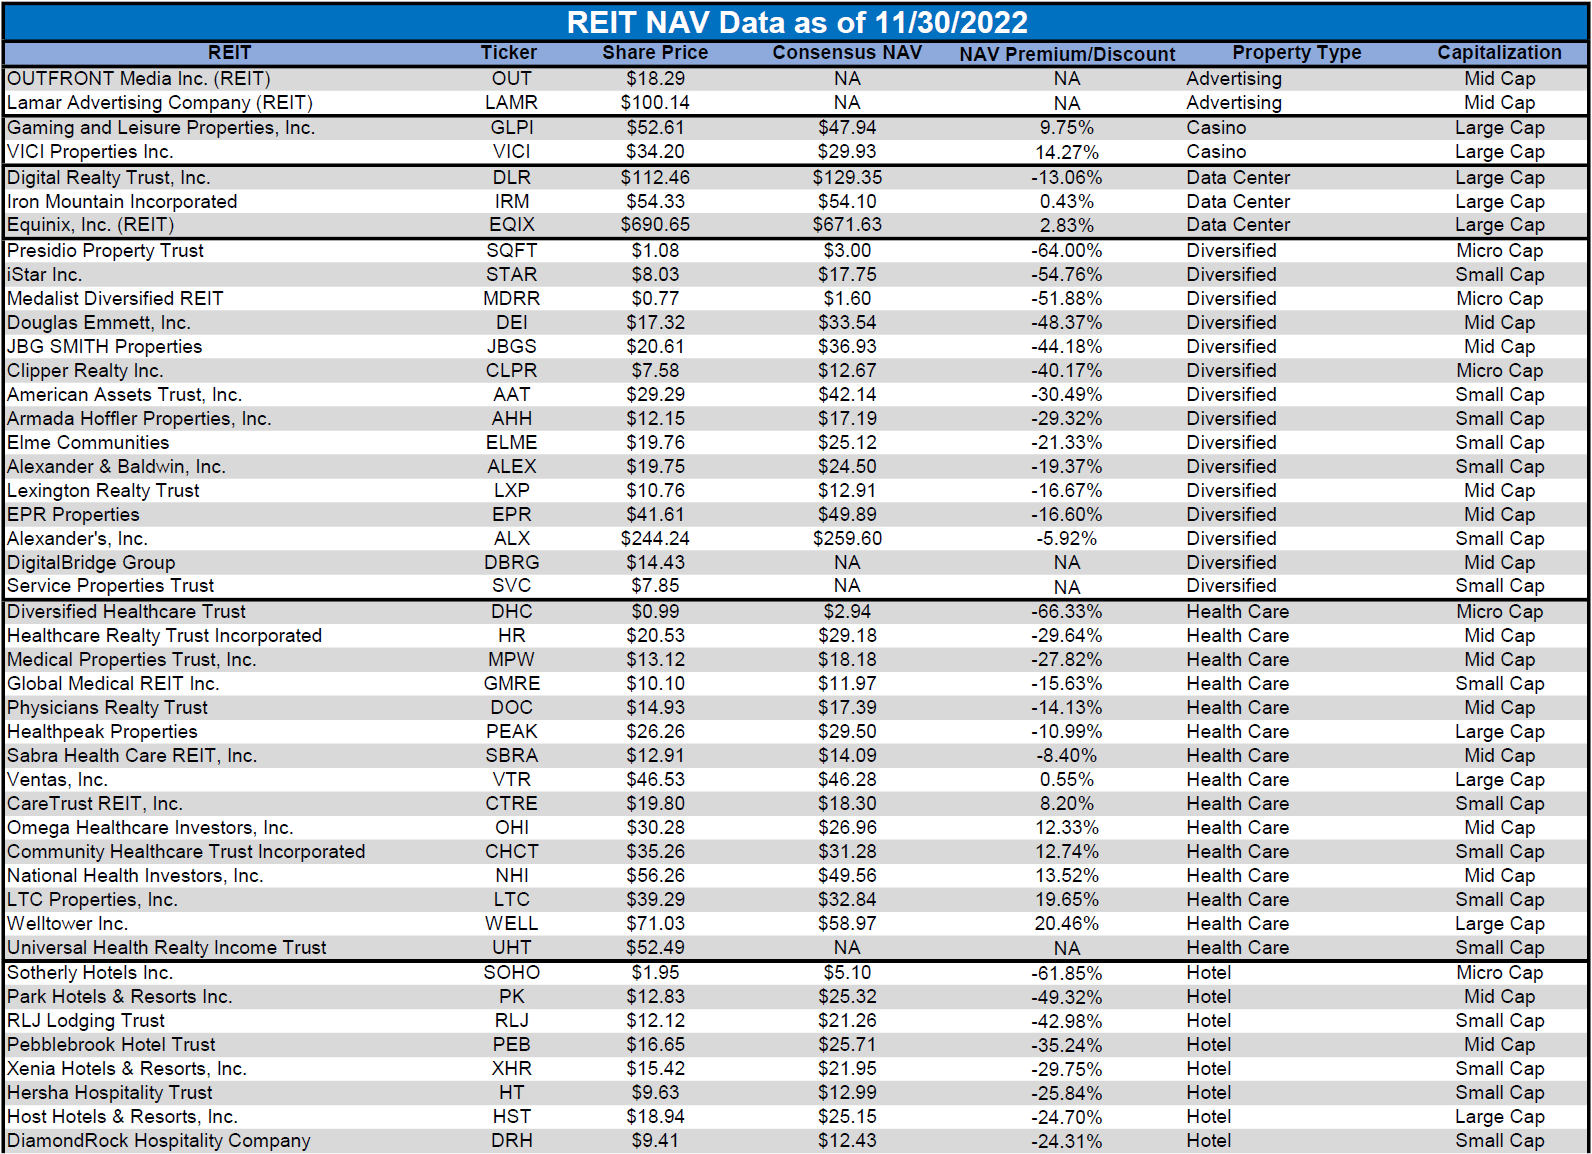
For the convenience of reading this table in a larger font, the table above is available as a PDF as well.
Takeaway
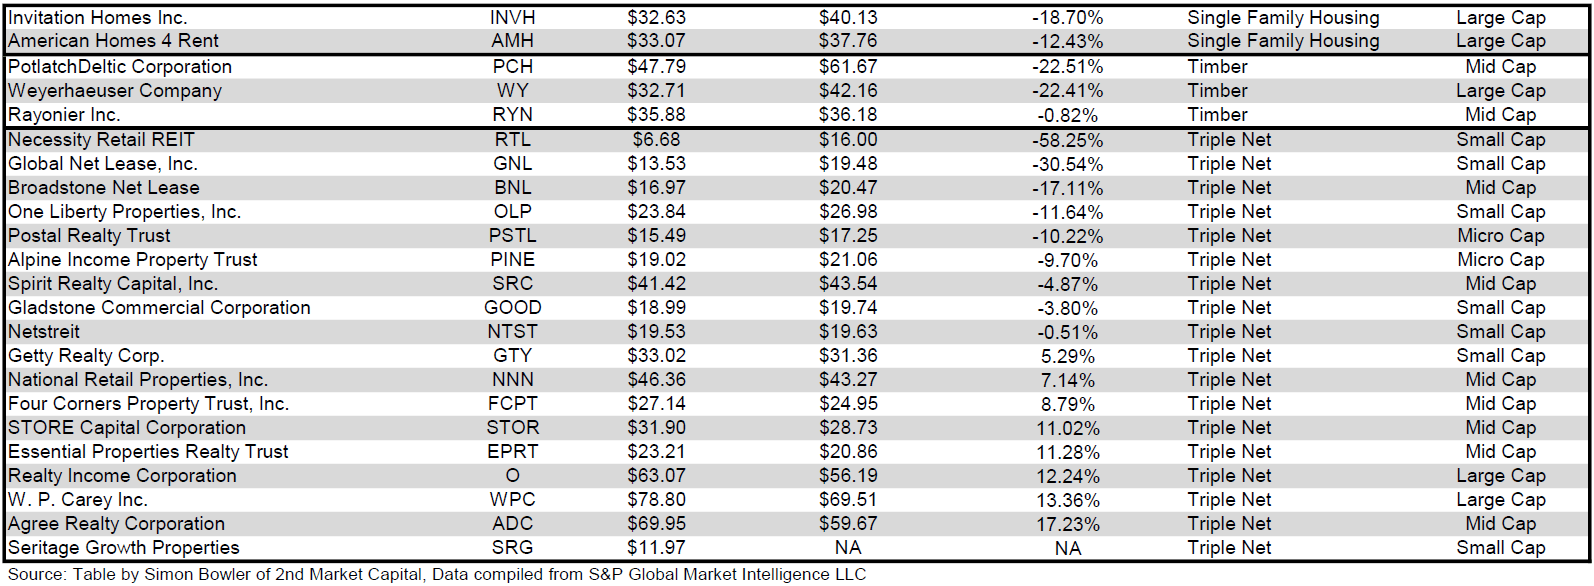
The large cap REIT premium (relative to small cap REITs) narrowed slightly in November and investors are now paying on average about 45% more for each dollar of 2023 FFO/share to buy large cap REITs than small cap REITs (17.5x/12.1x – 1 = 44.6%). As can be seen in the table below, there is presently a strong positive correlation between market cap and FFO multiple.
Source: Table by Simon Bowler of 2nd Market Capital, Data compiled from S&P Global Market Intelligence LLC. See important notes and disclosures at the end of this article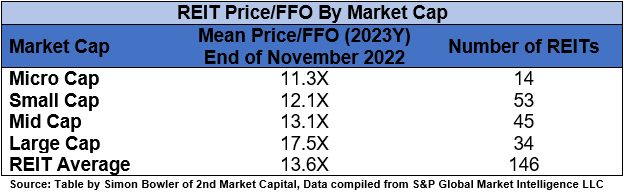
The table below shows the average premium/discount of REITs of each market cap bucket. This data, much like the data for price/FFO, shows a strong, positive correlation between market cap and Price/ NAV. The average large cap REIT (-7.07%) trades at a single-digit discount to NAV, while mid cap REITs (-15.72%) trade at a double-digit discount. Small cap REITs (-24.83%) trade at approximately ¾ of NAV. Micro caps on average trade at just under half of their respective NAVs (-51.46%).
Source: Table by Simon Bowler of 2nd Market Capital, Data compiled from S&P Global Market Intelligence LLC. See important notes and disclosures at the end of this article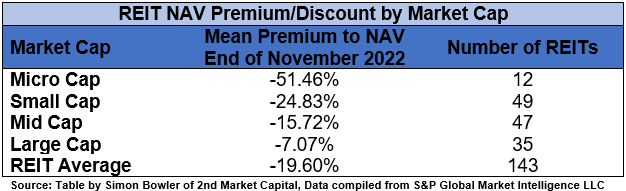
REITs continue to hike their dividends, providing growing passive income to REIT investors. 8 REITs increased their dividends in November, with hikes ranging from a modest +0.7% from Universal Health Realty Income Trust (UHT) to a more substantial +9.3% for Kite Realty Group (KRG). This was not the first raise of the year for KRG with Kite’s dividend having increased by +26.3% YTD.
S&P Global Market Intelligence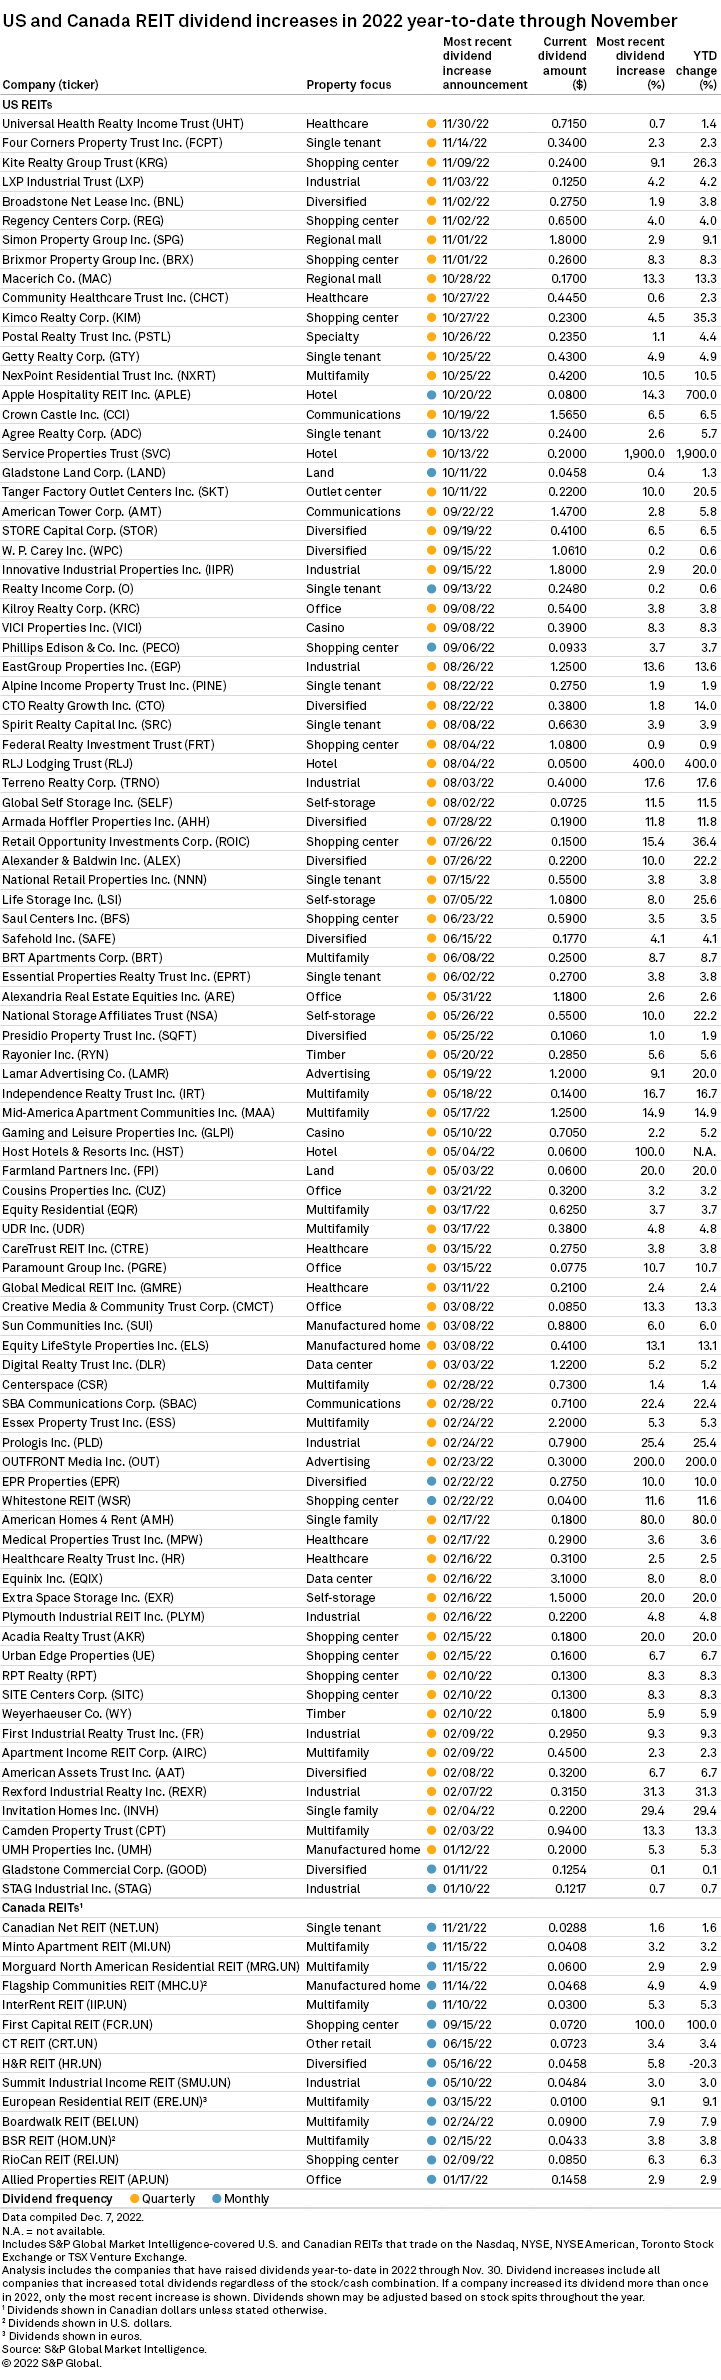
Half of the REITs raising their dividend in November were exclusively retail focused (Shopping Centers and Malls). Year to date, however, Industrial and Residential REITs have seen the highest share of REITs hiking their dividends in 2022 at 81.8% and 78.9% respectively.
S&P Global Market Intelligence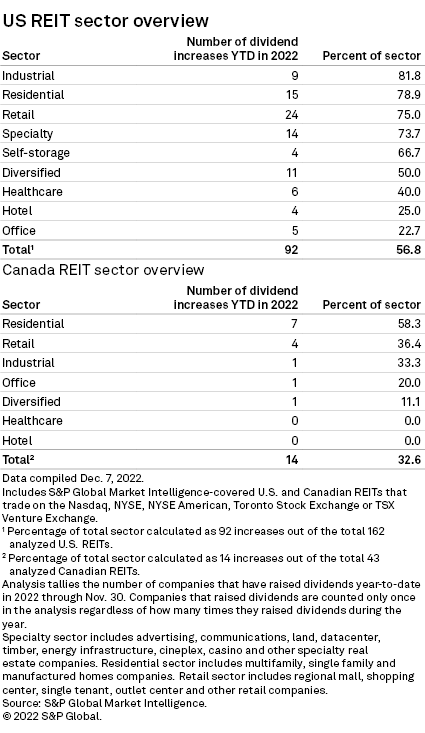
Although REIT sector Q3 earnings have generally been strong and there continue to be REIT dividend increases every month, there are some REITs that many investors are currently very bearish on. Sentiment varies greatly across the sector with 5 REITs even seeing short interest at over 10% of shares outstanding at the end of November. Pennsylvania REIT (PEI) now has 16% short interest, followed by NETSTREIT (NTST) at 14%, Medical Properties Trust (MPW) at 13.1%, SL Green Realty (SLG) at 12.3% and Vornado Realty Trust (VNO) at 11.4%.
S&P Global Market Intelligence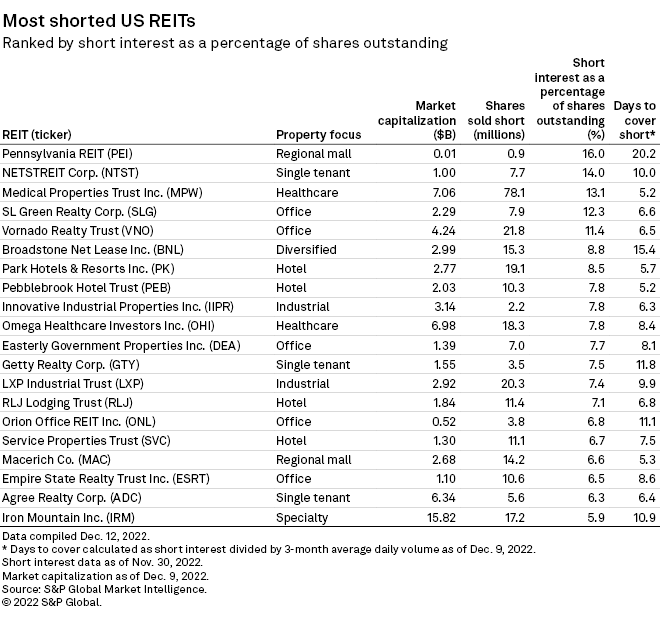
For some of these REITs, the headwinds they face will be strong enough to negatively impact fundamentals, damaging NAV/share and FFO/share enough to cause significant further price declines. In these situations, the short sellers will be rewarded handsomely for their bearish positions. Some of these heavily shorted REITs, however, will perform far better than expected and the negative catalysts that are being forecasted by short sellers will fail to materialize. This could result in magnified price increases as short sellers exit their positions by buying back shares. In order to identify which REITs represent an opportunity on the long vs. short side, it is essential to dig into each REIT’s balance sheet, portfolio and strategy. There is an opportunity to achieve meaningful alpha by identifying which REITs truly warrant the short interest vs. those that are badly misunderstood by the market.
Be the first to comment