

May Lim/iStock via Getty Images
REIT Performance
REITs, much like the broader market, had a rough start to the year with a -5.83% total return in January and February. However, the sector partially bounced back in March with a strong +4.93% return in March. REITs outperformed the broader market again in March as the S&P 500 (+3.58%), the NASDAQ (+3.41%) and the Dow Jones Industrial Average (+2.32%) all saw smaller gains than REITs. The market cap weighted Vanguard Real Estate ETF (VNQ) outperformed the average REIT in March (+6.27% vs. +4.93%), but YTD has endured more than 4x the losses of the average REIT (-6.07% vs. -1.44%). The spread between the 2022 FFO multiples of large cap REITs (23.1x) and small cap REITs (16.4x) widened in March as multiples increased by 1.3 turns for large caps and increased by only 0.1 turns for small caps. In this monthly publication, I will provide REIT data on numerous metrics to help readers identify which property types and individual securities currently offer the best opportunities to achieve their investment goals.
Source: Graph by Simon Bowler of 2nd Market Capital, Data compiled from S&P Global Market Intelligence LLC. See important notes and disclosures at the end of this article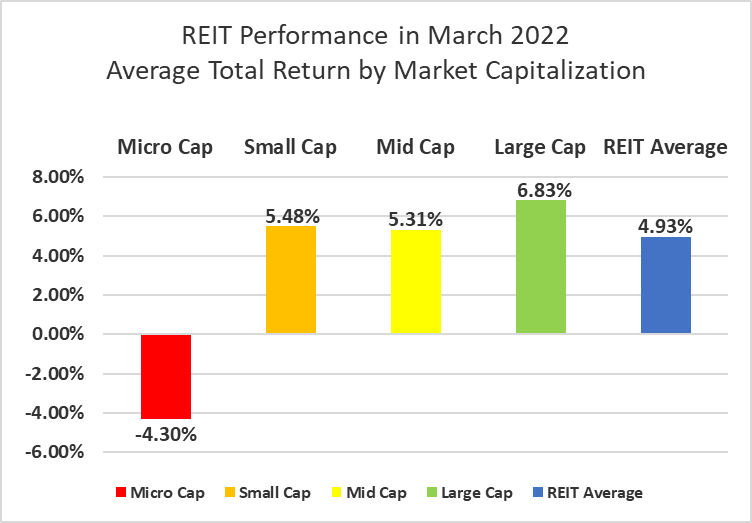
Large cap (+6.83%) REITs outperformed in March as small cap (+5.48%) and mid cap (+5.31%) REITs also had a strong month. Micro caps (-4.30%), however, badly underperformed their larger peers in March. Small cap REITs (-0.82%) are outperforming large caps (-4.20%) by 338 basis points on YTD 2022 total return.
Source: Graph by Simon Bowler of 2nd Market Capital, Data compiled from S&P Global Market Intelligence LLC. See important notes and disclosures at the end of this article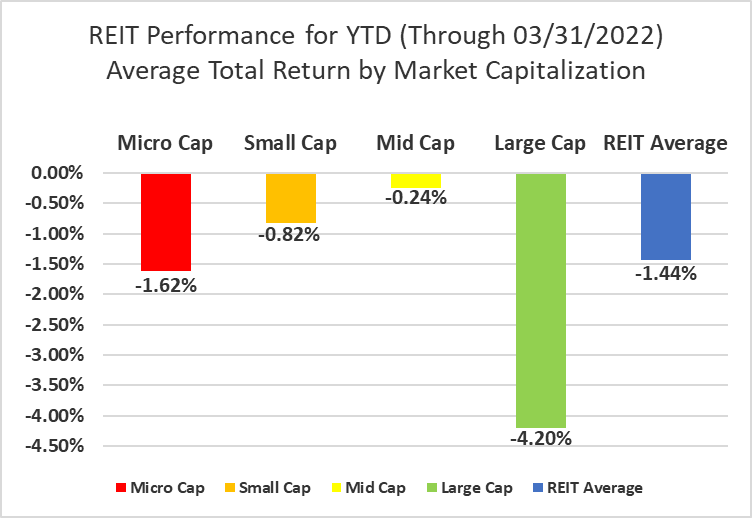
18 out of 19 Property Types Yielded Positive Total Returns in March
95% of REIT property types averaged a positive total return in March, with a 14.74% total return spread between the best and worst performing property types. Malls (-4.44%) and Timber (+1.51%) REITs had the lowest average total returns in March. Although half of mall REITs were in the black in March, the dismal -32.19% price drop of Pennsylvania REIT (PEI) sharply pulled the property type into negative territory.
Land (+10.30%) and Health Care (+9.31%) REITs led all property types in March. Although land lease REIT Safehold (SAFE) (-9.36% in March and -30.35% YTD) continues to fall, this decline was more than offset by the enormous strength of both farmland REITs. As owners and landlords of American farmland, both Gladstone Land (LAND) and Farmland Partners (FPI) have been the beneficiaries of runaway inflation in food pricing. LAND and FPI soared +22.00% and +18.25% respectively in March.
Table by Simon Bowler of 2nd Market Capital, Data compiled from S&P Global Market Intelligence LLC. See important notes and disclosures at the end of this article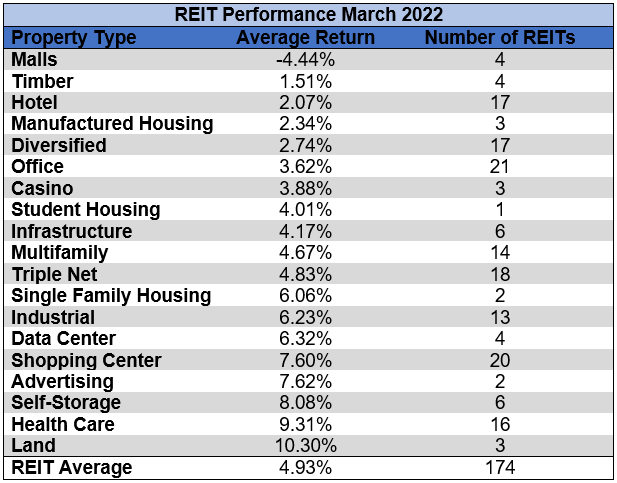
Hotel (+7.10%) and Office REITs (+5.34%) remain the top performing property types over the first quarter of the year. Malls (-14.51%) and Infrastructure (-13.40%) REITs have seen larger losses than all other property types thus far in 2022. All 6 Infrastructure REITs are in the red in 2022 with 2/3 of them reaching double-digit declines.
Table by Simon Bowler of 2nd Market Capital, Data compiled from S&P Global Market Intelligence LLC. See important notes and disclosures at the end of this article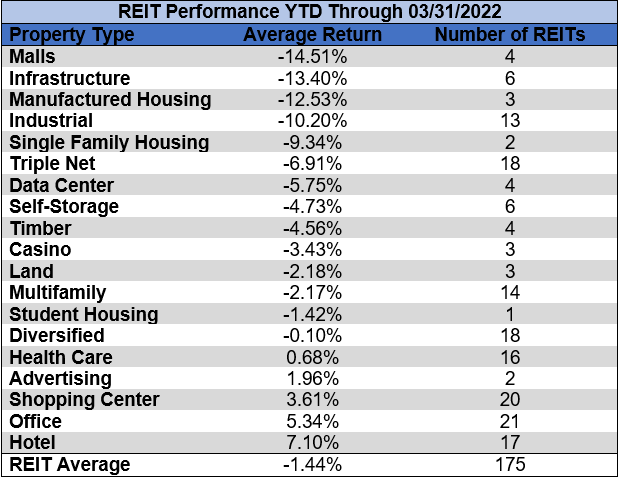
The REIT sector as a whole saw the average P/FFO (2022) increase 0.6 turns in March (from 17.2x up to 17.8x). The average FFO multiples rose for 88.9% and declined for 11.1% of property types in March. There are no recent 2022 FFO/share estimates for either of the Advertising REITs. Land (43.4x), Industrial (29.2x), Manufactured Housing (25.9x) and Data Centers (25.3x) all saw multiple expansion and trade at the highest multiples of any REIT property type. Mall REITs (7.2x) are the only property type currently trading at a single-digit multiple.
Table by Simon Bowler of 2nd Market Capital, Data compiled from S&P Global Market Intelligence LLC. See important notes and disclosures at the end of this article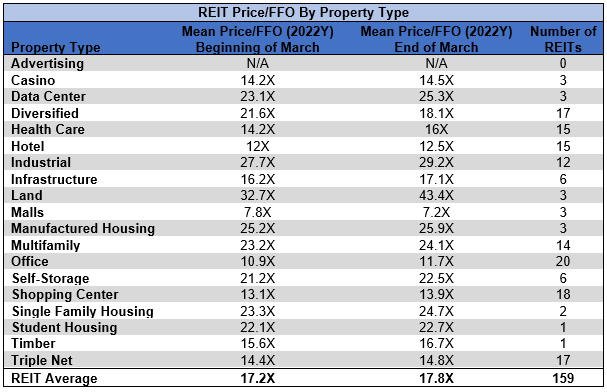
Performance of Individual Securities
CyrusOne (CONE) was acquired by KKR (KKR) and Global Infrastructure Partners (GIP) on March 25th for $90.50/share. This was an all-cash purchase and CONE is no longer publicly traded.
CorePoint Lodging (CPLG) was acquired for $15.65/share in cash by Cerberus Capital Management L.P. and Highgate Hotels L.P. They purchased all outstanding common shares of CPLG and it was taken private on March 3rd.
Seritage Growth Properties (SRG) (+24.24%) announced on February 27th that the company was exploring options that include an outright sale of the company or selling off assets piece by piece over time. The struggling triple net REIT’s share price soared from $9.22/share before the announcement up to $12.66/share at the end of March. However, even this strong price recovery was not quite enough to bring SRG back into positive territory as it finished Q1 with a total return of only -4.6%.
Pennsylvania REIT (-32.19%) suffered the greatest share price decline of any REIT in March and was the 2nd worst performing REIT in Q1 2022 (-38.18%). Much like fellow mall REITs CBL Properties (CBL) and Washington Prime Group (no longer publicly traded), PEI went through the Chapter 11 bankruptcy process. However, unlike CBL’s full restructuring which wiped out existing common and preferred shares and converted a substantial amount of debt into the new common equity, PEI’s bankruptcy case was very quick and was resolved with only slightly adjusted arrangements with lenders. It involved no significant restructuring or elimination of debt. As a result, PEI is still buried under a mountain of debt and continues to face enormous interest payments. PEI has been pursuing a series of asset sales that would unlock capital which could be used to pay down debt, but has fallen behind the targeted disposition schedule. This has fueled growing investor fears of another more substantial Chapter 11 bankruptcy.
86.71% of REITs had a positive return in March with only 42.29% in the black year to date. During the first three months of last year, the average REIT had a +13.48% return, whereas this year the average REIT has seen a -1.44% decline.
Table by Simon Bowler of 2nd Market Capital, Data compiled from S&P Global Market Intelligence LLC Table by Simon Bowler of 2nd Market Capital, Data compiled from S&P Global Market Intelligence LLC Table by Simon Bowler of 2nd Market Capital, Data compiled from S&P Global Market Intelligence LLC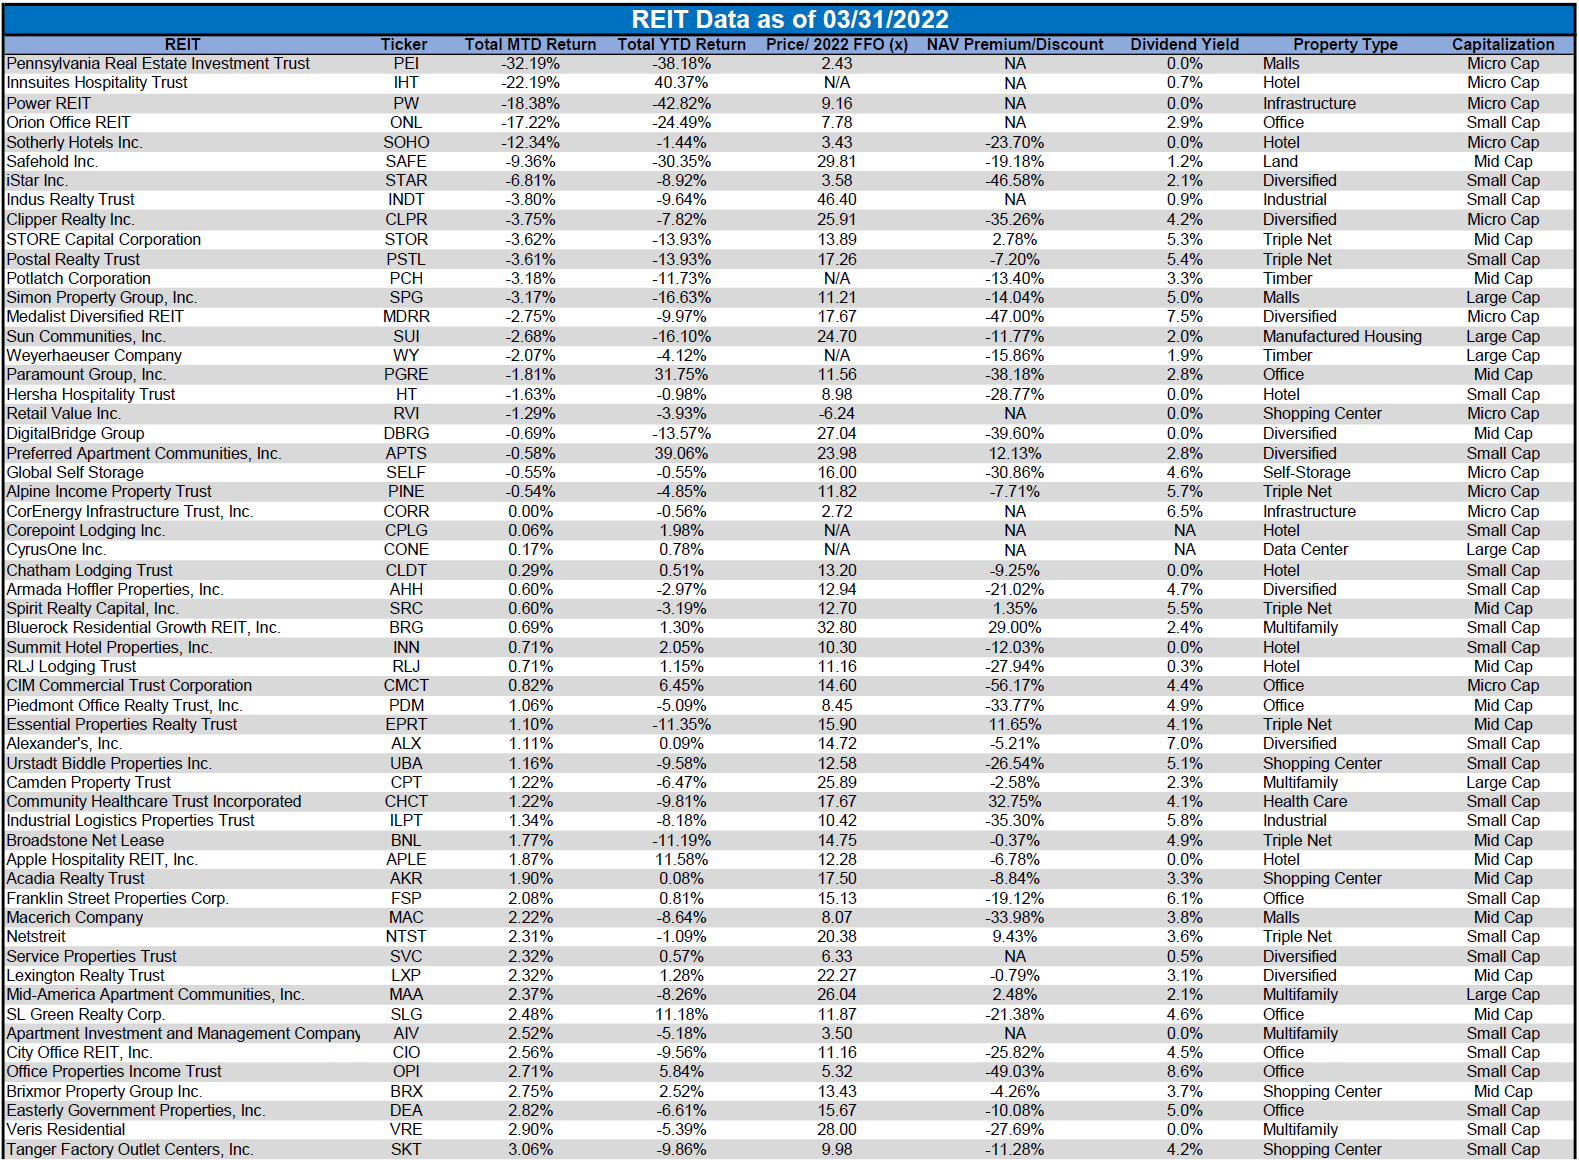
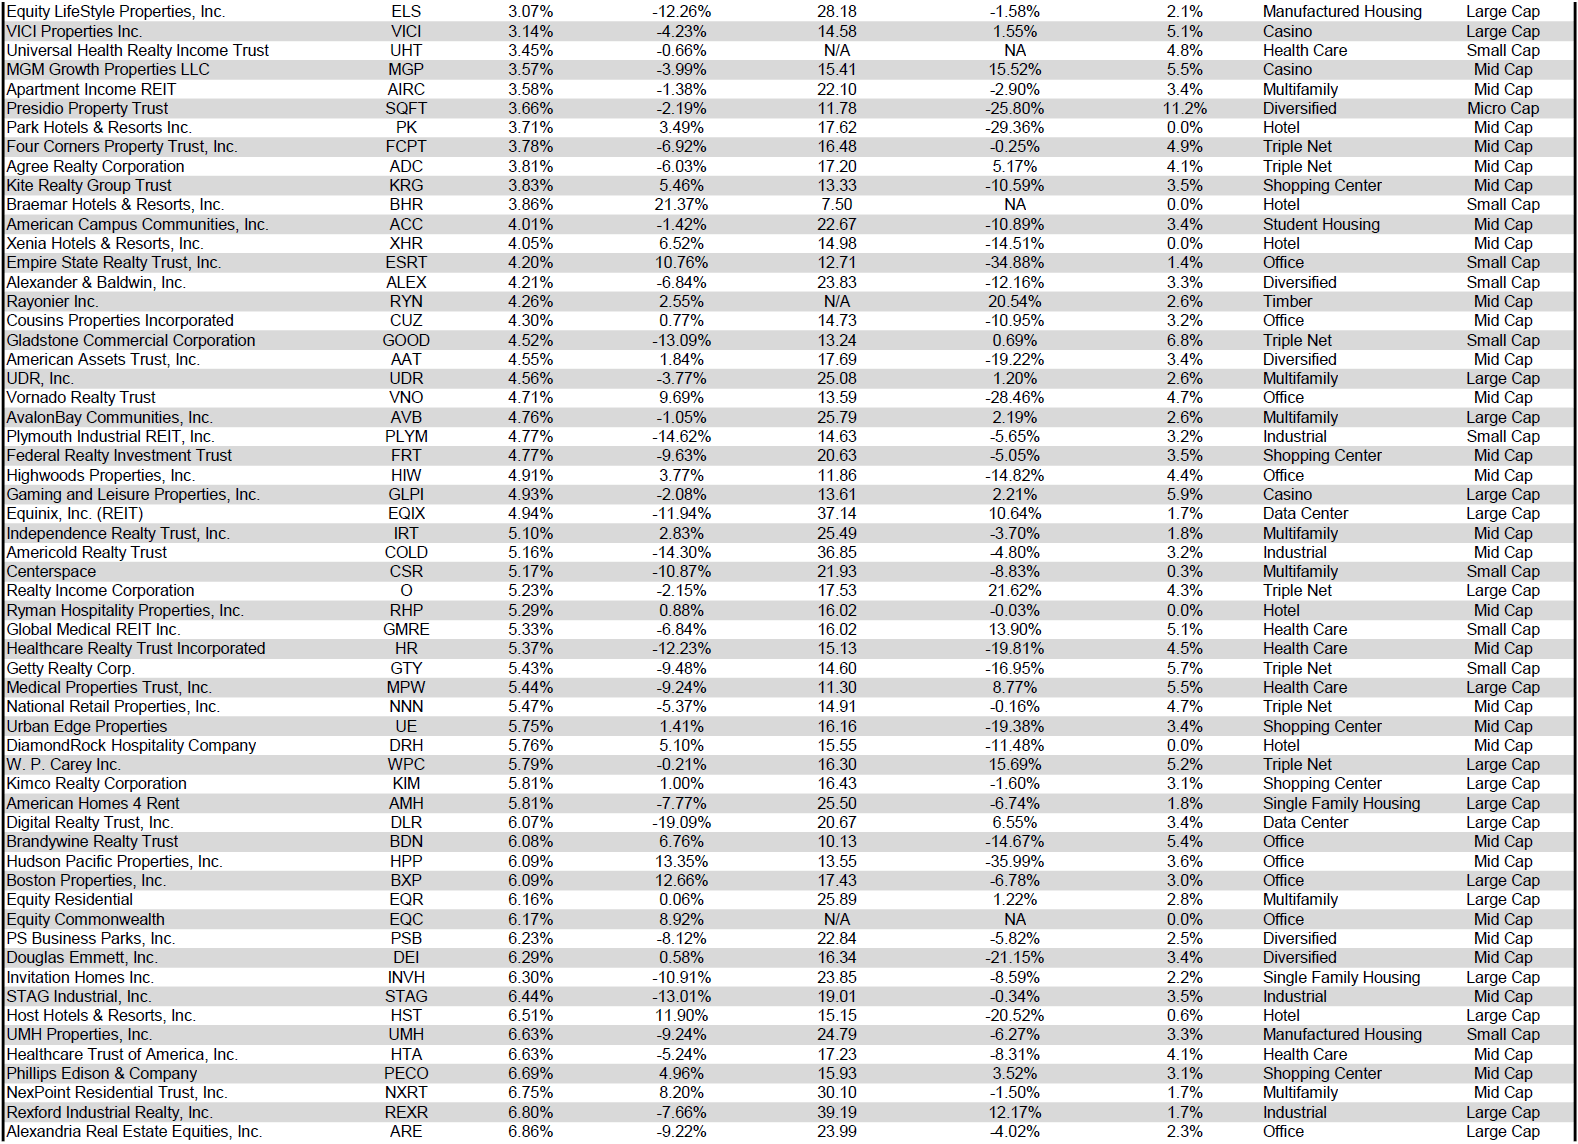
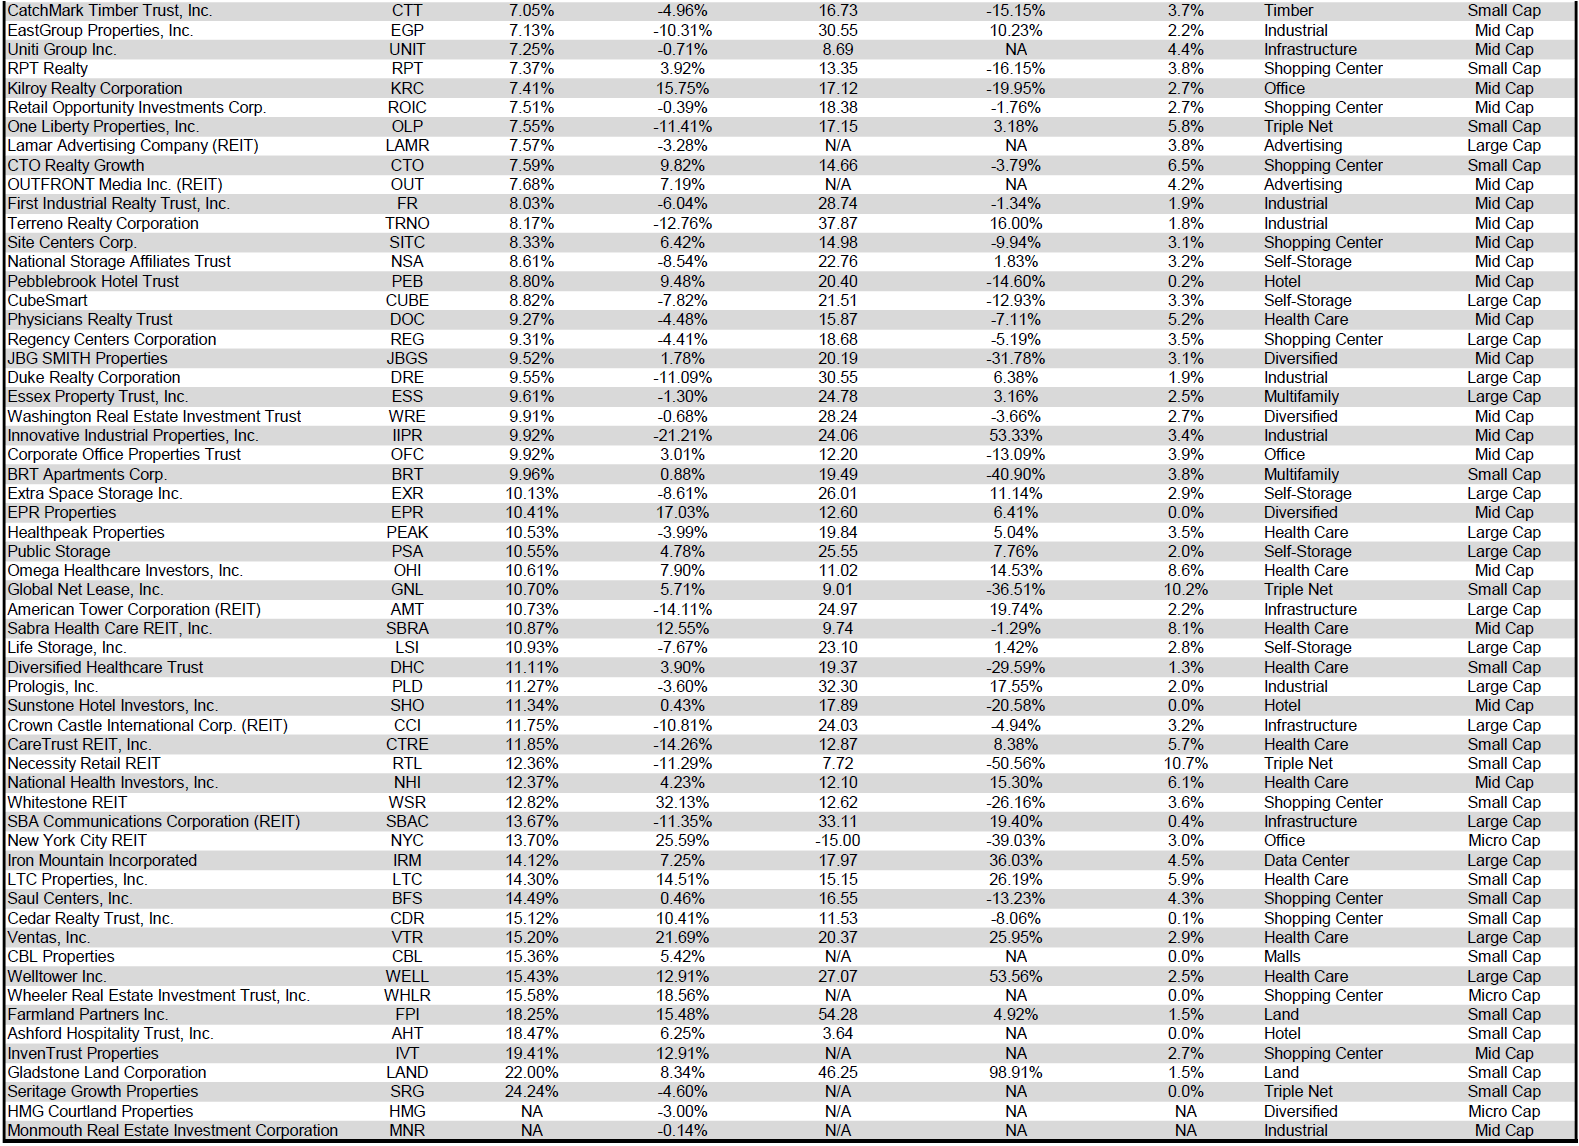
For the convenience of reading this table in a larger font, the table above is available as a PDF as well.
Dividend Yield
Dividend yield is an important component of a REIT’s total return. The particularly high dividend yields of the REIT sector are, for many investors, the primary reason for investment in this sector. As many REITs are currently trading at share prices well below their NAV, yields are currently quite high for many REITs within the sector. Although a particularly high yield for a REIT may sometimes reflect a disproportionately high risk, there exist opportunities in some cases to capitalize on dividend yields that are sufficiently attractive to justify the underlying risks of the investment. I have included below a table ranking equity REITs from highest dividend yield (as of 03/31/2022) to lowest dividend yield.
Table by Simon Bowler of 2nd Market Capital, Data compiled from S&P Global Market Intelligence LLC Table by Simon Bowler of 2nd Market Capital, Data compiled from S&P Global Market Intelligence LLC Table by Simon Bowler of 2nd Market Capital, Data compiled from S&P Global Market Intelligence LLC Table by Simon Bowler of 2nd Market Capital, Data compiled from S&P Global Market Intelligence LLC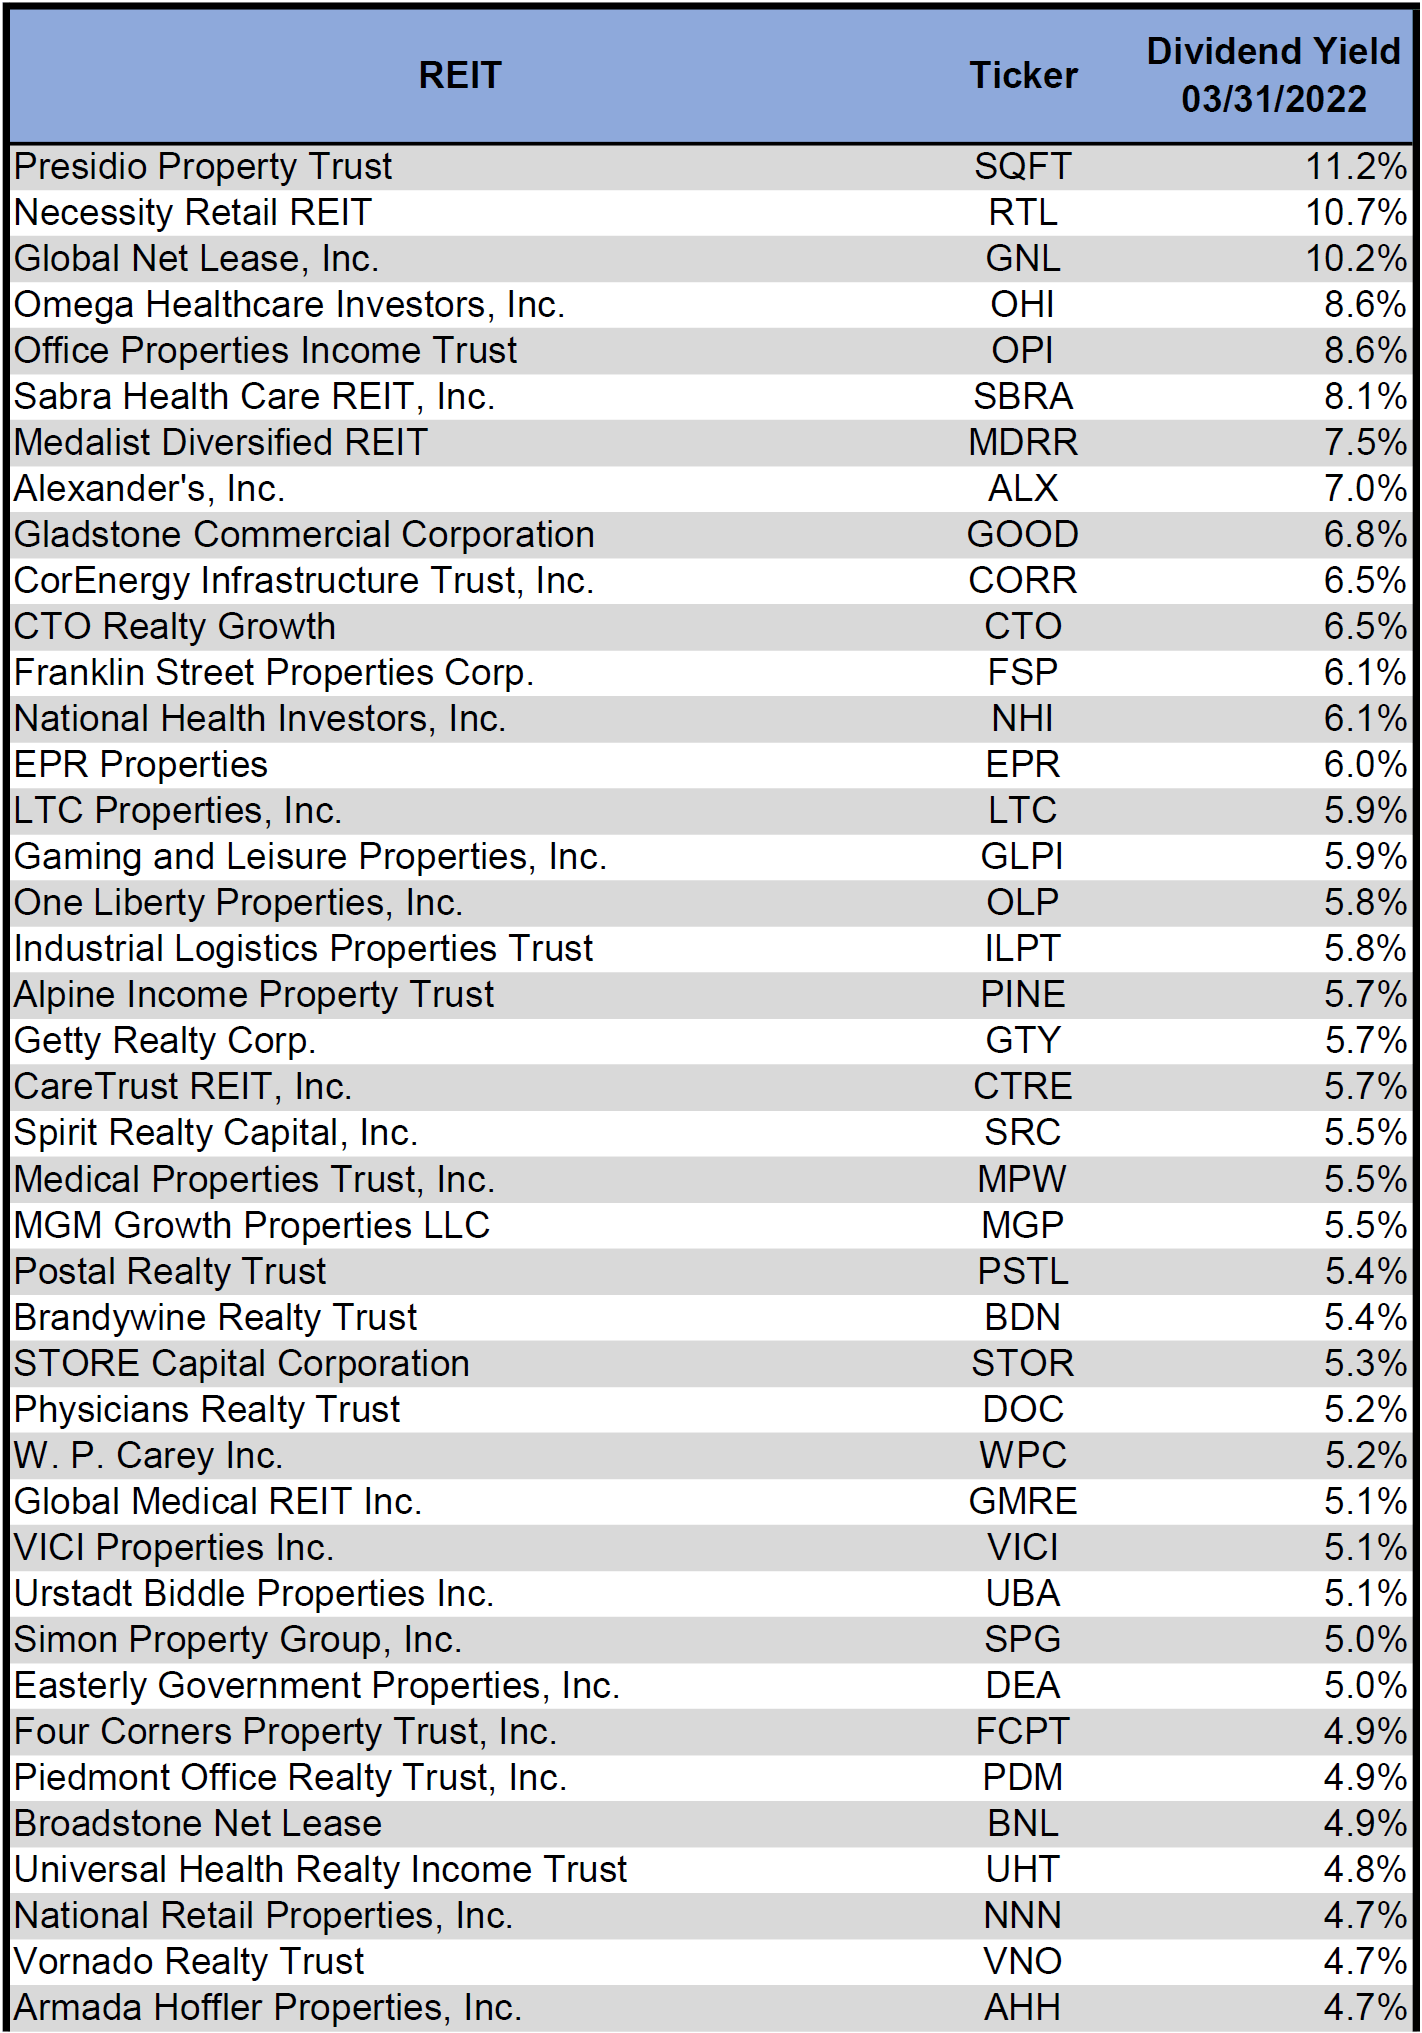
For the convenience of reading this table in a larger font, the table above is available as a PDF as well.
Although a REIT’s decision regarding whether to pay a quarterly dividend or a monthly dividend does not reflect on the quality of the company’s fundamentals or operations, a monthly dividend allows for a smoother cash flow to the investor. Below is a list of equity REITs that pay monthly dividends ranked from highest yield to lowest yield.
Table by Simon Bowler of 2nd Market Capital, Data compiled from S&P Global Market Intelligence LLC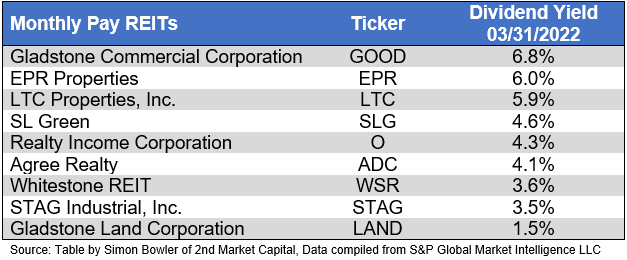
Valuation
REIT Premium/Discount to NAV by Property Type
Below is a downloadable data table, which ranks REITs within each property type from the largest discount to the largest premium to NAV. The consensus NAV used for this table is the average of analyst NAV estimates for each REIT. Both the NAV and the share price will change over time, so I will continue to include this table in upcoming issues of The State of REITs with updated consensus NAV estimates for each REIT for which such an estimate is available.
Table by Simon Bowler of 2nd Market Capital, Data compiled from S&P Global Market Intelligence LLC Table by Simon Bowler of 2nd Market Capital, Data compiled from S&P Global Market Intelligence LLC Table by Simon Bowler of 2nd Market Capital, Data compiled from S&P Global Market Intelligence LLC Table by Simon Bowler of 2nd Market Capital, Data compiled from S&P Global Market Intelligence LLC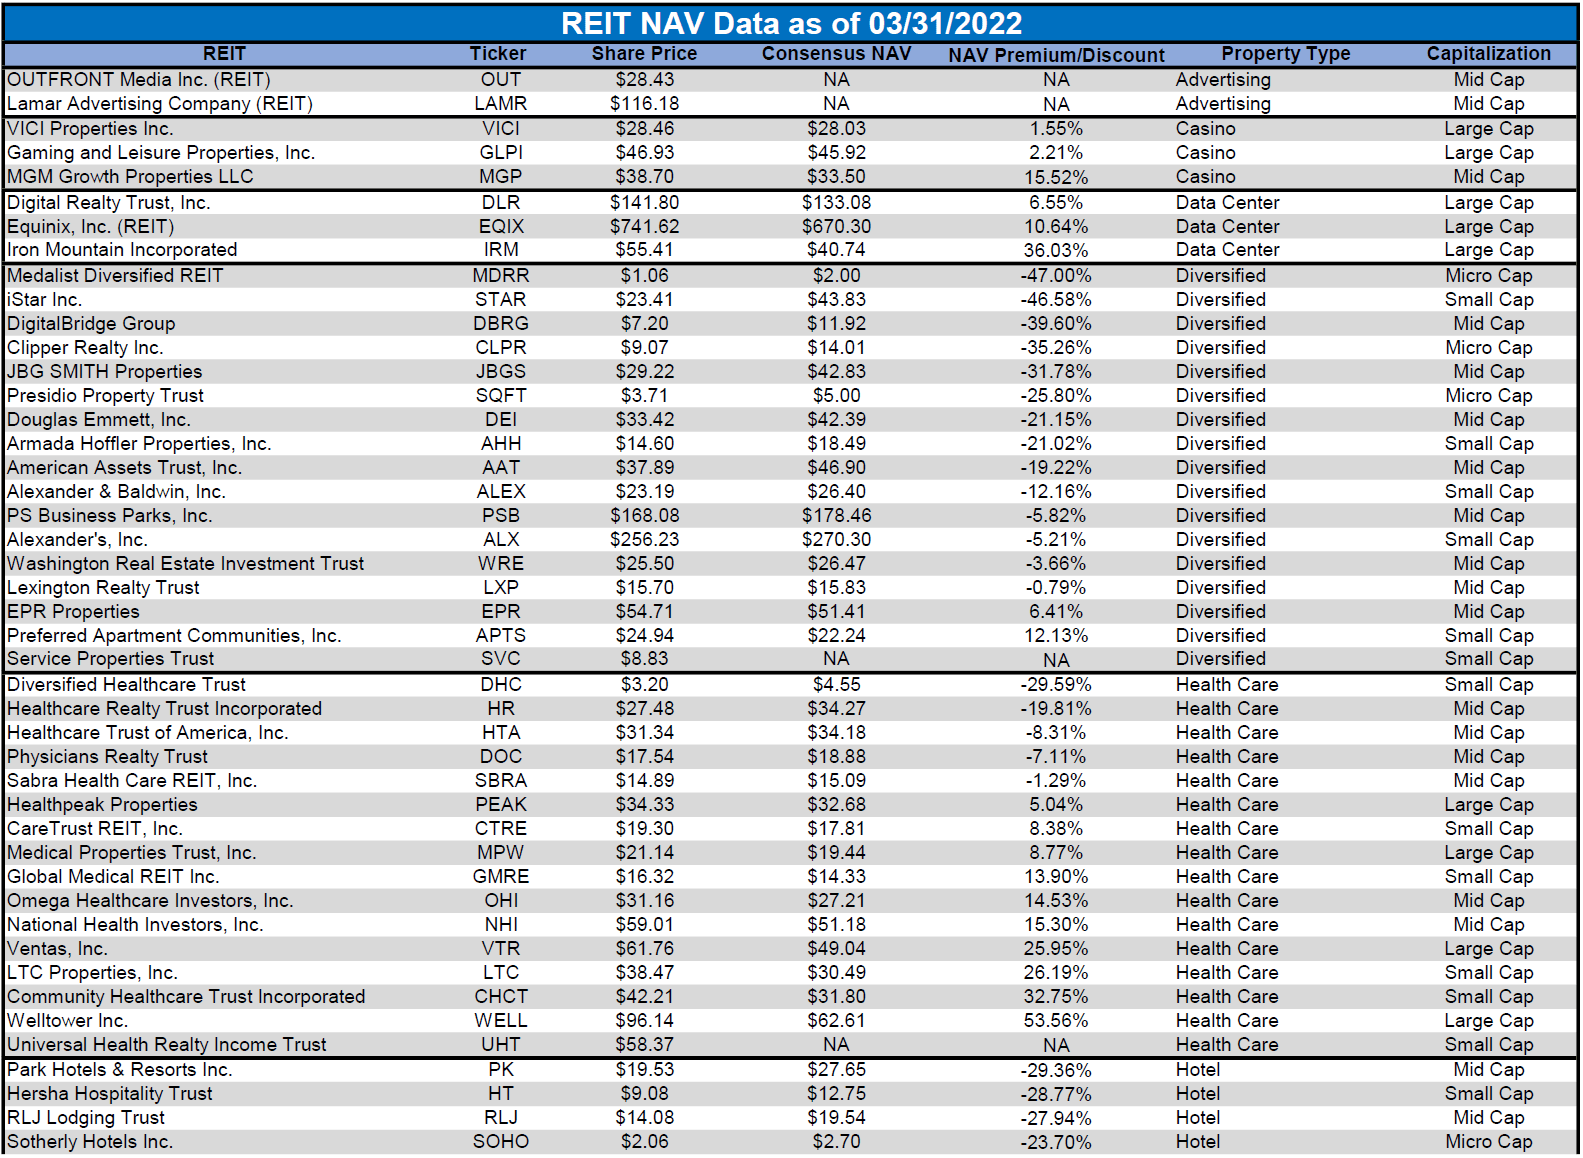
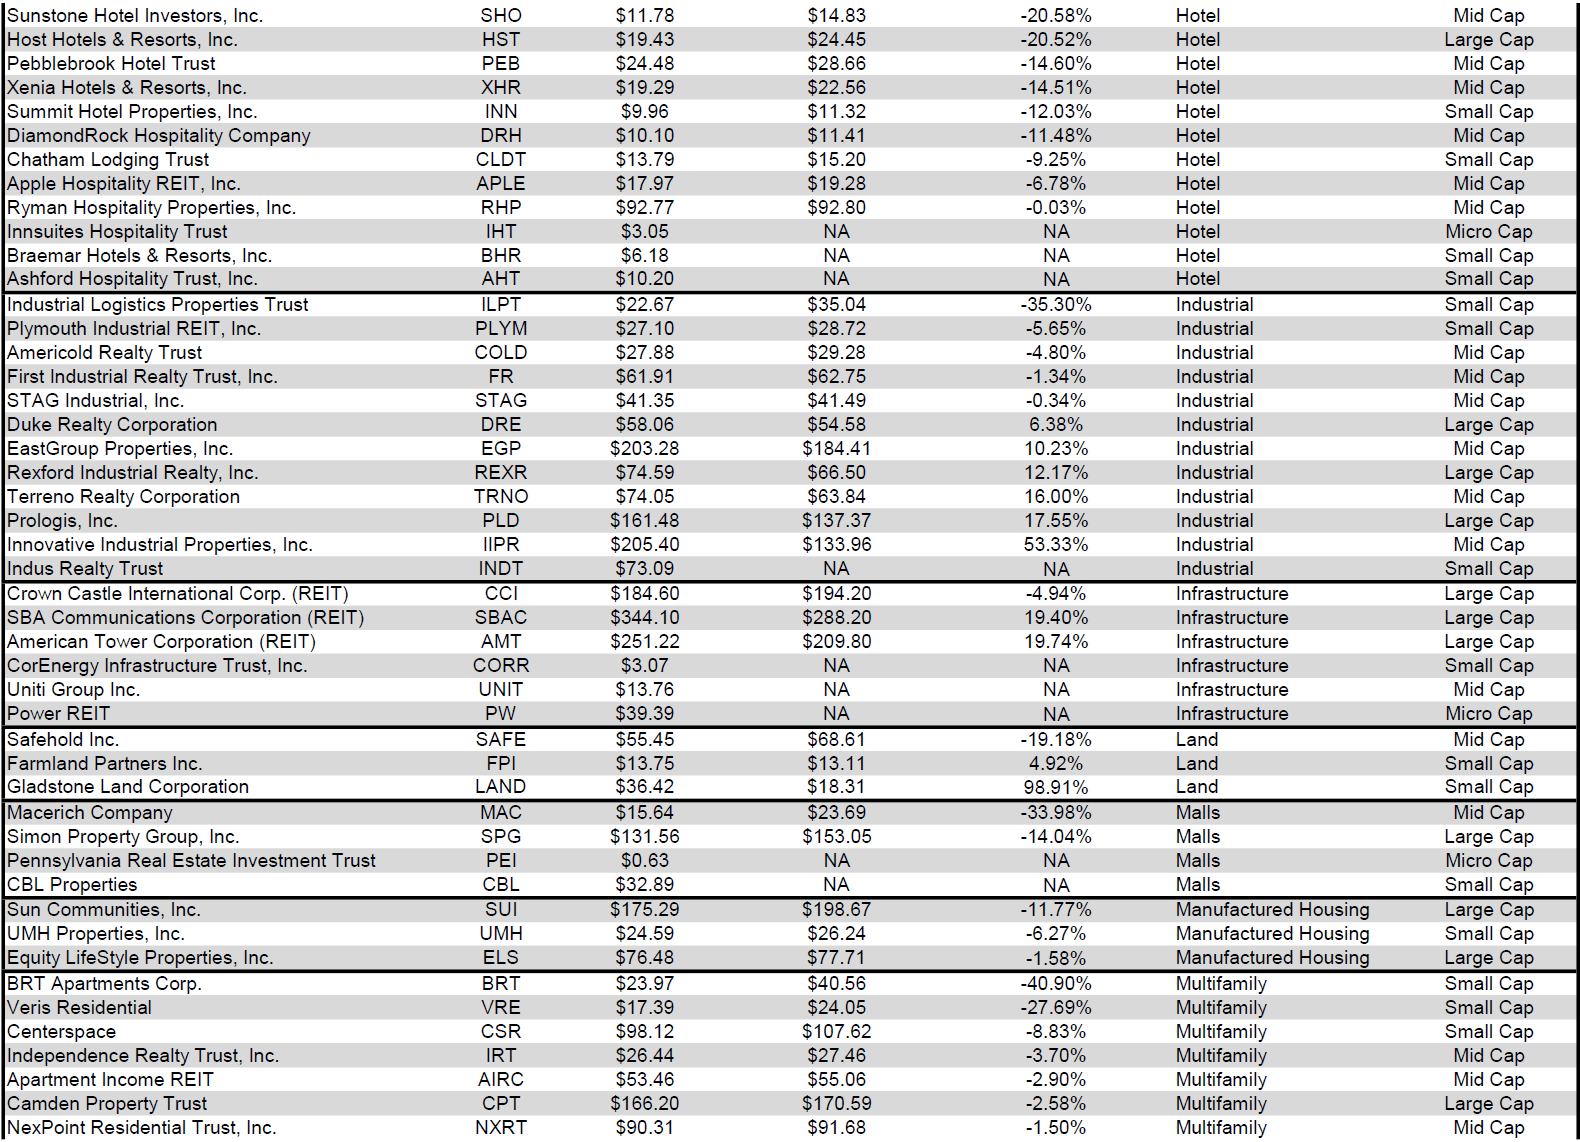
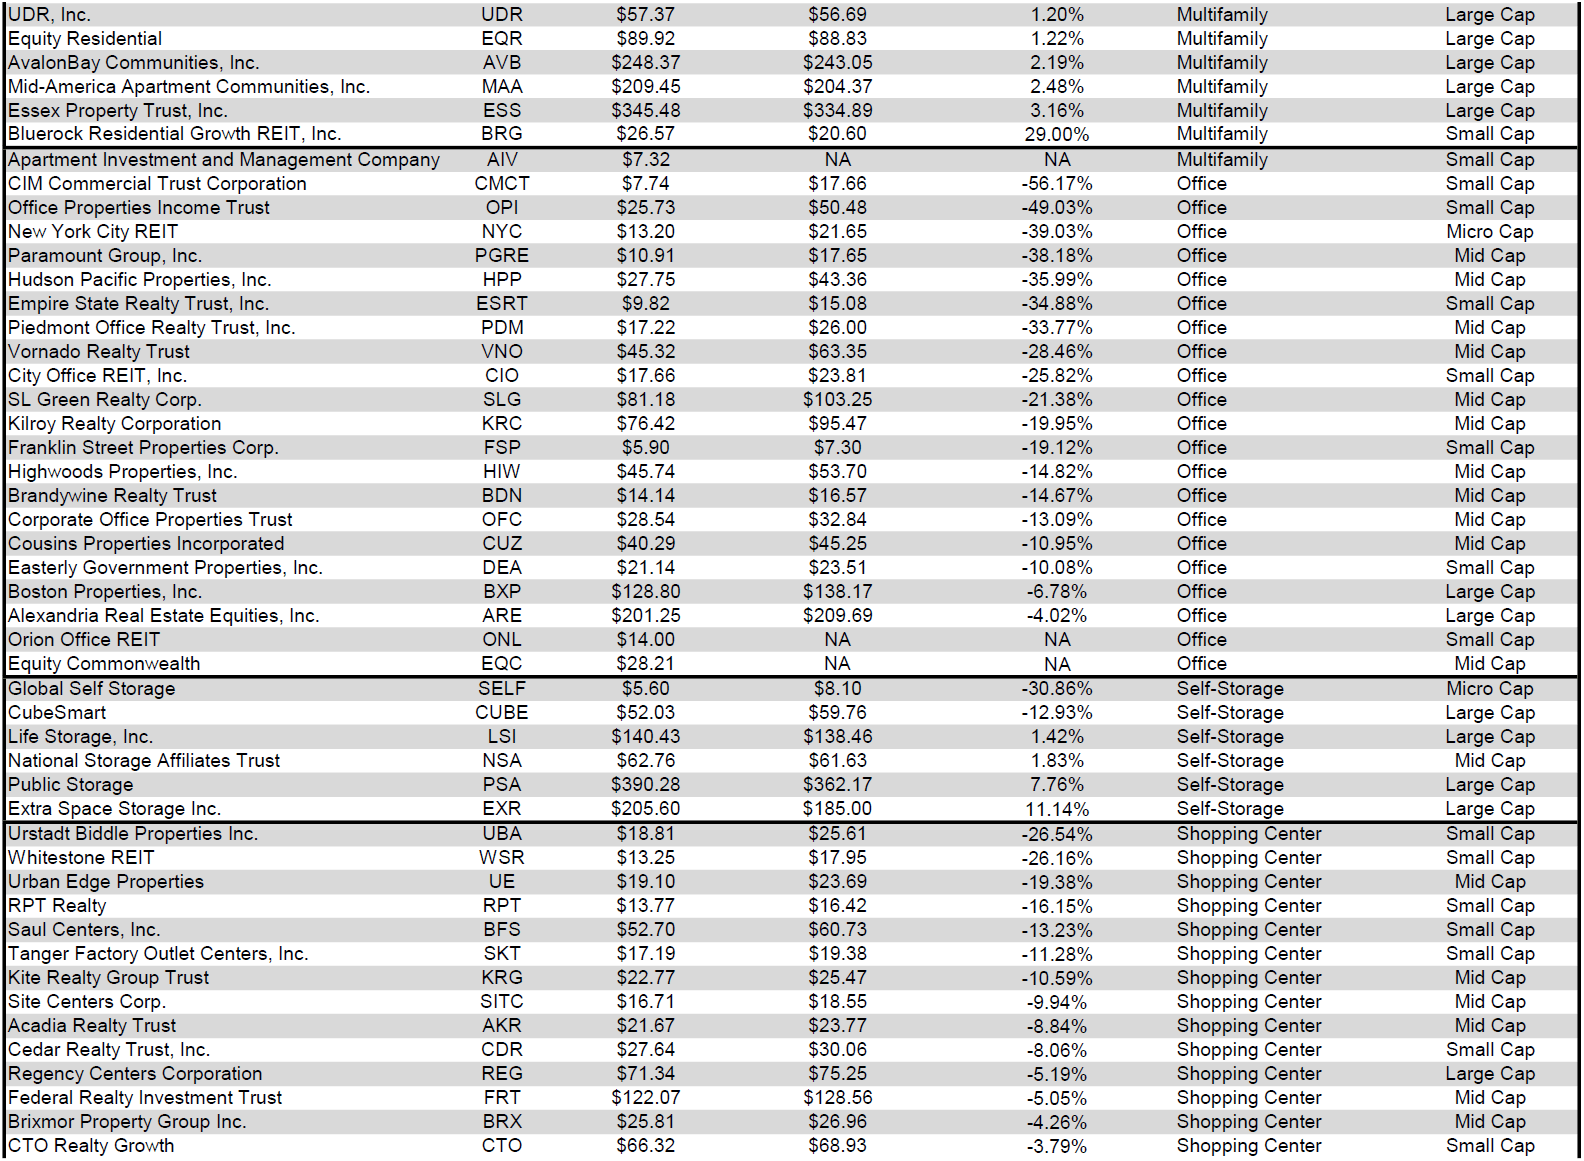
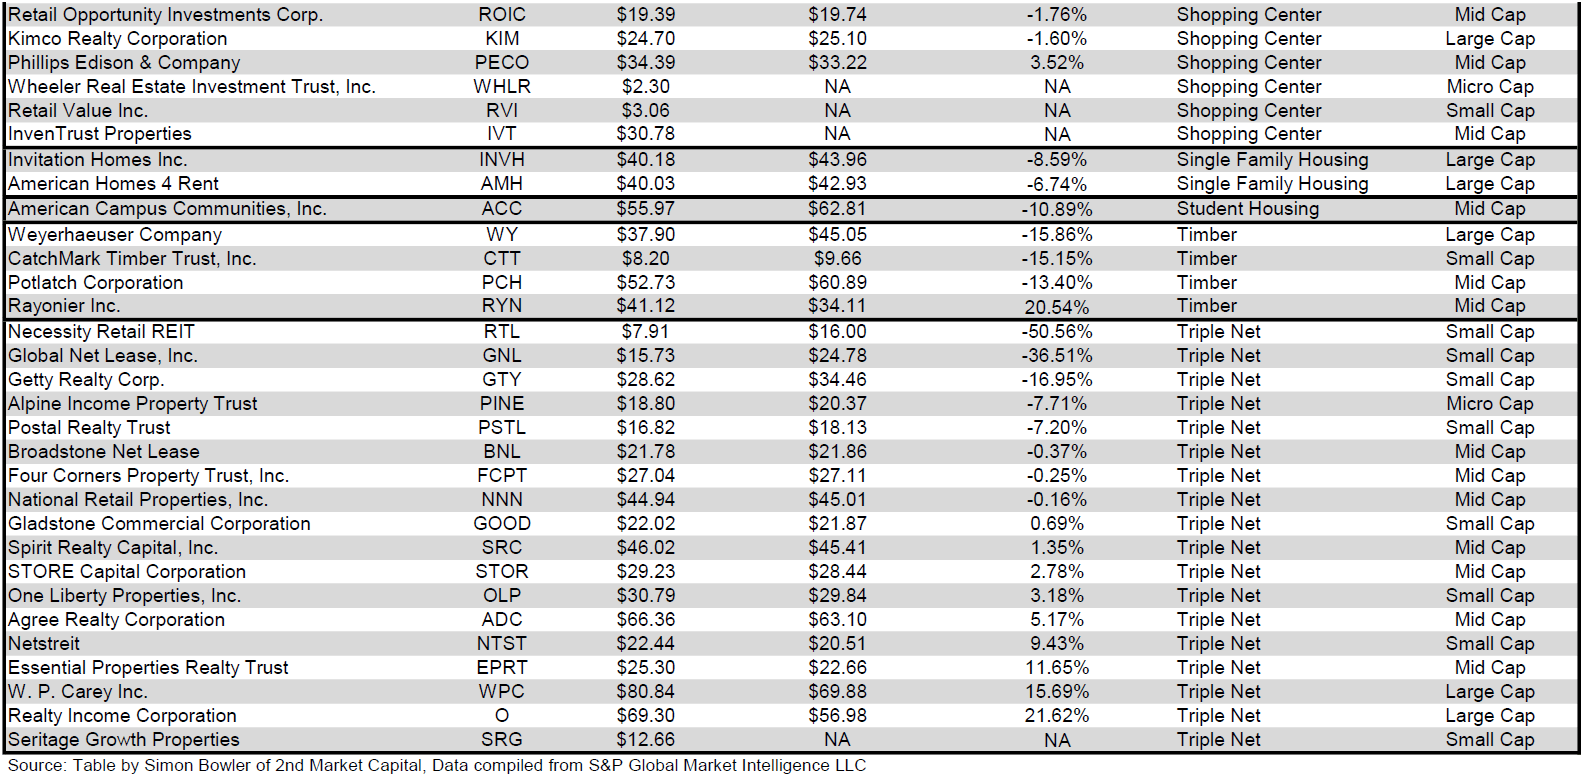
For the convenience of reading this table in a larger font, the table above is available as a PDF as well.
Takeaway
The large cap REIT premium (relative to small cap REITs) widened in March and investors are now paying on average about 41% more for each dollar of 2022 FFO/share to buy large cap REITs than small cap REITs (23.1x/16.4x – 1 = 40.9%). As can be seen in the table below, there is presently a strong positive correlation between market cap and FFO multiple.
Table by Simon Bowler of 2nd Market Capital, Data compiled from S&P Global Market Intelligence LLC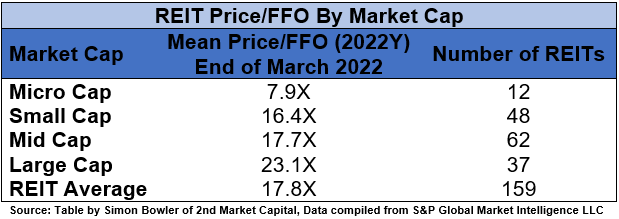
The table below shows the average premium/discount of REITs of each market cap bucket. This data, much like the data for price/FFO, shows a strong, positive correlation between market cap and Price/NAV. The average large cap REIT (+4.64%) trades at a single-digit premium to NAV, while mid cap REITs (-7.77%) trade at a single-digit discount. Small cap REITs (-10.01%) trade at a double-digit discount and micro caps on average trade at only about 2/3 of their respective NAVs (-33.19%).
Table by Simon Bowler of 2nd Market Capital, Data compiled from S&P Global Market Intelligence LLC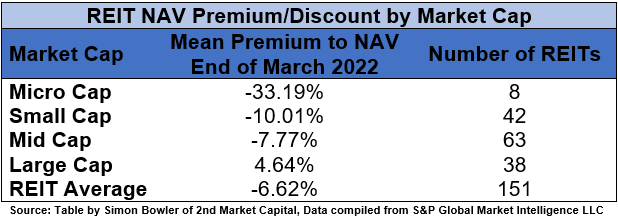
When Covid hit the US and the government responded by implementing lockdowns that severely disrupted normal economic activity, many REITs and other publicly traded companies experienced sudden share price collapses. In many cases, they also suffered a significant reduction in revenue. With tremendous uncertainty surrounding how long the pandemic would last or which policies the government would pursue to combat it, many REITs during this period dramatically increased the cash on their balance sheets and maintained high cash ratios in order to provide a safety net in case things were to become even worse. As the economy rapidly recovered, many of these REITs (particularly those that are investment grade) steadily scaled back their cash holdings and allowed their cash ratios to normalize close to pre-Covid levels. By the end of 2021, both investment grade and non-investment grade publicly traded real estate companies had lowered their cash ratios to only marginally higher than they were pre-Covid. This reflects their confidence in the future, as they no longer feel compelled to hoard cash to ensure sufficient liquidity.
S&P Global Market Intelligence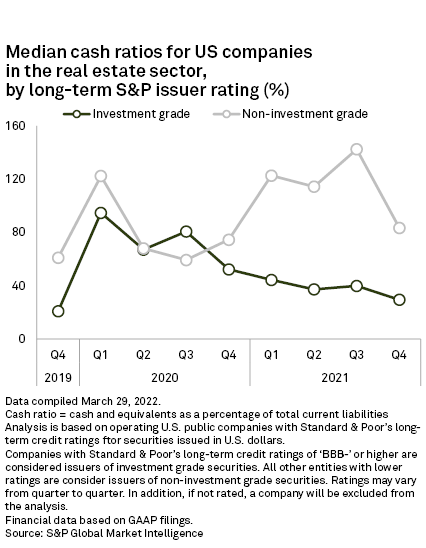
This confidence has in part been fueled by the dramatic reduction in corporate bankruptcies in 2021 and 2022. Although bankruptcies in 2020 (at the height of the pandemic) rose to the highest level since 2010, this figure dropped in 2021 to the lowest level in over a decade. It continued to fall at the start of 2022 as we reached the lowest level of Q1 bankruptcies in more than a dozen years. This tremendous reduction in bankruptcies is, of course, great news for REIT landlords who are facing fewer tenant bankruptcies as a result.
S&P Global Market Intelligence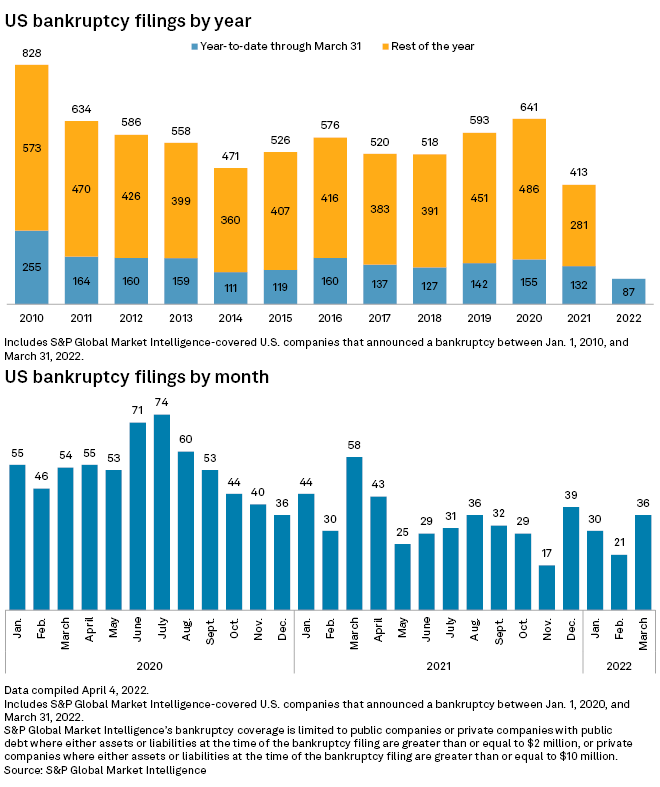
This does not, however, mean that this favorable bankruptcy trend will safely extend into upcoming quarters and years. One of the primary reasons that bankruptcies rarely happened in 2021 and Q1 2022 was the unprecedented availability of cheap debt. A business is unlikely to run out of money when lenders will happily extend them additional credit at a historically low interest rate. With the Fed likely to swiftly and continuously raise rates over upcoming quarters, lenders have already begun tightening their lending standards and significantly raising interest rates. Struggling businesses will no longer have access to cheap debt and the number of bankruptcies will eventually start trending upward as a result.
REIT fundamentals remain strong across most property types. REITs are a great inflation hedge and remain better positioned going forward than most other asset classes. However, rising cost of capital and increasing tenant bankruptcy risk are headwinds that investors should keep a close eye on as they make their investment decisions.
Be the first to comment