

DNY59/E+ via Getty Images
Background
For those interested in John and Jane’s full background, please click the following link for the last time I published their full story. Here are the key details about John and Jane that readers should understand.
- This is a real portfolio with actual shares being traded.
- I am not a financial advisor and merely provide guidance based on a relationship that goes back several years.
- John retired in January 2018 and his only consistent source of income is Social Security.
- John has begun drawing $1,000/month from his Traditional IRA to supplement his retirement income.
- Jane officially decided to retire on December 31, 2020. She is now collecting social security as her primary source of income.
- John and Jane have other investments outside of what I manage. These investments primarily consist of minimal risk and minimal yield certificates.
- John and Jane have no debt and no monthly payments other than basic recurring bills such as water, power, property taxes, etc.
John and Jane requested my help after we discovered that their financial advisor was charging excessive fees and engaging in trades that appeared to be more favorable to the advisor than it was to John and Jane. I do not charge John and Jane for anything that I do and all I have asked of them is that they allow me to write about their portfolio anonymously to help spread knowledge and to make me a better investor in the process.
Generating a stable and growing dividend income is the primary focus of this portfolio, and capital appreciation is a secondary characteristic.
Dividend Decreases
No stocks in John’s Traditional or Roth IRA put/decreased dividends during the month of September.
Dividend And Distribution Increases
Four companies paid increased dividends/distributions or a special dividend during the month of October in the Traditional and Roth IRAs.
O and WPC were covered in the Taxable Account update so I will only include information about the dividend increases. For those interested in reading the summary of these two companies the link is included at the end of the article.
Kite Realty
KRG has made a strong recovery since its dividend began growing again in September 2020. The dividend was slashed due to uncertainty from COVID but also the risk from a revamping of its business model during turbulent times. Since the Retail Properties of America (RPAI) acquisition the stock has performed well with many not giving the company the credit it deserves for the changes in its portfolio composition. KRG is an incredible turnaround story that required bold moves by management and its exposure to the sunbelt region (primarily focused on grocers) is a great business model to have when headed into a recession.
Normally I would use a ten-year FastGraphs chart but since the company has made significant changes I think a ten-year chart unfairly characterizes where the company is going by weighing too much on where it was previously. KRG has a very safe payout and has already announced its dividend increase for January’s payout also.
KRG – FastGraphs – 2022-11 (FastGraphs)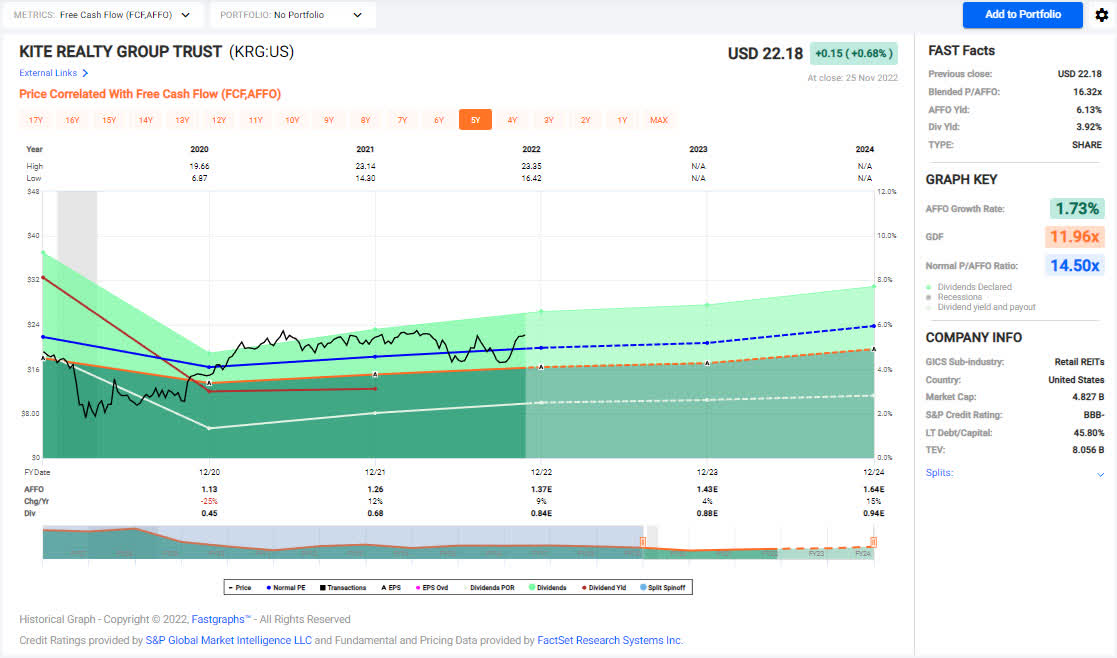
The dividend was increased from $.21/share per quarter to $.22/share per quarter. This represents an increase of 4.8% and a new full-year payout of $.88/share compared with the previous $.84/share. This results in a current yield of 4.33% based on the current share price of $22.18.
Realty Income
The dividend was increased from $.2475/share per month to $.2480/share per quarter. This represents an increase of .2% and a new full-year payout of $2.976/share compared with the previous $2.97/share. This results in a current yield of 4.59% based on the current share price of $64.85.
Bank OZK
Rising interest rates mean more interest income for banks as the net interest margin (the average rate charged less the cost of the deposits) will start to spread. The downside that impacted Q3-2022 Earnings is the increased provision for losses as higher interest rates usually result in higher charge-offs, and in OZK’s case, their increase in the Real Estate Specialties Group (RESG) continues to set record which means they have more money lent out that result in default. Luckily, loan loss provisions are one-time adjustments and if the portfolio performs well it can be a benefit to future earnings reports if that provision ended up being too much.
OZK is currently priced too high in my opinion for John’s portfolio and the better place to get in on the action would be the preferred shares since our main objective is income.
A ten year FastGraphs shows a stock price that is significantly undervalued but we have to remember that OZK prior to 2020 was a high-flying financial stock that lost half of its market value amid concerns over defaults in the RESG portfolio. A five year FastGraphs shows that the stock is currently priced about where expected.
OZK – FastGraphs 2022-11 (FastGraphs)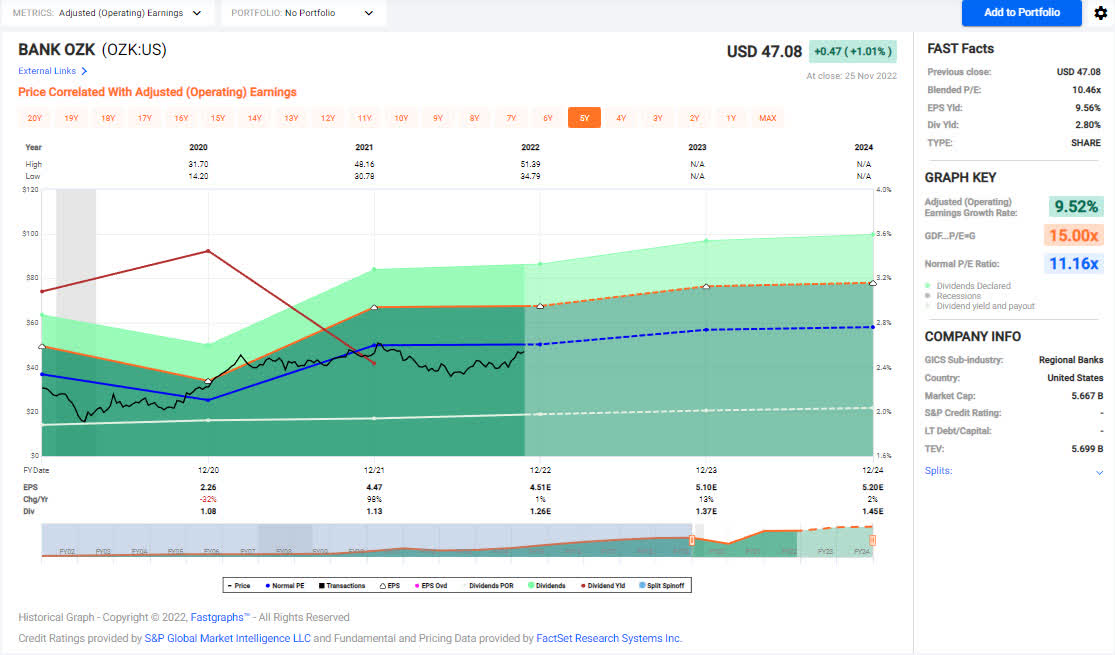
The dividend was increased from $.32/share per quarter to $.33/share per quarter. This represents an increase of 3.1% and a new full-year payout of $.1.22/share compared with the previous $1.18/share. This results in a current yield of 5.28% based on the current share price of $80.38.
W.P. Carey
The dividend was increased from $1.059/share per quarter to $1.061/share per quarter. This represents an increase of .2% and a new full-year payout of $.4.244/share compared with the previous $4.236/share. This results in a current yield of 5.28% based on the current share price of $80.38.
Retirement Account Positions
There are currently 38 different positions in John’s Traditional IRA and 23 different positions in his Roth IRA. While this may seem like a lot, it is important to remember that many of these stocks cross over in both accounts and are also held in the Taxable Portfolio.
Below is a list of the trades that took place in the Traditional IRA during the month of October.
Traditional IRA – October Trades (Charles Schwab)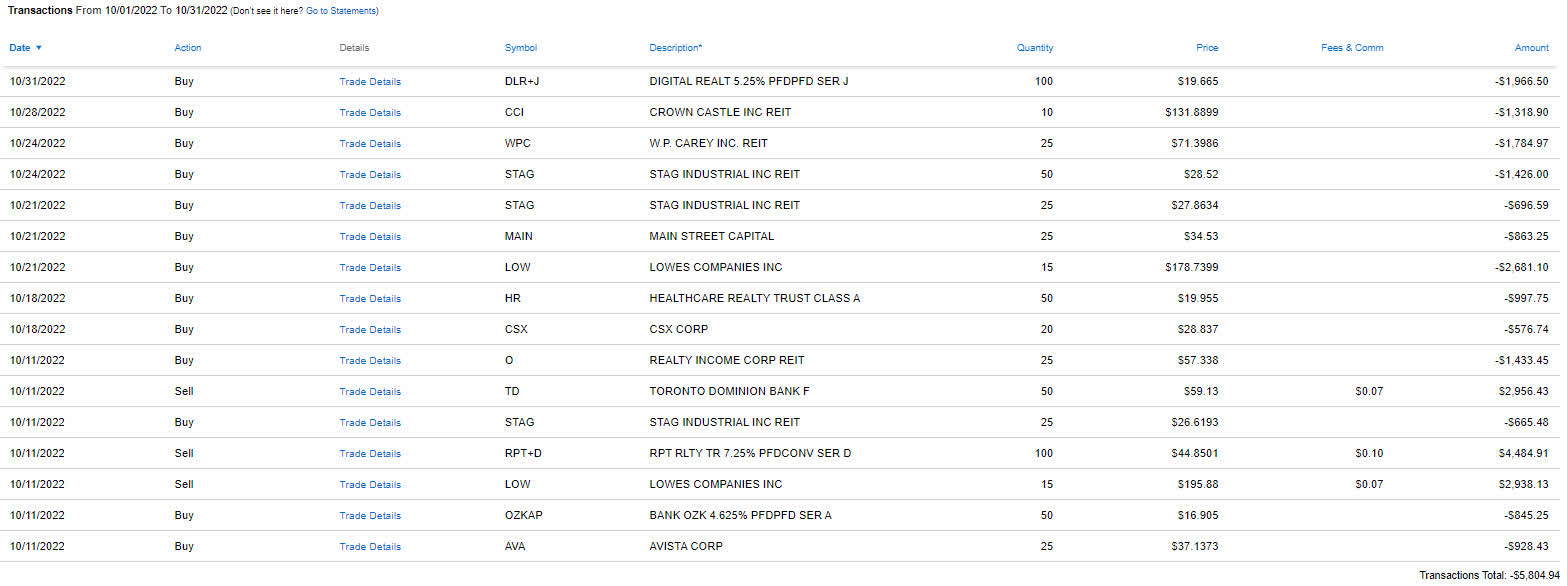
Below is a list of the trades that took place in the Roth IRA during the month of October.
Roth IRA – October Trades (Charles Schwab)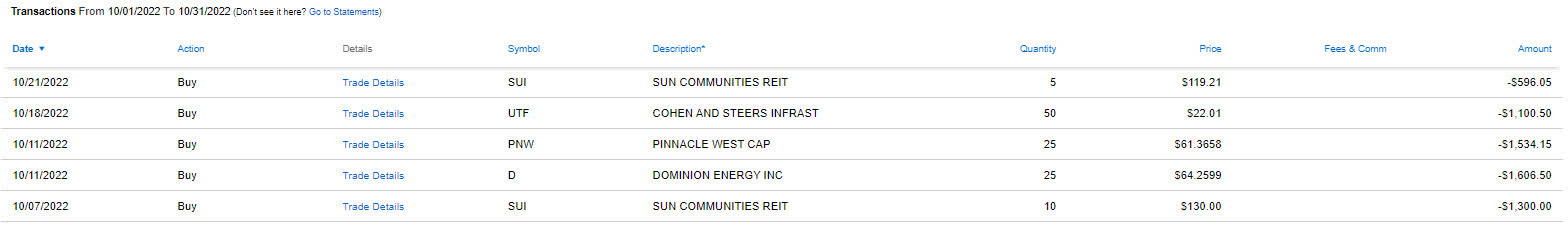
For more details/insight into these trades and the rationale please see my trades summary article through October 31 (link at the end of the article).
October Income Tracker – 2021 Vs. 2022
October’s income for the Traditional IRA and Roth IRA were up considerably year-over-year. The average monthly income for the Traditional IRA in 2022 is projected to be up about 30.1% based on current estimates, and the Roth IRA is looking to grow by an astounding 21.6% year-over-year. This means the Traditional IRA would generate an average monthly income of $1,429.16/month and the Roth IRA would generate an average income of $686.16/month. This compares with 2021 figures that were $1,098.38 and $564.25 per month, respectively. We are on track to generate approximately $5,200 of additional dividend income in 2022 from the combined dividends in the Traditional and Roth IRAs when compared to FY-2021 dividends received.
It should be noted that the huge increase in dividend income in the Traditional IRA can largely be attributed to the significant special dividend paid by Healthcare Realty (HR) that was elaborated on in the July article for John.
SNLH = Stocks No Longer Held – Dividends in this row represent the dividends collected on stocks that are no longer held in that portfolio. We still count the dividend income that comes from stocks no longer held in the portfolio even though it is non-recurring.
All images below come from Consistent Dividend Investor, LLC. (Abbreviated to CDI).
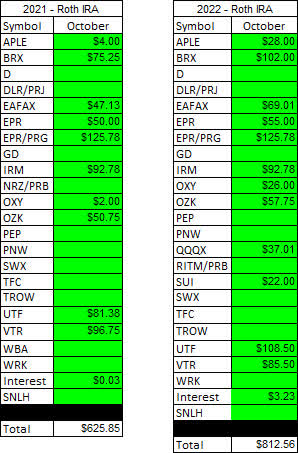
Traditional IRA – October – 2021 V 2022 Dividend Breakdown (CDI) Roth IRA – October – 2021 V 2022 Dividend Breakdown (CDI)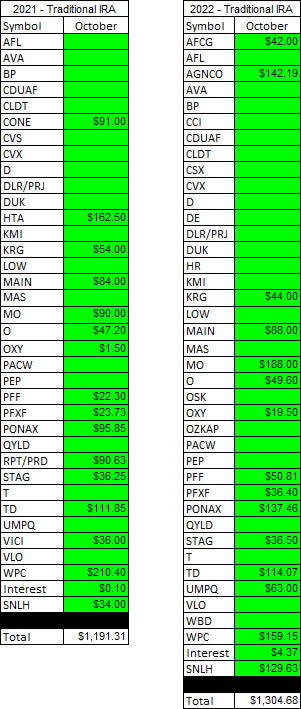
Here is a graphical illustration of the dividends received on a monthly basis for the Traditional and Roth IRAs.
Retirement Account – Monthly Dividends Received – October 2022 (CDI)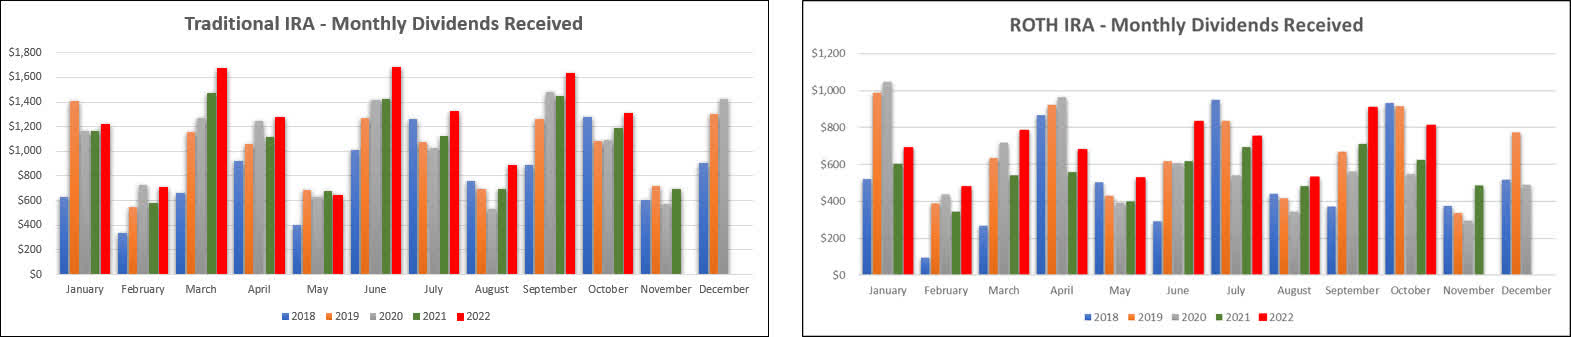
Based on the current knowledge I have regarding dividend payments and share count, the following tables are a basic prediction of the income we expect the Traditional IRA and Roth IRA to generate in FY-2022 compared with the actual results from 2021.
Retirement Projections – October 2022 (CDI)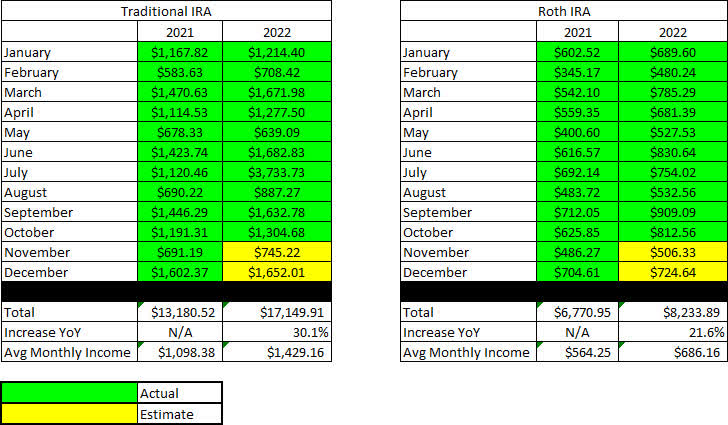
Below is an expanded table that shows the full dividend history since inception for both the Traditional IRA and Roth IRA.
Retirement Projections – October 2022 – Full Dividend History (CDI)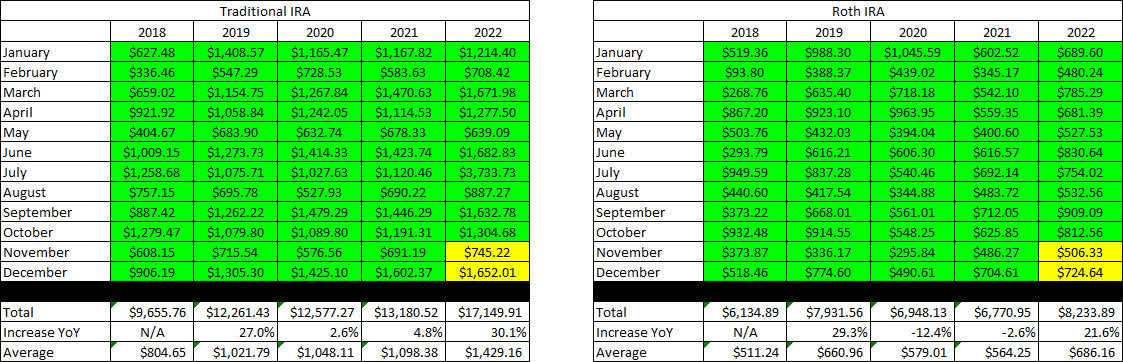
I have included line graphs that better represent the trends associated with John’s monthly dividend income generated by his retirement accounts. The images below represent the Traditional IRA and Roth IRA, respectively.
Retirement Account – Monthly Dividends – October 2022 (CDI)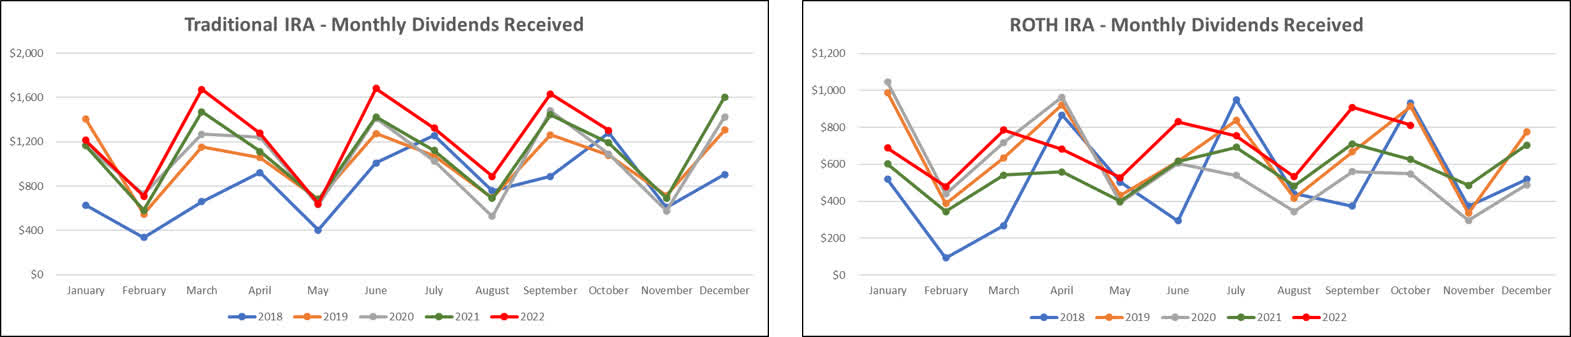
Here is a table to show how the account balances stack up year over year (I previously used a graph but believe the table is more informative).
Retirement Account – Month End Balances – October 2022 (CDI)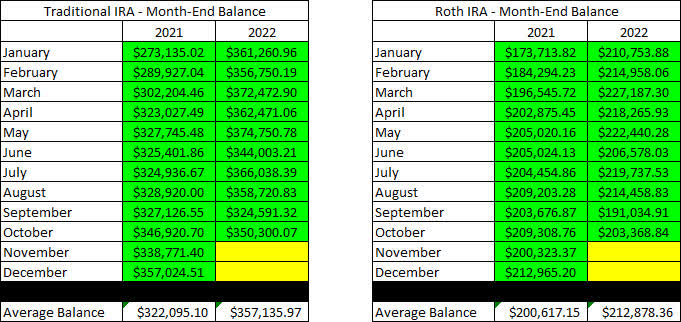
The next images are the new tables that indicate how much cash John had in his Traditional and Roth IRA Account at the end of the month, as indicated on his Charles Schwab statements.
Retirement Accounts – October 2022 – Cash Balances (CDI)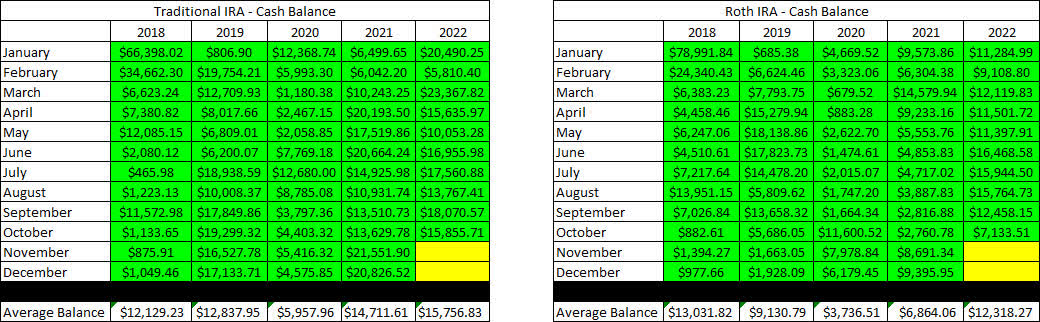
The following two tables provide a history of the unrealized gain/loss at the end of each month in the Traditional and Roth IRAs, going back to the beginning of January 2018.
Retirement Accounts – October 2022 – Unrealized Gain-Loss (CDI)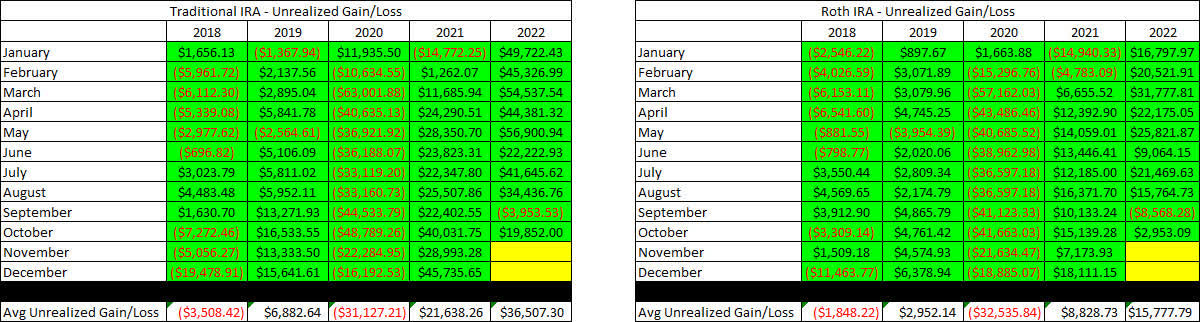
John has finally begun taking disbursements from his Traditional IRA, and he has opted to receive $1,000/month. Based on the dividend income generated he could take up to $1,400/month from the Traditional IRA before his withdrawals would start to negatively impact his principal. Our goal for John is to maintain withdrawals below the dividend income generated for as long as possible.
Traditional IRA Withdrawals – October 2022 (CDI)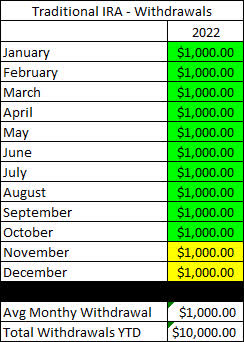
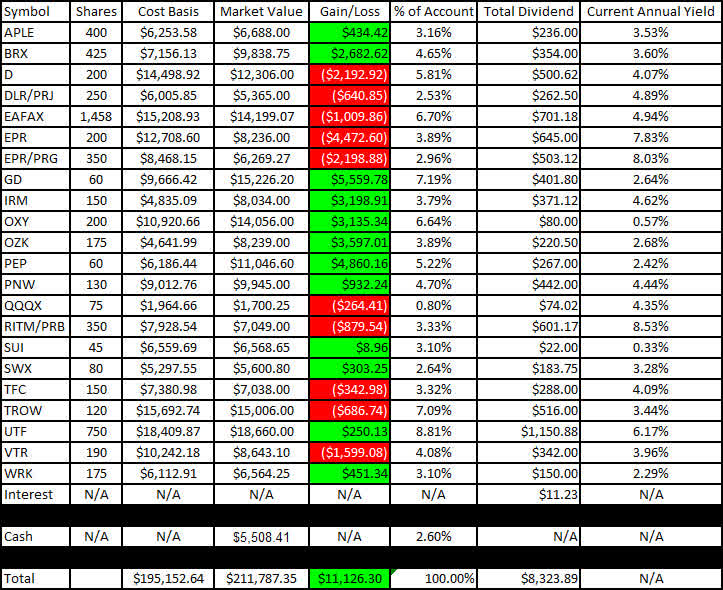
I like to show readers the actual unrealized gain/loss associated with each position in the portfolio because it is important to consider that, in order to become a proper dividend investor, it is necessary to learn how to live with volatility. The market value and cost basis below are accurate as of the market close on November 25, 2022.
Here is the unrealized gain/loss associated with John’s Traditional and Roth IRAs.
Traditional IRA – October 2022 – Gain-Loss (CDI) Roth IRA – October 2022 – Gain-Loss (CDI)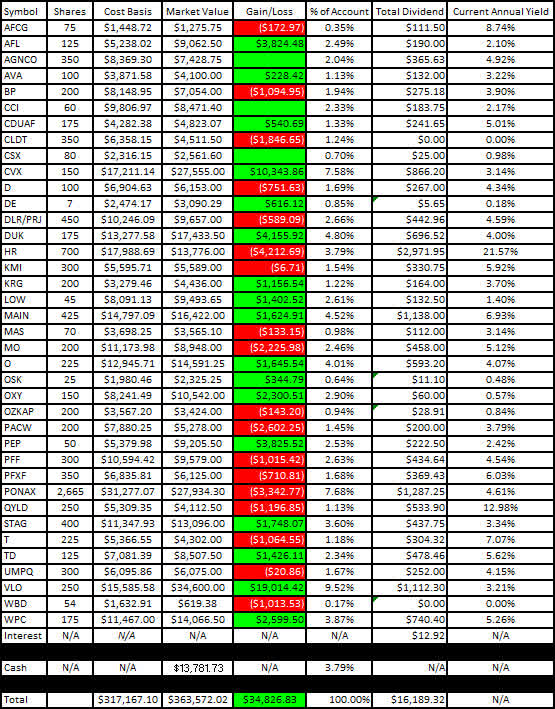
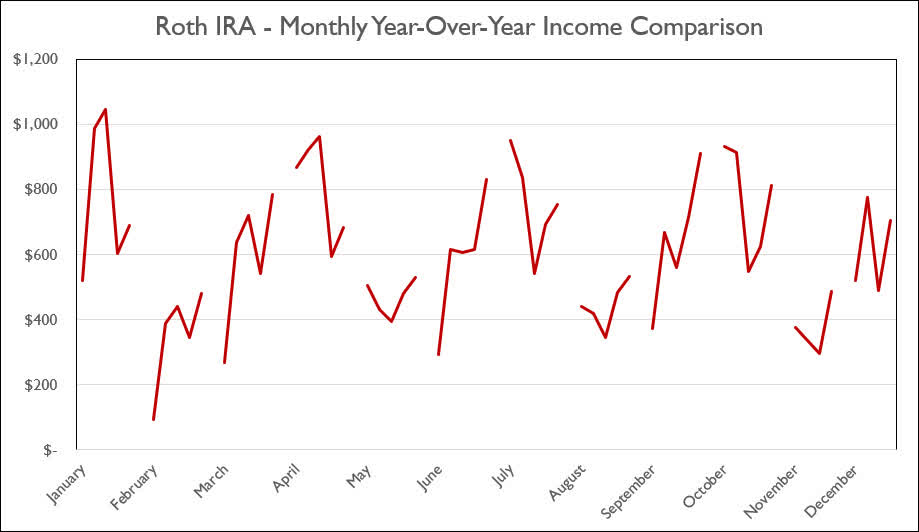
The last two graphs show how dividend income has increased, stayed the same, or decreased in each respective month on an annualized basis. Now that we are in our fifth year of tracking, the trend for each respective month of the year has begun to show interesting trends for when income increases year-over-year.
Traditional IRA – October 2022 – Annual Month Comparison (CDI) Roth IRA – October 2022 – Annual Month Comparison (CDI)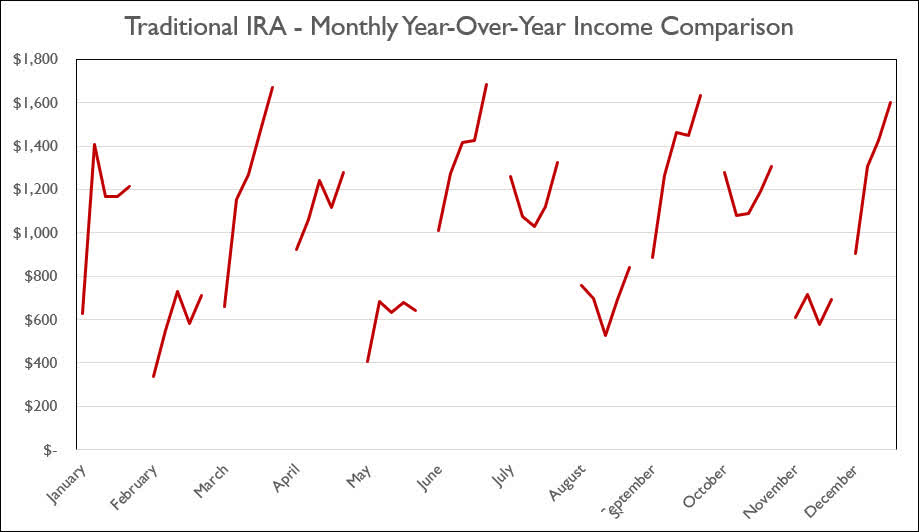
Conclusion
October’s article couldn’t be more different than September’s article as we saw a drastic increase in share prices. The transaction history shows that we were able to deploy cash at a great time and now we have put in some limit trades to sell off the high-cost shares we added.
The only sell we currently have in is for Pinnacle West (PNW) set for 30 shares at $78/share.
PNW – Cost Basis Details (Charles Schwab)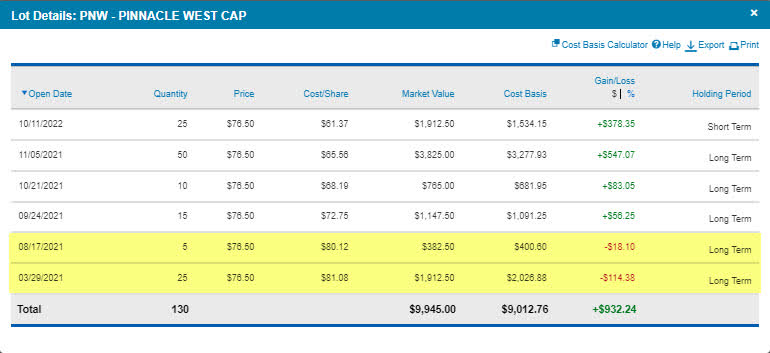
As you can see we took advantage of the October low and added about the same number of shares that we are looking to sell. This will lower the cost basis tremendously and give back the cash to reserves for future opportunities.
October Articles
I have included the links for John and Jane’s Taxable Account and Jane’s Retirement Account articles for the month of October below.
The Retirees’ Dividend Portfolio: John And Jane’s October Taxable Account Update
Article Format: Let me know what you think about the format (what you like or dislike) by commenting. I appreciate all forms of criticism and would love to hear what I can do to make the articles more useful for you!
In John’s Traditional and Roth IRAs, he is currently long the following mentioned in this article: AFC Gamma (AFCG), Aflac (AFL), Apple Hospitality REIT (APLE), Avista (AVA), BP plc (BP), Brixmor Property Group (BRX), Crown Castle (CCI), Canadian Utilities (OTCPK:CDUAF), Chatham Lodging Trust (CLDT), Chevron (CVX), CSX (CSX), Dominion Energy (D), Deere (DE), Digital Realty Preferred Series J (DLR.PJ), Duke Energy (DUK), Eaton Vance Floating-Rate Advantage Fund (EAFAX), EPR Properties (EPR), EPR Properties Preferred Series G (EPR.PG), General Dynamics (GD), Healthcare Trust of America (HTIA), Iron Mountain (IRM), Kinder Morgan (KMI), Kite Realty Group (KRG), Lowe’s (LOW), Main Street Capital (MAIN), Masco (MAS), Altria (MO), New Residential Investment Corp. Preferred Series B (NRZ.PB), Realty Income (O), Oshkosh (OSK), Occidental Petroleum Corp. (OXY), Bank OZK (OZK), Bank OZK Preferred Series A (OZKAP), PacWest Bancorp (PACW), PepsiCo (PEP), iShares Preferred and Income Securities ETF (PFF), VanEck Vectors Preferred Securities ex Financials ETF (PFXF), Pinnacle West (PNW), PIMCO Income Fund Class A (PONAX), Nuveen Nasdaq 100 Dynamic Overwrite Fund (QQQX), Global X Funds Nasdaq 100 Covered Call ETF (QYLD), STAG Industrial (STAG), Sun Communities (SUI), Southwest Gas (SWX), AT&T (T), Toronto-Dominion Bank (TD), Truist Financial (TFC), T. Rowe Price (TROW), Cohen & Steers Infrastructure Fund (UTF), Valero (VLO), Umpqua Holdings (UMPQ), Ventas (VTR), WestRock (WRK), Warner Bros. Discovery (WBD), and W. P. Carey (WPC).
Be the first to comment