

Vladislav Chorniy/iStock via Getty Images
Stocks have rallied for several days in a row for no apparent reason that makes any logical sense. The Nasdaq 100 (NASDAQ:QQQ) ETF is up nearly 17% since the March 22 intraday lows. Whether driven by short-covering and the unwinding of options positions at first or due to quarterly rebalancing, the gains are unsustainable.
The fundamental backdrop for the QQQ has only deteriorated further. Interest rates have surged higher on both a notional and real basis. It has pushed the relative valuation of the NASDAQ to very stretched levels.
Higher Rates
The yield curve has dramatically changed over the past month, with rates seeing a huge spike. The 10-year rate has risen by more than 50 bps over that time. If low rates drove NASDAQ stocks higher over the past two years, rising rates should lower the NASDAQ stocks.
Bloomberg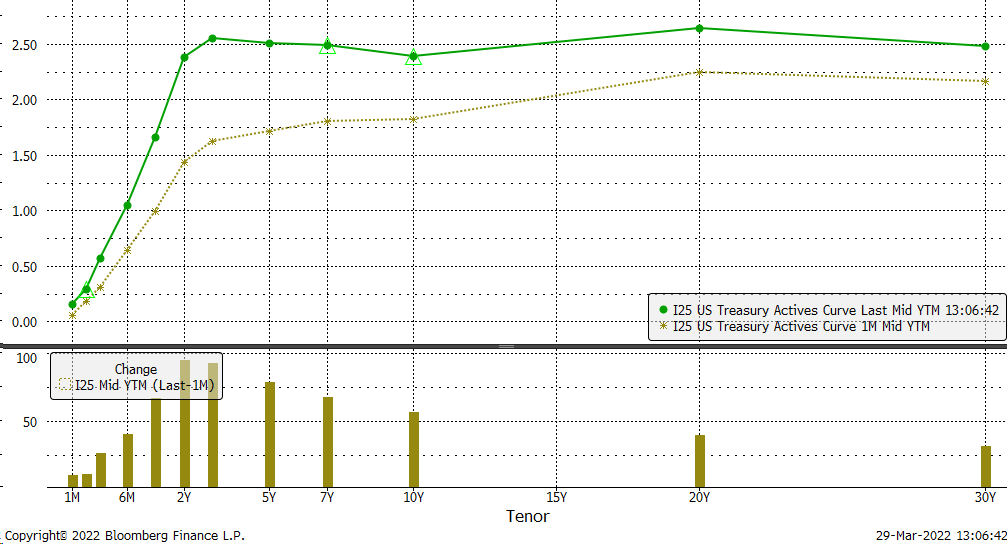
The sudden surge in rates has made the QQQ ETF more expensive relative to bond yields. The equity risk premium, or the difference between the earnings yield of the NASDAQ less the 10-year rate, is now just 47 basis points. The premium hasn’t been this low since early 2010. That makes QQQ ETF today more expensive relative to bonds than at any other point since the pandemic began over the past decade.
Bloomberg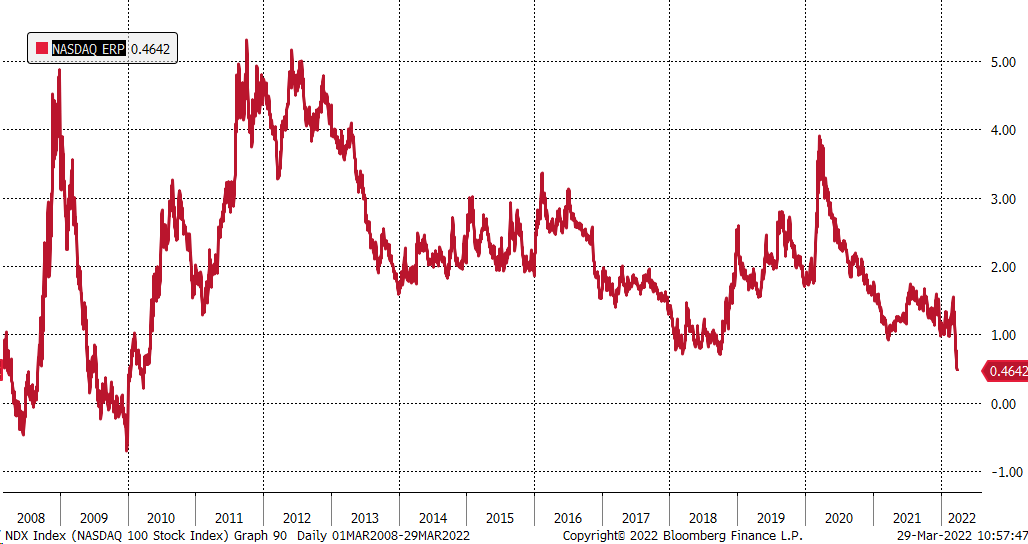
Additionally, real rates have surged off their recent lows, which is another factor likely to impact the direction of the QQQ ETF over the longer term. The QQQ ETF rose dramatically as real rates plunged following the pandemic’s start. But now, as the Fed aims to tackle inflation and pushes forward with raising rates, real rates should only push higher.
The 5-year TIP (real) rate plunged, and inflation expectations moved sharply higher due to the Ukraine war as oil prices surged. But through the combination of tighter monetary policy and now falling oil prices, inflation expectations should decrease over time, allowing the 5-year TIP rate to push higher towards 0%.
Since November 2018, the QQQ ETF has followed real rates. The chart below shows the relationship between the QQQ ETF and the iShares TIPS Bond ETF (TIP), a proxy for real rates. When the TIP ETF is rising, it signals real rates are falling, and when the TIP is falling, it signals that real rates are rising. It seems unlikely that the relationship between the QQQ and TIP ETFs has broken down at this stage of the game, but more likely, the QQQ ETF has wandered too far away from real rates, and the QQQ will need to revert.
Bloomberg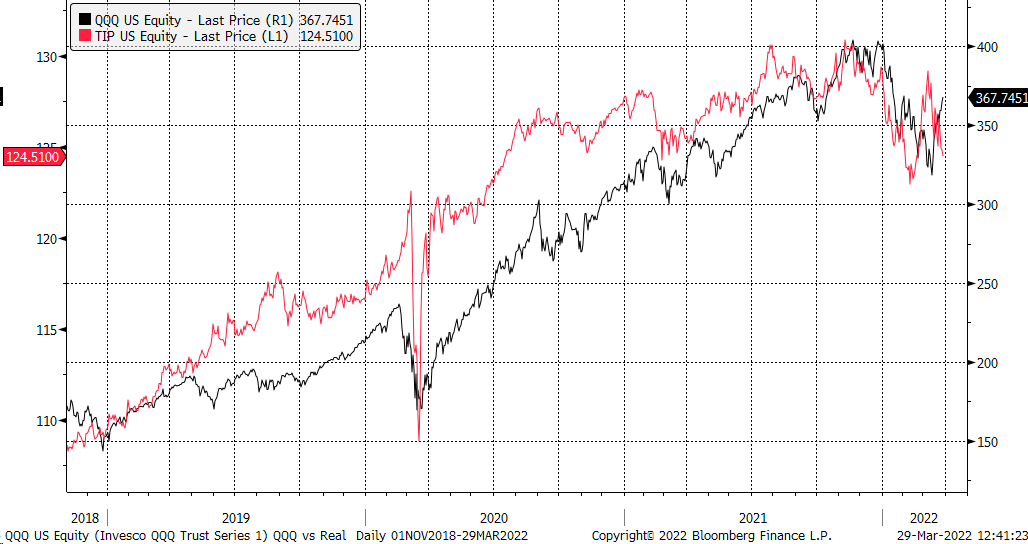
Higher PE, Slower Growth
The move higher in the market has also pushed the NASDAQ’s PE ratio back to 26.1 for the next four quarters, above the pre-pandemic levels again. Historically the NASDAQ typically has traded with a PE ratio of around 21.
Bloomberg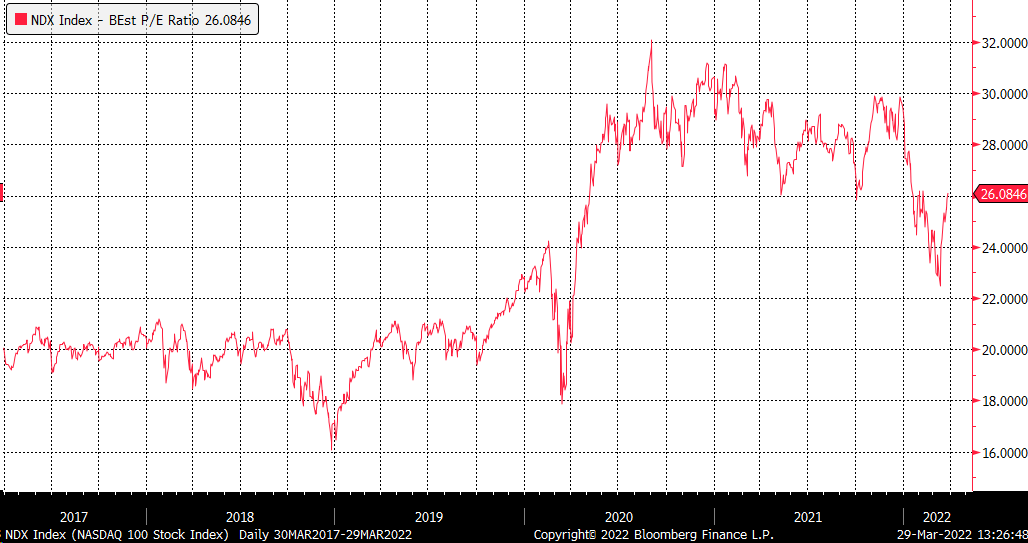
The PE ratio is essential, especially when considering that the long-term earnings growth rate is forecast at 12.3%, and not any more substantial than where growth expectations were in 2019. What is interesting about 2019 is that the 10-yr rate was lower than the current rate. Real rates were higher on the 10-yr TIP at the time, hovering around 0%, but if the Fed intends to get inflation, then real rates will need to rise.
Bloomberg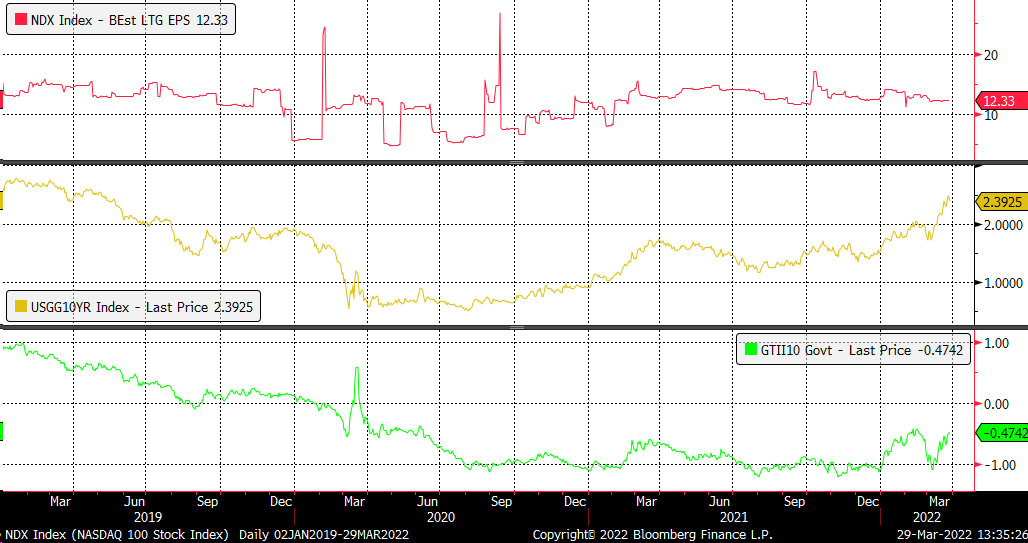
While markets can remain illogical for some time, this market certainly has for a very extended period. The more recent rally seems unlikely to see a significant extension given the move, higher interest rates, and erosion it should have on the equity risk premium and the PE ratio in a slower growth environment.
Investing today is more complex than ever. With stocks rising and falling on very little news while doing the opposite of what seems logical. Reading the Markets helps readers cut through all the noise delivering stock ideas and market updates, looking for opportunities.
We use a repeated and detailed process of watching the fundamental trends, technical charts, and options trading data. The process helps isolate and determine where a stock, sector, or market may be heading over various time frames.
To Find Out More Visit Our Home Page

Be the first to comment