

By John R. Mousseau, CFA
The municipal bond market has suffered one of the most dramatic back-offs it has ever seen; and it was accomplished in about nine business days. The rise in yields has been dramatic and fierce and had lots of elements to it. This is a quick synopsis of some of the muni meltdown.
As of Monday, March 9th, closing AAA yields for the muni market from Friday, March 6th, were as follows.
Here is the closing from March 19th. Clearly, the muni/treasury ratios became grossly distorted, particularly on the short end, and yields on things other than AAA bonds were even cheaper.
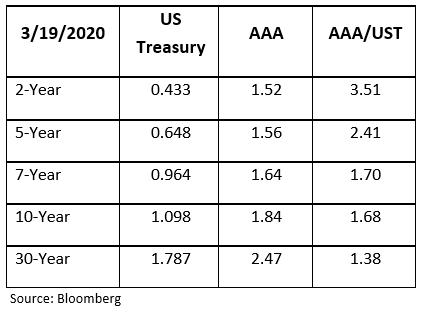
As we all walked in the door on Monday morning, March 9th, 30-year US Treasury prices were up 9 points, and bond yields were down below 1 percent.
GIP 30-Year Yield from March 9
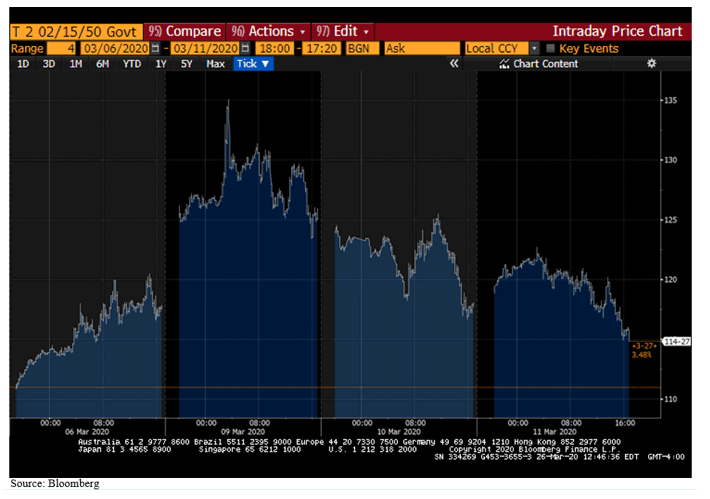
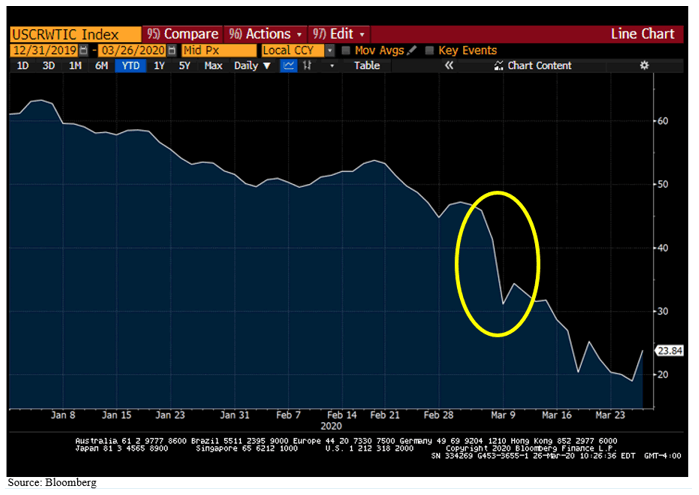
The culprit was oil prices, which fell as the emerging coronavirus pandemic slowed worldwide growth and reduced the demand for oil. We know that Saudi Arabia was aggressively selling oil and buying US Treasury bonds as a safe haven.
WTI Spot Oil from March with Emphasis on March 7-10
Tuesday, March 10th
The meltup of Treasury prices had a terrible effect on most Wall Street dealers who could no longer hedge positions. Those kinds of movements meant that dealers could lose huge sums on even relatively small positions if they hedged. The result of that is that dealers pulled in their bids for corporate and municipal bonds or just gave throw away bids or no bids.
The next culprits are the bond evaluation services that price bonds daily for custodians, brokerage firms, mutual funds, private account managers, etc. The services use only the small proportion of the actual bonds that trade, plus dealer quotes, to construct a matrix of pricing based on coupons, maturities, ratings, call features etc. So, prices are essentially extrapolated from the few bonds that have traded, along with dealer quotes. With bids, dealer quotes, and industry scales being pulled back or non-existent, the evaluation services essentially took a meat-ax to previous prices. After the 2008-09 market crash, evaluation services took a lot of heat from regulatory agencies for keeping evaluations too high on bonds in general and on high-yield bonds in particular. So, now, they take the opposite approach and take the flamethrower to prices.
Bond Funds
Bond funds have had enormous growth in 2019.
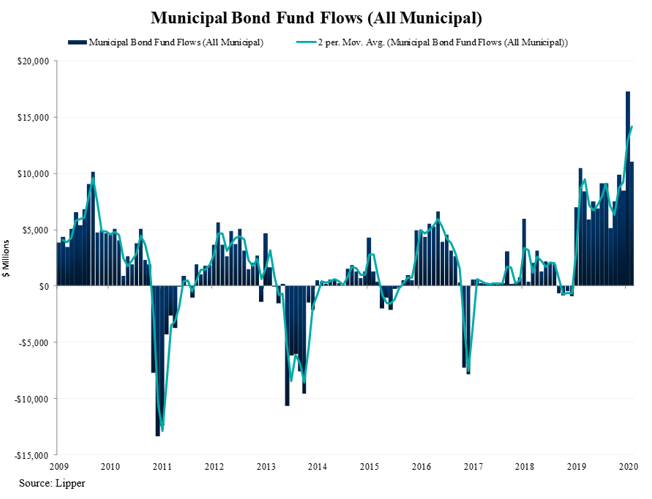
Daily Municipal Fund Flows
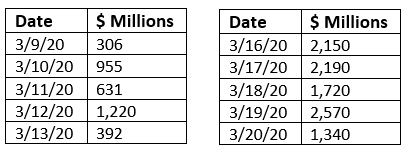
The upper chart shows the bond inflows and outflows over the past dozen years. Years with big inflows push markets higher, and years with big outflows have the opposite effect. The one thing we do know is that huge inflows like the ones we saw in 2019 (and other years) are the kindling for market meltdowns – as we have seen in 2008 (post-Lehman Brothers bankruptcy), 2010 (Meredith Whitney credit scare), 2013 (Taper Tantrum,) and 2016 (Trump election). The mechanics of all of these bond fund selloffs are similar to others. There is an initial drop in NAV (Net Asset Value), which begets redemptions. The redemptions force bond sales into a declining market, pushing prices down, which in turn lowers NAVs further, which forces yet more sales, and so on, in a negative feedback loop for bond fund investors.
The bottom chart shows the hemorrhaging of the municipal bond fund over the last 2-week period, from March 9th to March 20th, and has continued this week but to a lesser extent.
Effect on Muni Yields
It was nothing but a straight shot up across the board.

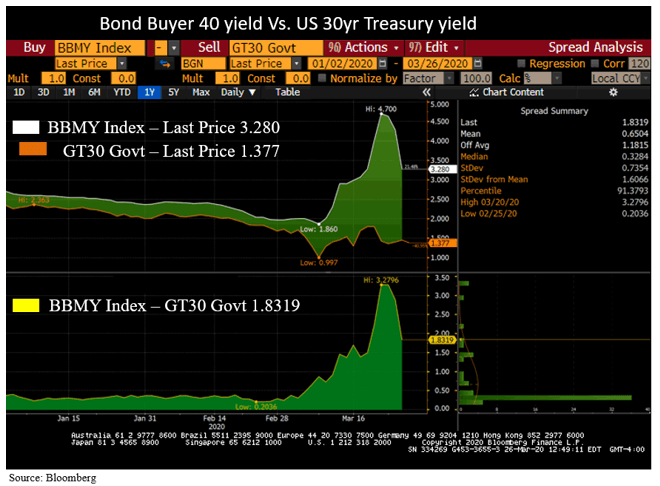
The jump in yields was across the board and was not limited to the long end. We have seen that firsthand here at Cumberland, as 3- to 4-year maturity bonds were jumping just as long bonds did. You can see that there is some recovery this week. The other chart shows both the long Treasury yield as well as the Bond Buyer 40 (long-maturity bonds) yield. Earlier this year, we had seen long-maturity muni yields move almost to Treasury yields by virtue of the demand fueled by the tax bill of 2017. That tax bill took away the federal deduction for state income taxes and local property taxes and left tax-free munis as one of the only ways to actually shelter income. This connection came apart violently as the bond funds unraveled.
What is the Outlook?
Muni Feast or Famine
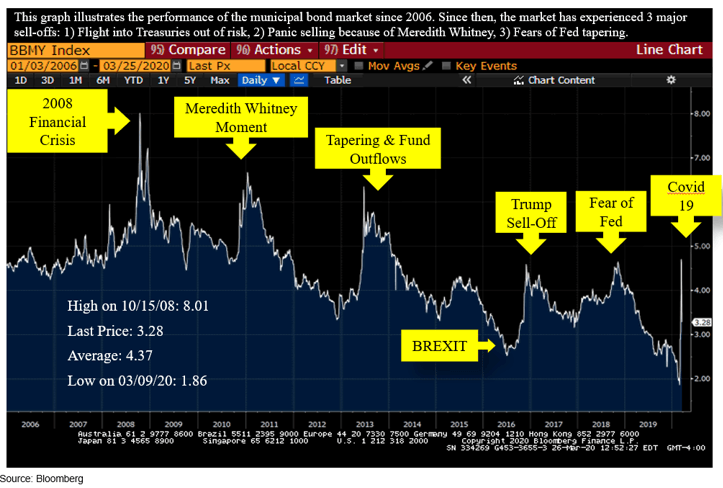
Here is a chart we call “Muni Feast or Famine,” showing the muni-outflow crisis of the past dozen years. One similar pattern is that the upheaval in yields is sharp in all cases. The repair tends to be more gradual, but the important thing is that yields DO repair. We expect this to happen again as we start to get stability in markets.
What’s the Impact on Municipal Credit?
Clearly, there are stresses on municipal credit across the board. The essentiality of services looks different through the prism of the COVID-19. Rapid transit-, airport-, and subway-backed bonds will all see thinner debt-service coverage. State and local governments will also face stresses. Local property-tax-based bonds tend to hold up longer since property taxes are already paid, and they are stable. Bonds backed by income taxes clearly will be more volatile from a debt-service-coverage standpoint. Will debt service coverage become thinner? Absolutely. Will there be rating downgrades on bonds? Certainly, we expect to see some. Do we expect to see massive defaults? No. First, the economy was in very good shape heading into the COVID-19 event. Second, we expect the economy to be back at work within a couple months. And we expect the pent-up demand to be ENORMOUS.
There may be SOME interruptions of debt service on some credits. We would also expect to see resumption of debt service as soon as the entities are functioning again. In the worst economic period in this country, the Great Depression, about 1,700 municipal entities actually stopped payment on their debt. All but a handful resumed payments and paid off debt in arrears. That is because of the monopolistic powers of municipalities and the essentiality of the services they provide.
What is Cumberland Doing?
We are trying to add longer bonds to the portfolio for the first time since 2018. A 3.5% to 4% yield on longer tax-free bonds represents a 5.5% to 6.35% taxable equivalent yield at today’s tax rates. This yield compares to the 30-year Treasury bond, which stands today at 1.35%. We think that, over time, Treasury yields will rise as both record monetary and fiscal stimulus hit the economy – and as yields on instruments other than Treasuries begin to come down.
Editor’s Note: The summary bullets for this article were chosen by Seeking Alpha editors.
Be the first to comment