

Pgiam/iStock via Getty Images
We believe in the theory of contrary opinion and the Sentiment King focuses on studying and measuring investor sentiment. Our entire series of articles covers this subject in various ways.
This is a follow-up to the September 12th article titled, “The Master Sentiment Indicator Continues to Point to Higher Prices” Since that article was published the market, as measured by the S&P 500 SPDR ETF (SPY), is down 8.9%.
The MSI
The Master Sentiment Index is a composite indicator made from eight sentiment indicators and the theory and components behind it are explained in the latter half of this article. (We recently expanded the number of components from seven to eight).
Below is a 16-year chart of the Master Sentiment Index plotted against SPY. The data is as October 23rd.
Long Term View of the MSI (Michael McDonald)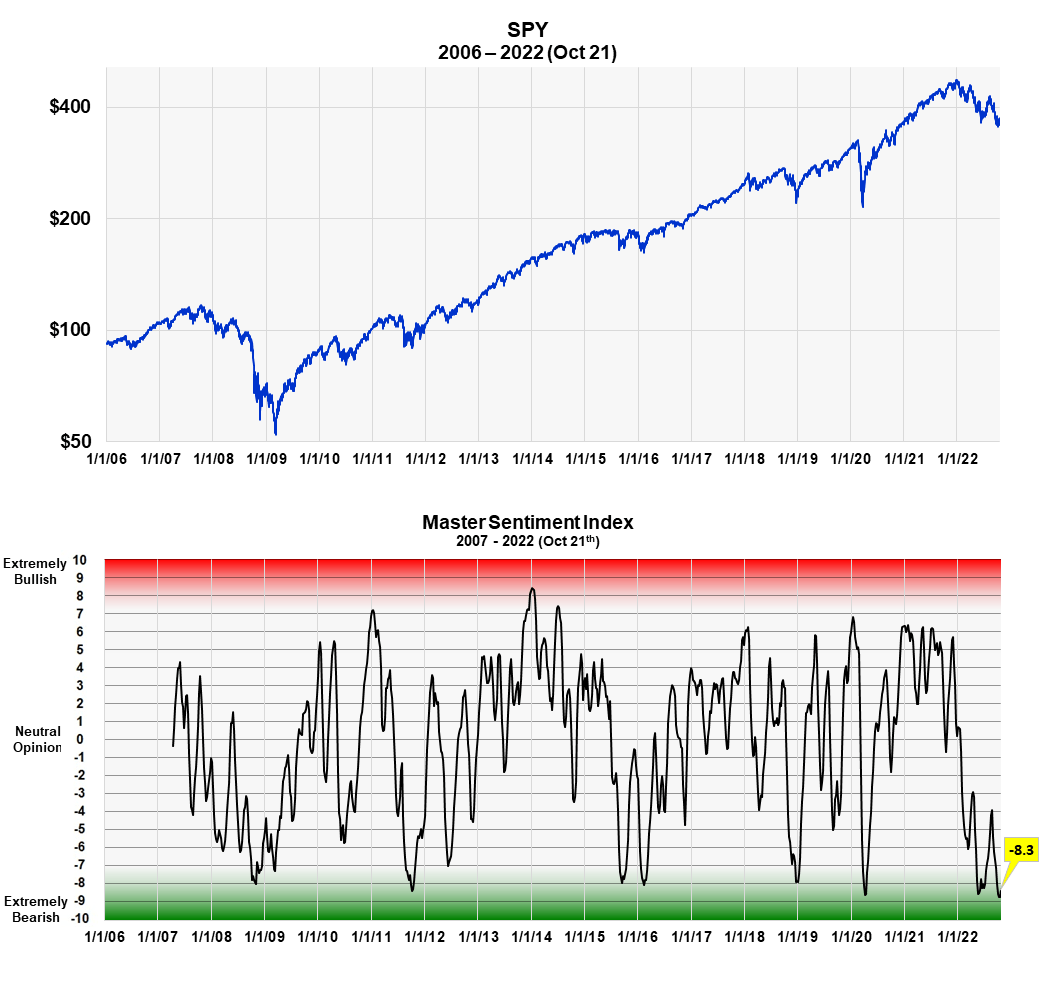
MSI is designed to signal long-term trends; it is not a short-term indicator. As the graph shows it is currently at -8.3%, which is one of the most extreme readings in history. If you are a contrarian, this is what you want to see at a bear market bottom.
The MSI is based on the theory of contrary opinion, which holds that market bottoms occur when there’s extreme levels of bearish sentiment and tops when there’s extreme bullish sentiment. The master sentiment indicator is our way to measure sentiment and these extreme moments.
From the graph it is easy to see the correlation between major market bottoms and extreme levels on this index. It clearly shows the extreme bearish readings in June and now. These readings are comparable to the extreme readings at every major market low of the last 15 years, including the financial crisis of 2008 and the pandemic bear market of 2020.
Why form a Master Sentiment Indicator?
Sentiment indicators work better at locating bear market bottoms than bull market tops. However, no one indicator always works best; one or two seem to work better in some markets than others. So, it became important to see if the various indicators could be combined into one composite indicator in a logical and mathematically consistent way.
Combining individual sentiment Indicators to form a Master Sentiment Index
Combining multiple indicators to form one sentiment indicator is not easy. How do you combine a puts and calls ratio of 1.0 with a 40% Investors Intelligence bearish percent? Everything has to be mathematically consistent. We accomplished it in the following way.
We compute a moving average of each indicator that we believe reflexes a long-term value. We take each moving average back as far as history allows (the smallest time period being 17 years) and determined the range of values that contained the highest 5% of values. Then we determined the range of values that contained the next highest 5%. This procedure was continued in 5% increments down to the 5% band that contained the smallest values. This activity allowed us to put every indicator on the same 21 range scale which was labeled 10 to -10.
We then added each indicator’s position number (10 to -10) and divided the total by the number of indicators in the composite. Out comes a composite number between 10 and -10 that represents the average bracket value of all the sentiment indicators.
Shorter Term View of the MSI (Michael McDonald)
The chart above is the same as the long-term chart but plotted from 2018 to present, so it shows the last few years in greater detail.
The MSI Components
The MSI is composed of our statistical ranking of eight classic sentiment indicators:
- CBOE Total Puts and Calls Ratio
- CBOE Equity Puts to Calls Ratio
- The CME Commitment of Traders data on the S&P futures
- Buying in the ProShares S&P 500 Inverse Fund (SH)
- NAAIM Exposure Index (National Association of Active Managers)
- Hulbert Rating Service (Stocks)
- Hulbert Rating Service (Nasdaq)
- The AAII Sentiment Survey
We take the raw data from each indicator and form a specific moving average that we believe best reflexes a long-term view, then rank and combine them using our own ranking system.
This is our current ranking on each indicator and the MSI composite made from combining them.
The MSI and a Table Ranking Its Components (Michael McDonald)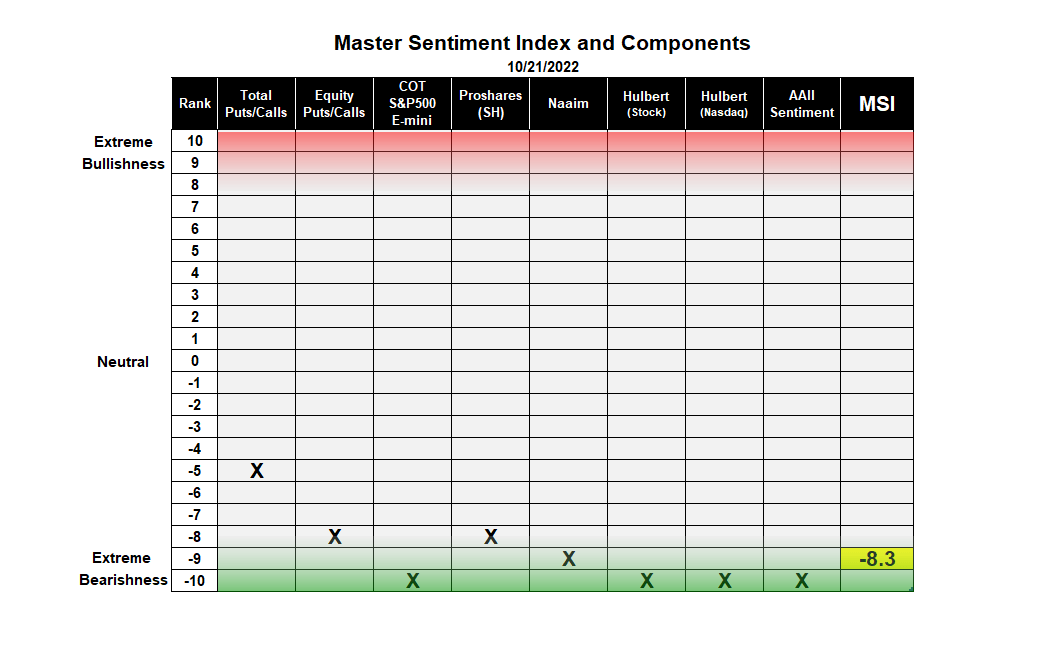
An Important Caveat
While I’m not so worried about the American economy dragging the stock market much lower, I am worried about a global financial crisis doing it, triggered by the actions of narrow-minded central bankers focused on just their own economy. While central banks are looking after their own economies, no agency is looking after the well-being of the entire global financial system. This is a serious issue, which I explain in the second half of the article (here) I wrote on the Puts and Calls ratio.
Be the first to comment