

wergodswarrior/iStock via Getty Images
Inflation data over the past two days have been extremely hot. It certainly didn’t stop bond yields from falling, and while that may seem incredibly strange, maybe even stupid to some, it makes perfect sense.
The big story from the past two days was not the hot inflation data; that was obvious. It was that real wages have trailed inflation rates for 12 straight months. Real weekly earnings fell by 3.6% y/y in March, which was the worst reading in the series since 2006. The underlying real weekly wage index shows that gains consumers saw at the beginning of the pandemic when wages rose and inflation collapsed are gone.
Essentially, all the purchasing power that consumers gained during the pandemic has been erased, and now the consumer finds their dollars buying fewer goods. However, there is a clear trend of higher and higher prices working their way into the economy at the current pace. It seems likely it weighs more on real wages, and, in the end, those real wages are likely to find themselves either back to or potentially below where they stood before the pandemic.
Bloomberg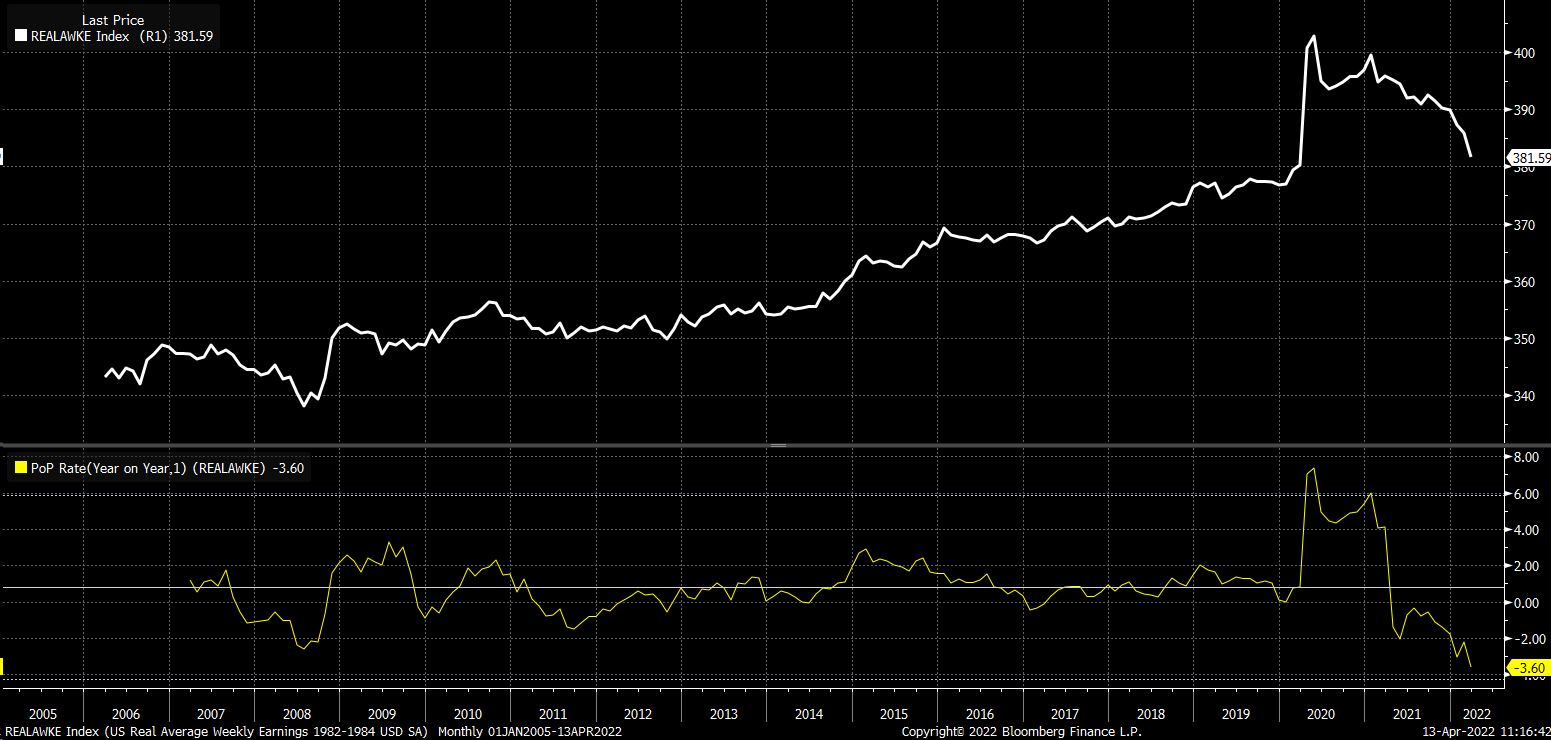
The decline in wages is a real concern, and it should be. It is also a good reason why consumer sentiment is weak. The University of Michigan consumer sentiment index is currently at 59.4, historically at the very low end of the range and in a territory typically accompanied by a recession.
Bloomberg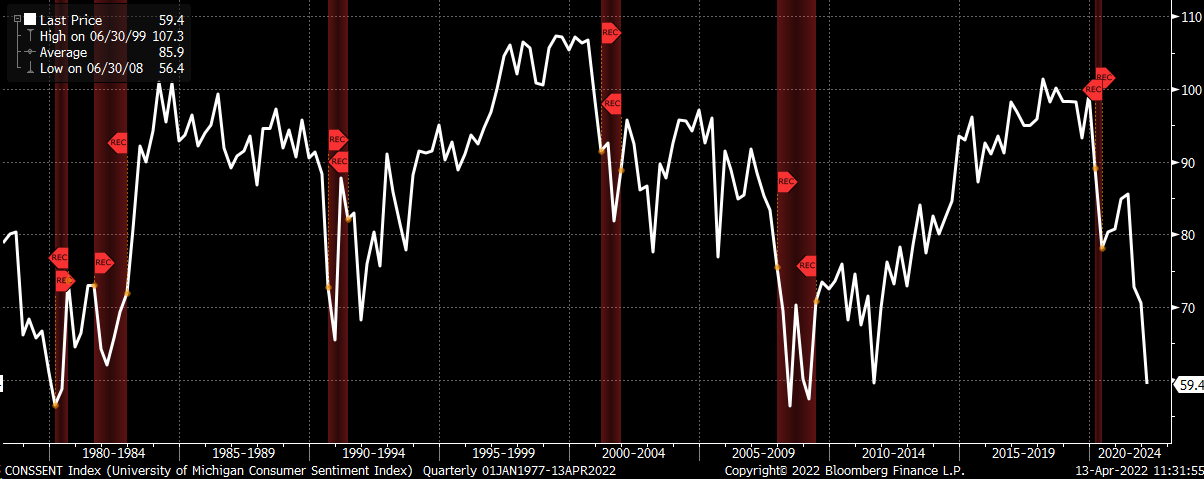
What the bond market appears to be pricing in here is the risk that the Fed’s inability to get inflation under control sooner will lead to a short-lived rate-hiking cycle. The bond market is taking rate hikes away from the future because the market sees the odds of a recession increasing.
Over the past two days, the Fed Funds futures have fallen by 26 bps for the June expiration date and more than 30 bps for the August expiration date. Notice that the declines in the expected rate hikes for the Fed Funds rate grow larger over time as rate hikes get priced out.
Bloomberg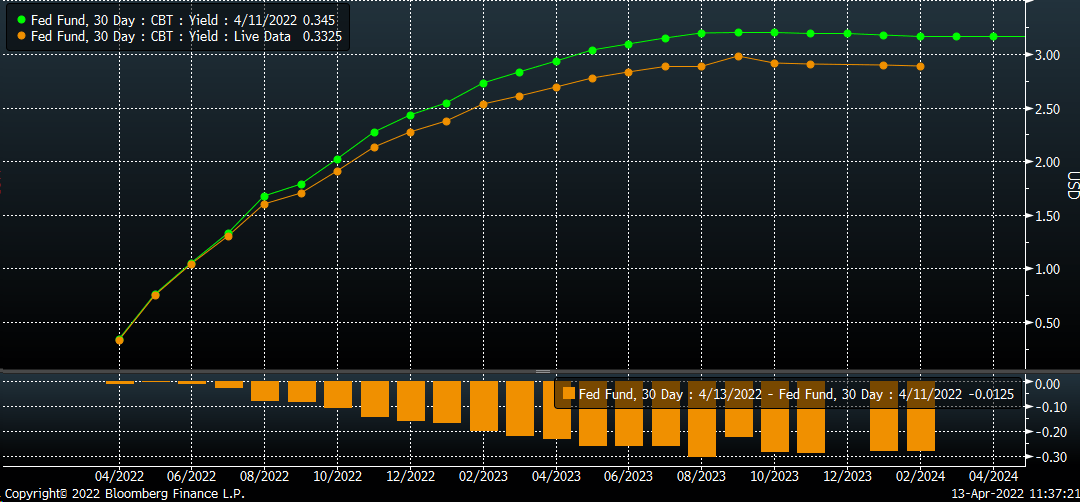
The spread between the December 2022 and December 2023 Fed fund futures has declined to 68 bps from 80 bps on April 8, a fairly sizeable drop in a short time.
Bloomberg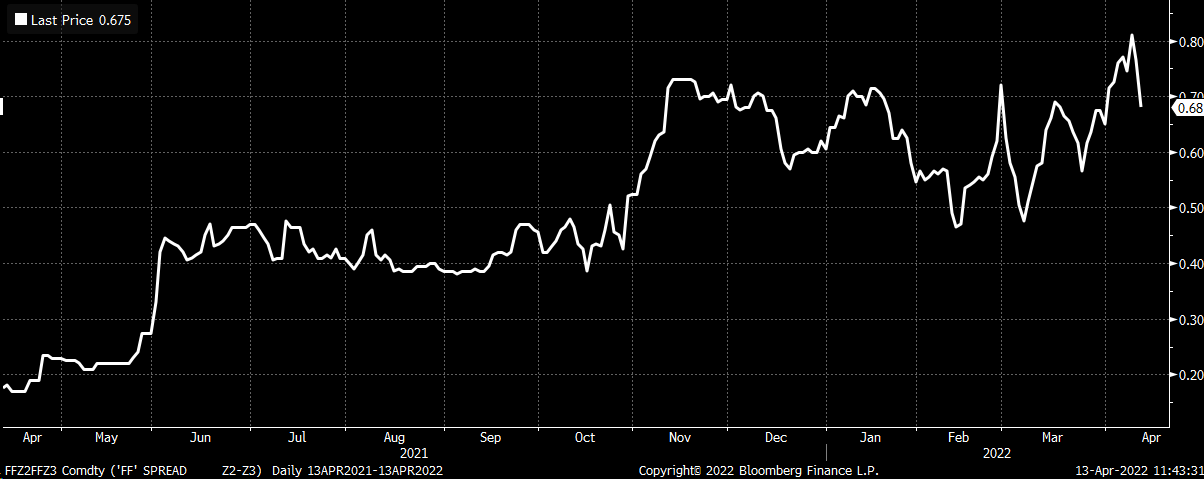
What also appears to be happening is that the yield curve is suddenly steepening very quickly after inverting just two weeks ago. The spread between the two-year and 10-year is now 35 bps, up from -8 bps on April 1. It could mean nothing, but recessions in the US typically occur as the yield curve steepens and the market begins to price in a Fed easing cycle.
Bloomberg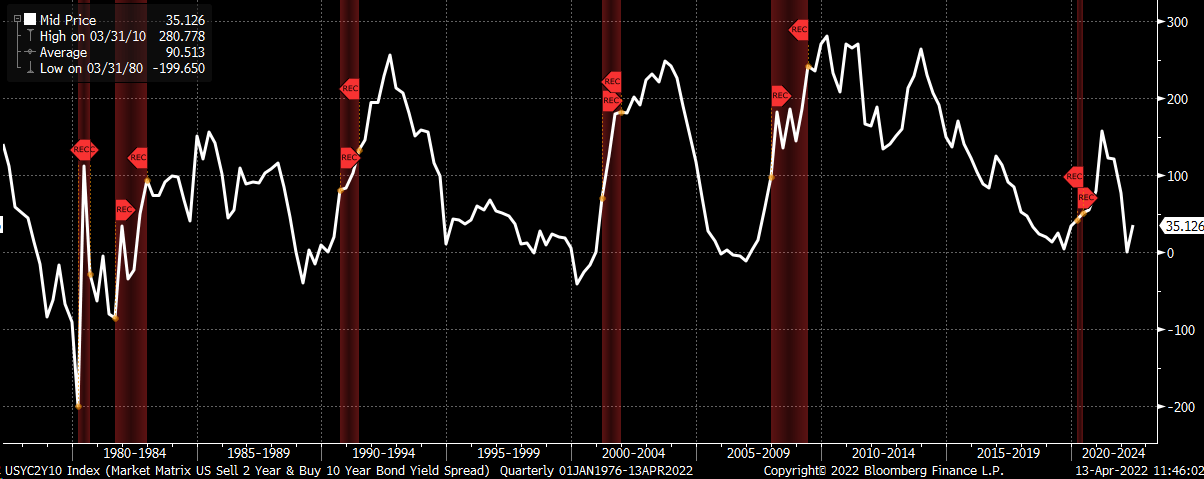
It could very well be that the market isn’t as dumb as it seems and that perhaps the market is telling us that a recession may very well be here or on our doorsteps. The bond market also sees inflation expectations beginning to drop. The 10-yr breakeven inflation rate fell to 2.82%, down from 2.98% in March.
Bloomberg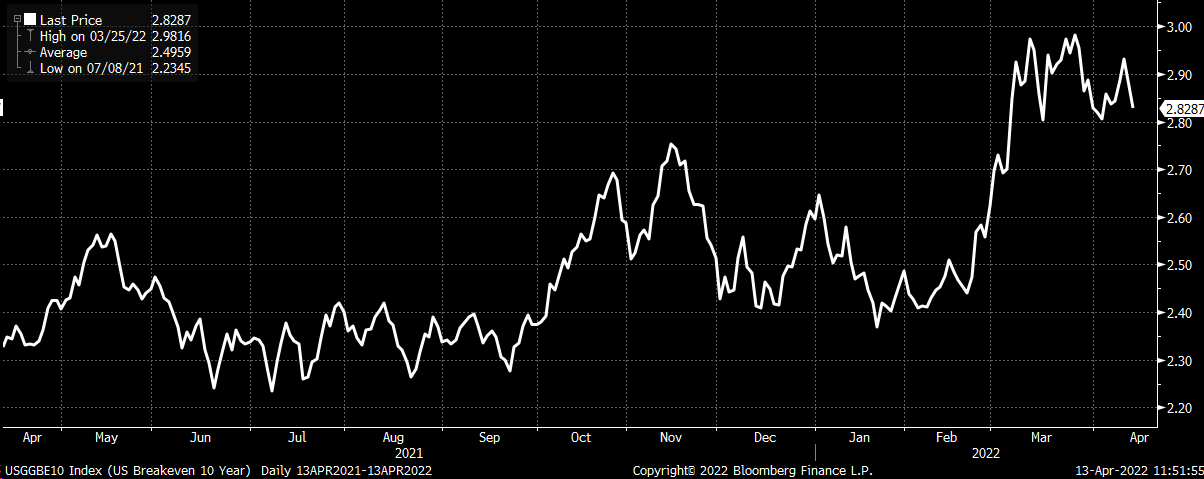
To this point, the decline in the breakeven inflation rate has resulted from nominal yields falling to real yields. That spread widened dramatically throughout most of 2021, with the 10-yr nominal rate rising and the 10-yr TIP rate trading mostly sideways. But that trend is likely to reverse going forward, with the 10-Yr TIP rate catching up to the nominal rate. It could play out either by the TIP rate rising faster than the nominal rate, pushing the breakeven inflation expectations down, or the nominal rate falling more quickly than the 10-year TIP rate.
Bloomberg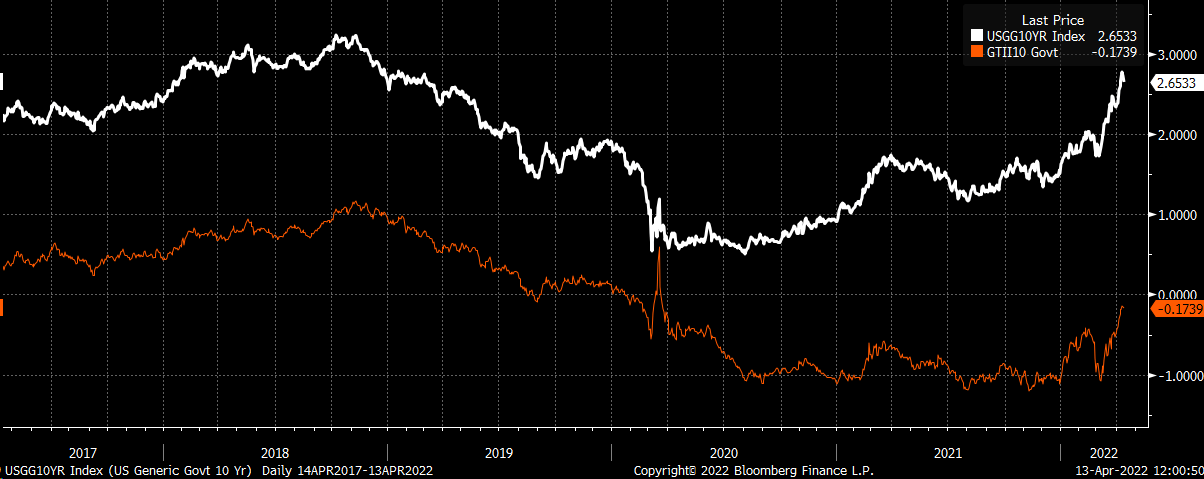
But what is clear is that, at this point, the market is pricing in a few rate hikes in 2023, not rate cuts. So that would suggest that the Fed continues to raise rates in the coming months, which means it is much more likely that the 10-yr TIP rate will rise faster than the 10-Yr nominal rate.
Suppose it is the case that the market is pricing-in lower inflation expectations and now is thinking about the increasing odds of a recession due to consumers losing purchasing power. In that case, it should end badly for stocks.
Historically, as the yield curve steepens following an inversion, stocks suffer the greatest as the market begins to price in a recession.
Bloomberg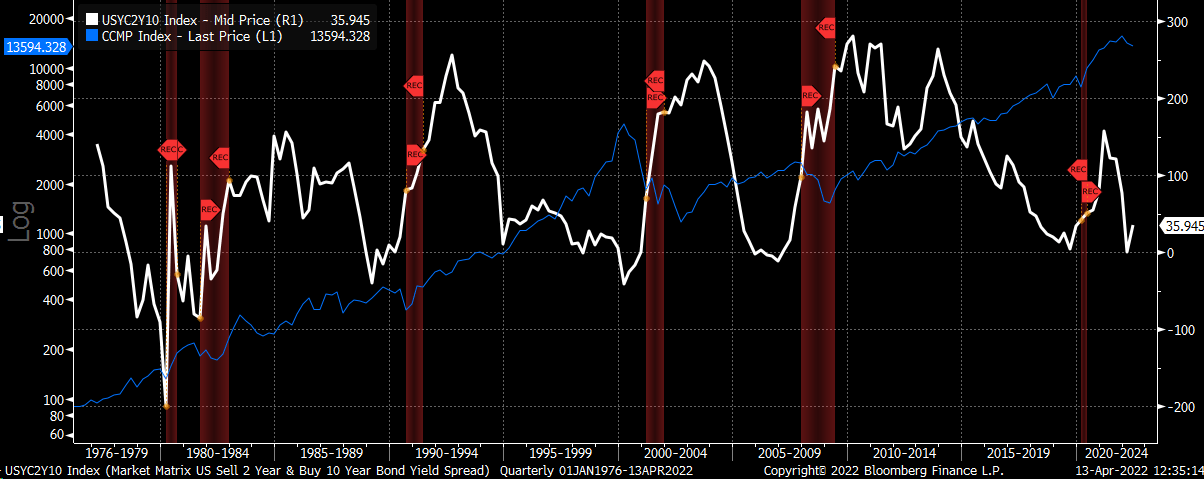
Additionally, higher real yields will hurt the valuation of stocks. The NASDAQ Composite has been highly correlated to the TIP ETF since the fall of 2018. A rising TIP ETF represents falling real yields, and a falling TIP ETF represents increasing real yields. A falling TIP ETF and rising real yields should pressure the NASDAQ as futures earnings get discounted to lower values today.
TradingView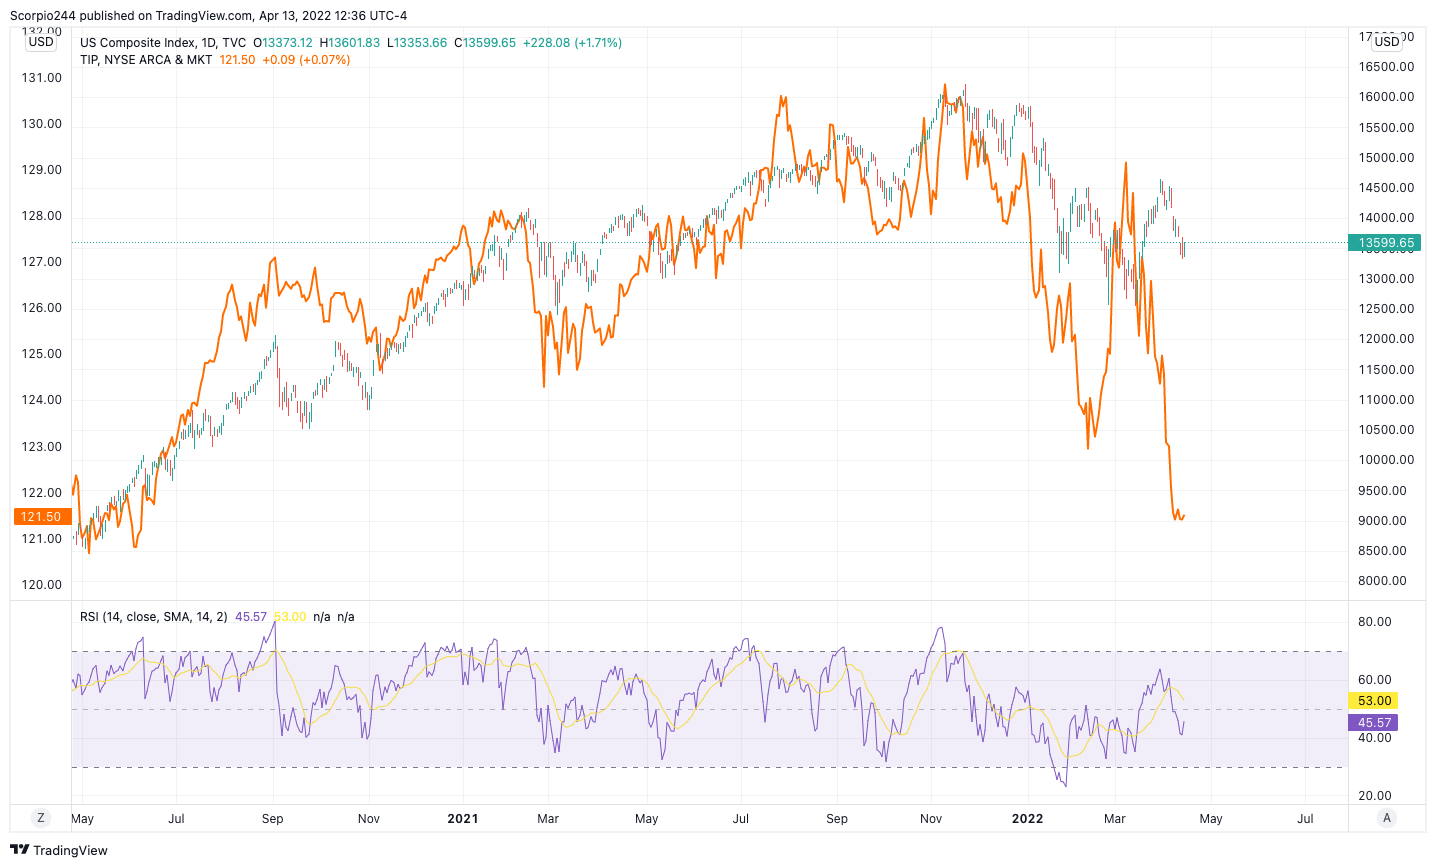
Additionally, a weaker consumer should lower earnings estimates for the index. Earnings trends for the NASDAQ composite have already turned lower this year. Currently, analysts estimate that the NASDAQ Composite will earn $484.20 per share in 2022, down from a peak of $495.97 at the beginning of February.
Bloomberg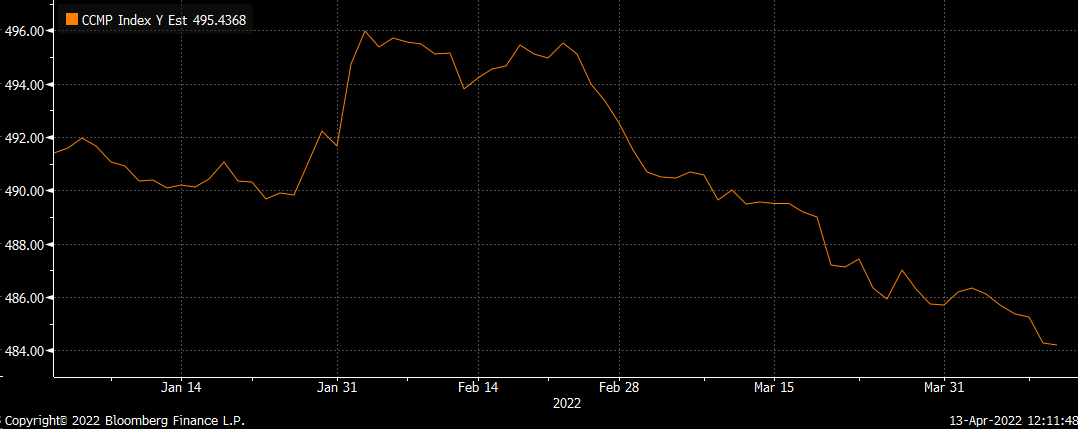
Many things are happening all at once, which may at times seem to make not much sense, but when digging deep, it looks pretty clear what is happening. The market is growing increasingly concerned that higher inflation will kill the economy and that the Fed will not get very far in its rate hiking process.
Be the first to comment