

Hispanolistic/E+ via Getty Images
As the world-renowned Benjamin Graham once said, the market is, in the short run, a voting machine. But in the long run, it is a weighing machine. This thinking offered up by the father of value investing means that, from time to time in the short term, shares of companies can deviate significantly from their fundamental value. But ultimately, the market will realize where mispricing takes place and adjust accordingly. One such company that seems to be irrationally priced at this time is The L.S. Starrett Company (NYSE:SCX). This incredibly small player with a market capitalization of just $49.2 million, looks to be fundamentally undervalued at this moment in time. Despite experiencing generally positive results lately, the market has punished the company and pushed its valuation into the low single-digit range. So long as fundamentals remain robust for the business, however, its price, in the long run, should eventually trace back higher. And if that does come to pass, the reward for shareholders could be rather significant.
SCX shares have been punished
As a producer of tools and instruments, with a special focus on measurement and cutting solutions, as well as other electronic precision measuring tools and wireless data collection instruments, L.S. Starrett has carved out for itself an interesting niche in the industrial market. When I last wrote about the firm, in an article published in late December of 2021, I acknowledged that the company’s historical track record was rather volatile. However, I also said that shares were trading on the cheap and that recent performance had been positive for investors. At the end of the day, I rated the company a ‘buy’ prospect with the understanding that the long-term fundamentals would win out over anything else. Since then, the company has not performed exactly as I would have anticipated. While the S&P 500 has resulted in a loss of 4.6%, shares of L.S. Starrett have declined by 20.3%.
Author – SEC EDGAR Data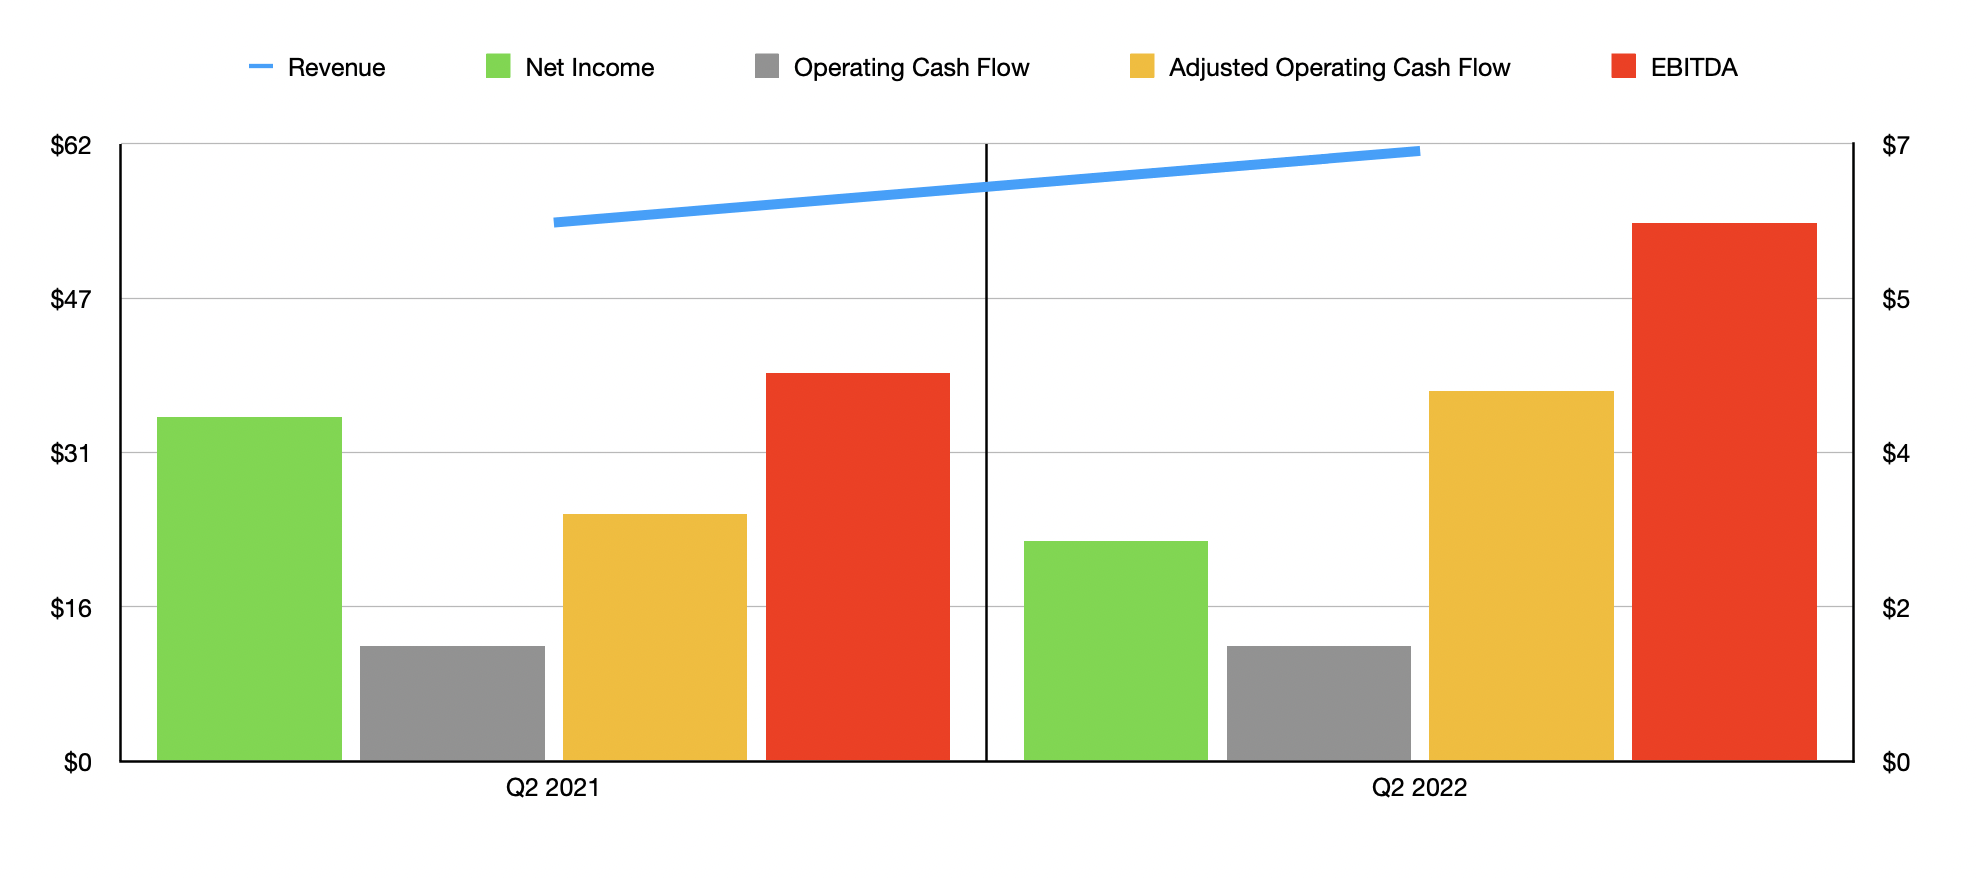
To say that such a decline was completely unwarranted would be a mistake. But with the data available, I would argue that the positive and negative, in the near term, more or less balanced one another out. For instance, in the second quarter of the company’s 2022 fiscal year, the only quarter for which data is available that was not available when I last wrote about the business, revenue came in at $61.32 million. That represents a year-over-year increase of 13.4% over the $54.05 million generated in the second quarter of its 2021 fiscal year. This helped to push total revenue for the first half of 2022 up to $122.83 million. That is 18.7% above the $103.46 million generated in the first half of 2021. Management attributed a big portion of this increase to strong new order intake, with a contribution to the company’s top-line growth of 16% during this timeframe. Though management does not provide an official estimate as to what backlog is, they did say that this resulted in a 36% increase in backlog over the preceding 12 months. They also expect that trend to continue for the remainder of the company’s 2022 fiscal year.
Despite seeing an increase in revenue, the company’s bottom line has been a bit mixed. Net income in the second quarter of its 2022 fiscal year was $2.53 million. That’s down from the $3.86 million generated one year earlier and, as a result, net profits for the first half of the year dropped from $7.97 million in 2021 to $5.76 million this year. Another profitability metric for the company that has worsened is operating cash flow. In the first half of the 2022 fiscal year, this came in at a negative $4.57 million. That compares to a positive $2.40 million generated one year earlier. Having said that, if we adjust for changes in working capital, this metric would have increased from $6.16 million to $9.08 million. Another metric that actually increased on the bottom line was EBITDA. In the first half of 2021, this came in at $8.64 million. This year, the reading was $11.97 million.
Author – SEC EDGAR Data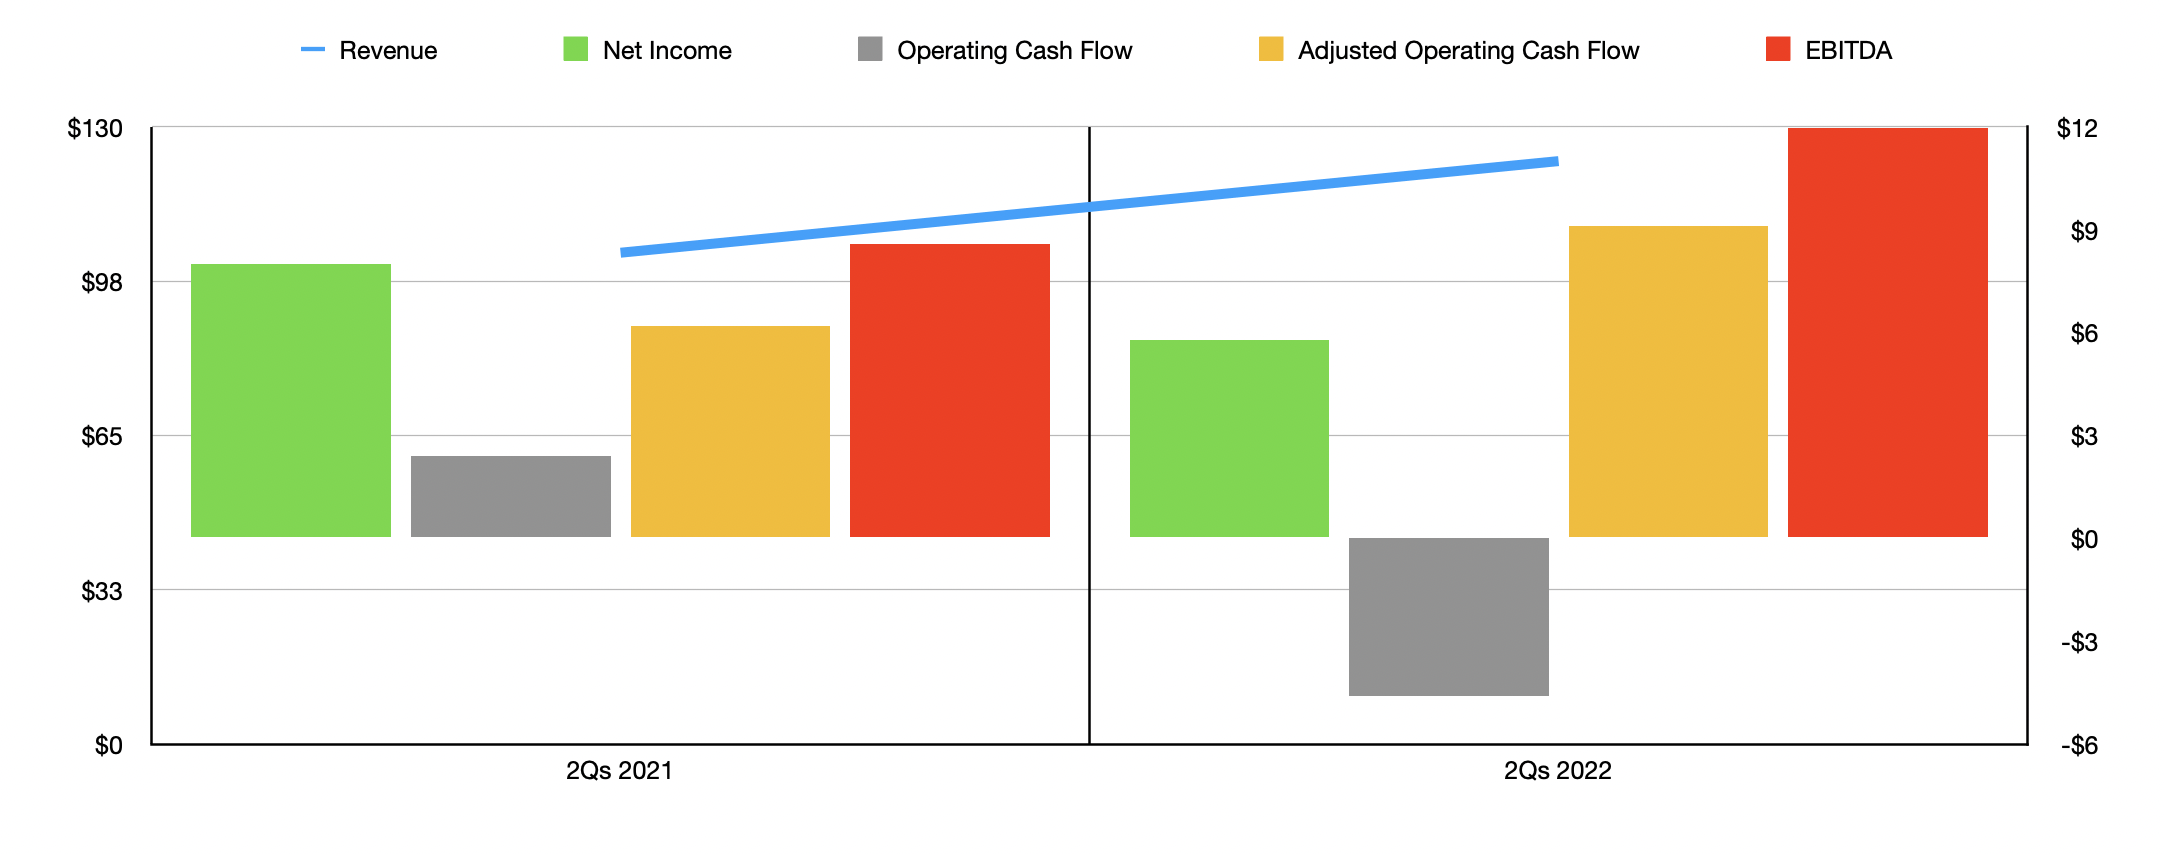
Unfortunately, management has not provided any guidance for what the company might achieve for the entirety of its 2022 fiscal year. But if we analyze results experienced in the first half of the year, then profits might be around $11.22 million, while operating cash flow would be around $23.57 million. Meanwhile, EBITDA for the company should be about $33.45 million. Historically speaking, net profits for the company have been all over the place. But the general trend for adjusted operating cash flow has been positive, as has been the trend for EBITDA. In 2021, net profits were $15.53 million. Adjusted operating cash flow was $15.98 million. And EBITDA for the company totaled $24.14 million.
Taking these figures, we can effectively price the company. However, to be conservative, I also decided to price the company using not just its 2021 figures and its 2022 estimates but also using the much more conservative 2020 results. 2020 marked the worst year for the company in the past four from a cash flow and EBITDA perspective, all as a result of the COVID-19 pandemic. But as you will see, the company is cheap even if we assume that as having been a new normal.
Author – SEC EDGAR Data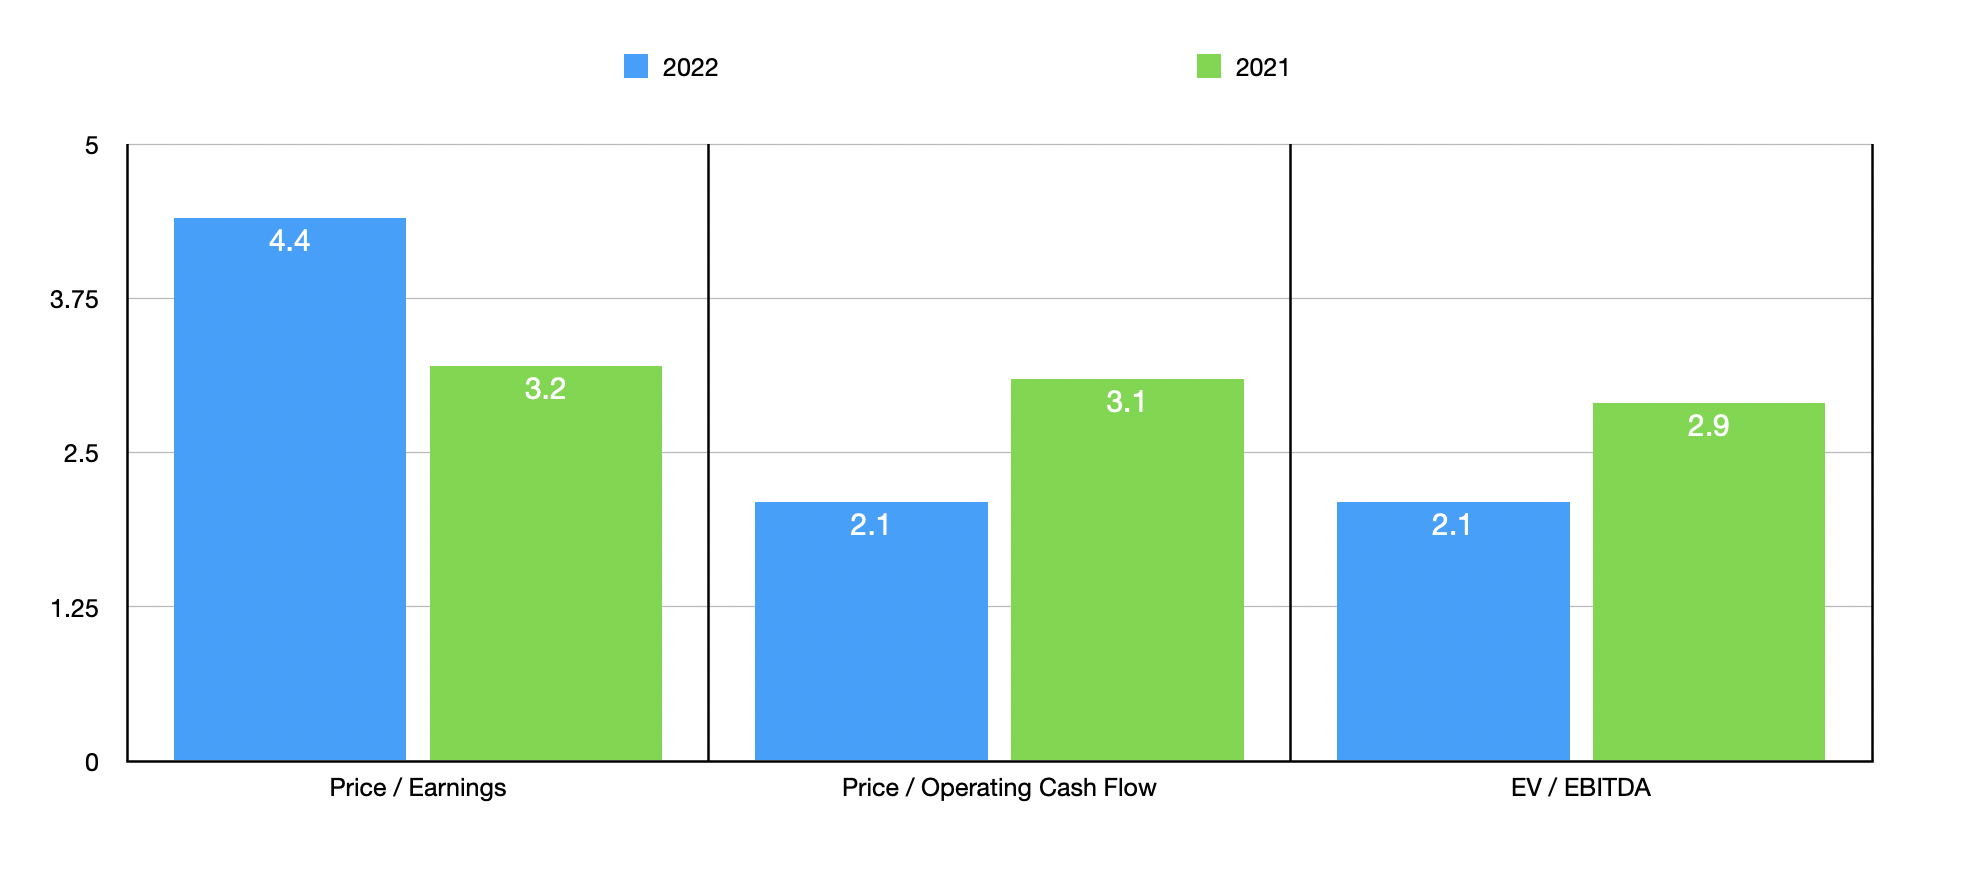
At present, using estimates for the company’s 2022 fiscal year, the firm is trading at a price to earnings multiple of 4.4. This is slightly higher than the 3.2 figure that we get from 2021. Earnings were negative in 2020, so we cannot calculate a multiple here. The price to adjusted operating cash flow multiple for these years, then, would be 2.1, 3.1, and 5.3, respectively. And the EV to EBITDA multiple for the company for each of these timeframes would be 2.1, 2.9, and 6.8, respectively. To put the pricing of the company into perspective, I did decide to compare it to three similar firms. On a price to operating cash flow basis, only one of the companies had a positive reading. That was a multiple of 7.5. Meanwhile, using the EV to EBITDA approach, the range for these three firms was from 6.7 to 144.1. In both of these cases, L.S. Starrett was the cheapest of the group. Using the price to earnings approach, instead, we would end up with a range from the three businesses of 1.5 to 117.4. In this scenario, using our 2021 results, only one of the three companies was cheaper.
| Company | Price/Earnings | Price/Operating Cash Flow | EV/EBITDA |
| The L.S. Starrett Company | 3.2 | 3.1 | 2.9 |
| Greenland Technologies (GTEC) | 7.3 | N/A | 8.4 |
| Graham Corp. (GHM) | 117.4 | N/A | 144.1 |
| NN, Inc. (NNBR) | 1.5 | 7.5 | 6.7 |
Takeaway
At this point in time, I frankly don’t understand what has transpired with the company from a share price perspective. Yes, margins did contract in the first half of 2022. In an inflationary environment, that is to be expected. But even if we assume results for the company worsen for the foreseeable future, shares look drastically underpriced on both a relative basis and on an absolute basis as well. It is true that the company’s small size does expose it to significantly greater risk, particularly from competition. But with a net leverage ratio right now of just 0.65 and such a cheap share price, I cannot help but to think that there exists an attractive upside even adjusting for the risks associated with such a small firm.
Be the first to comment