

niphon
Last week I asserted that this bear-market bounce in the stock market could become a baby bull if we realized a meaningful decline in the headline inflation numbers for July. Both the Consumer Price Index and Producer Price Index were lower than expected, resulting in another week of strong gains for the major market averages. Most importantly, the S&P 500 finally retraced more than 50% of this year’s losses on Friday, which strengthens my resolve that the June low was the ultimate low, giving birth to a new bull market. Over the past 70 years, the S&P 500 has never retested its bear-market low once it has retraced 50% of its losses. That said, I seriously doubt we will continue to see gains similar to those of the last several weeks. The rates of change in the economic data are mostly moving in a favorable direction, but there will be numbers that reignite fears about growth, inflation, and the pace and degree of monetary policy tightening by the Fed necessary to tame price increases.
Edward Jones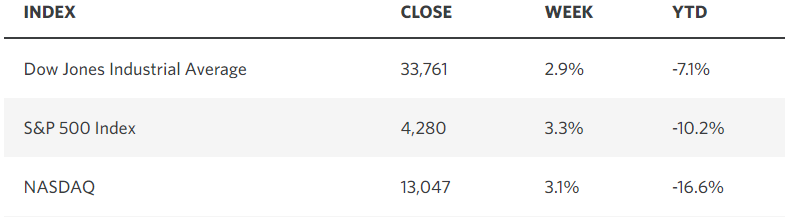
While the bears continue to harp on what is still an extremely high level of inflation, it is the direction the rate is going and the rate of change that markets respond to most. Regardless of the method used to calculate the rate, they all appear to be headed lower, led by the decline in energy prices. While it may seem counterintuitive, the largest market advances have followed declines in prices when the rate of inflation has been above 4.5%, as it is today. This is another historical data point that supports my outlook for a significant recovery during the second half of this year.
Fidelity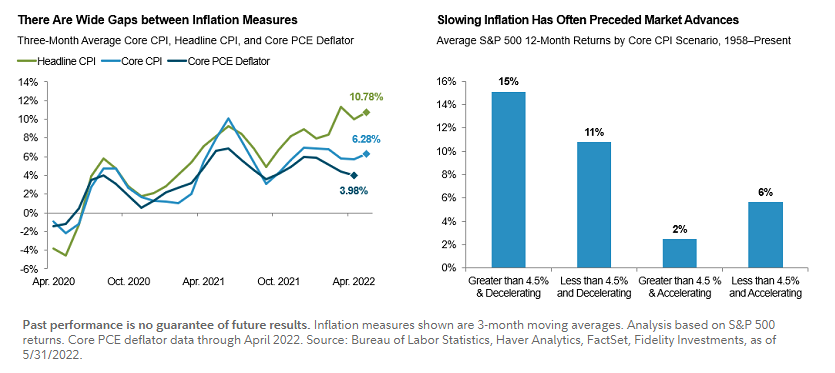
Should the S&P 500 continue its ascent, we can expect to hear Fed officials warn about tighter monetary policy conditions than investors are currently accounting for in an effort to suppress speculation and slow the market’s advance. Higher asset prices loosen financial condition, which spurs the demand that has contributed to inflation. Obviously, the Fed doesn’t want that. Currently, the consensus sees a 50-basis-point rate hike in September, followed by another 50-basis-points in November and 25 in December. Next year the consensus sees the Fed starting to ease, which runs counter to its own outlook for continued tightening. Yet its forecast has as much to do with managing inflation expectations as it does responding to the incoming data. I think the Fed will stop raising short-term rates at 3%, which is well short of the 3.5% expected today.
Bloomberg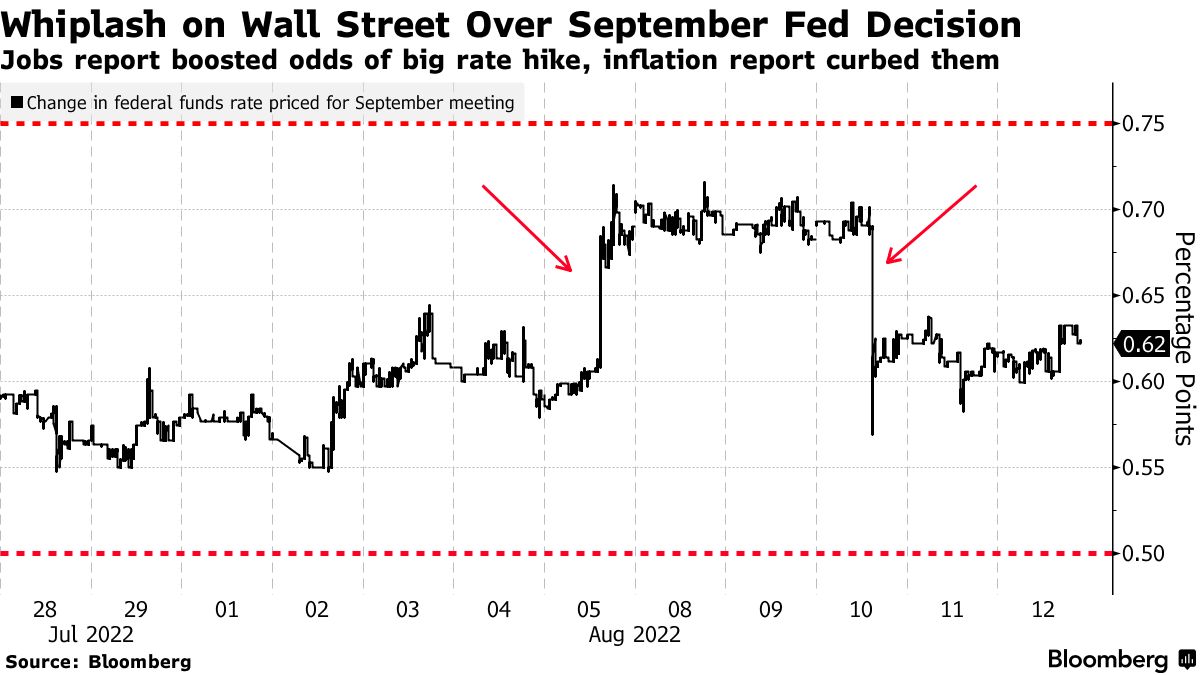
Despite the overly bearish outlook on Wall Street, it appears institutional investors are warming up to my optimism. The Smart Money Flow Index, which measures the degree of buying in the Dow Jones Industrials during the final hour of the trading day relative to the first 30 minutes, has risen to a two-year high. Less sophisticated and more emotional trading typically occurs at the open, while the pros tend to make more calculated decisions in the final hour. The pros are putting money to work.
Bloomberg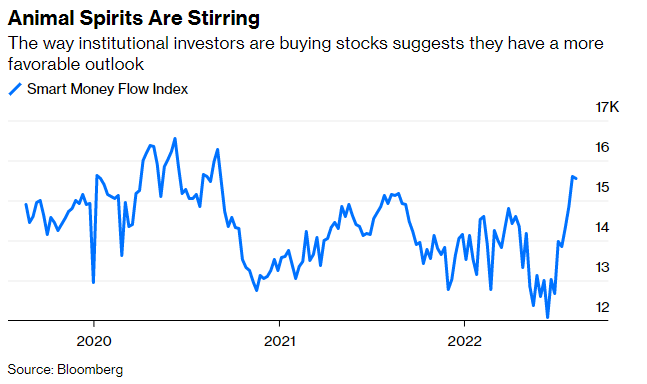
It has been my position that this is a unique business cycle with no precedent because of the multiple factors impacting supply and demand in the global economy. There is no better indication that things are returning to normal than the drop in the Fed’s Global Supply Chain Pressure Index, which suggests lower shipping costs and better delivery times. This should feed into lower prices for goods and services in the months to come.
Edward Jones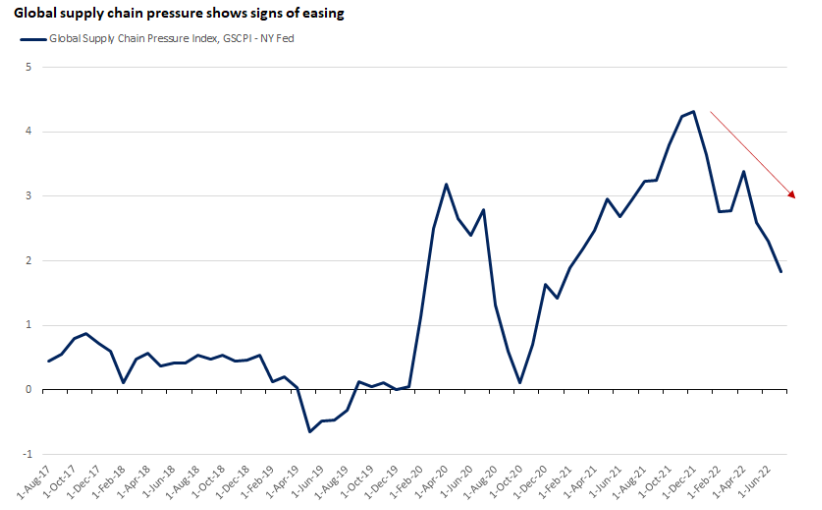
Another tailwind for the market comes in the form of midterm elections. The S&P 500 tends to perform exceedingly well in the 6-12 month period after midterm elections, which occur in November.
Edward Jones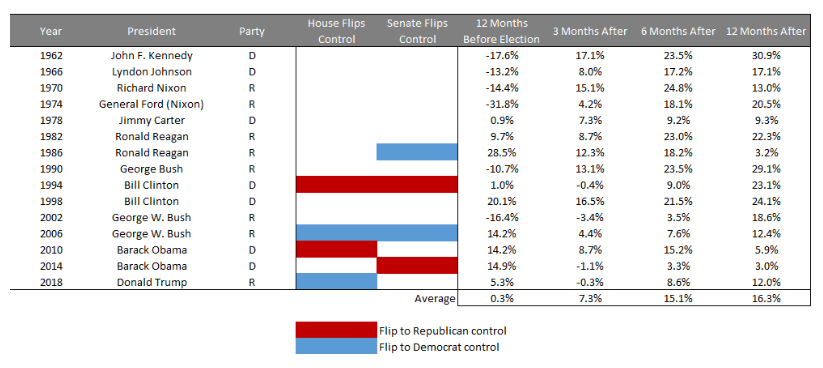
I think the stars are aligning for a robust rally between now and year-end.
Economic Data
Wednesday’s retail sales report will be the highlight of the week, hopefully showing that consumer spending remained resilient during the month of July.
MarketWatch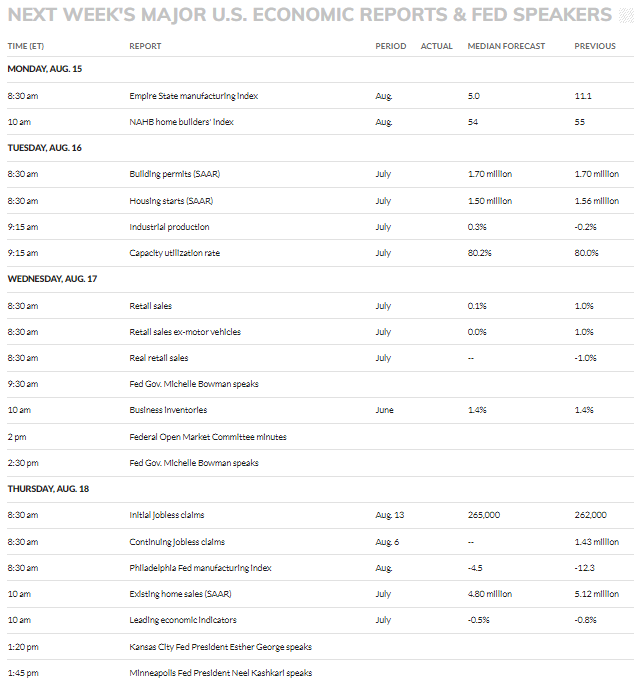
Technical Picture
We are extremely overbought on the basis of the percentage of stocks trading above their 50-day moving average at 92%.
Stockcharts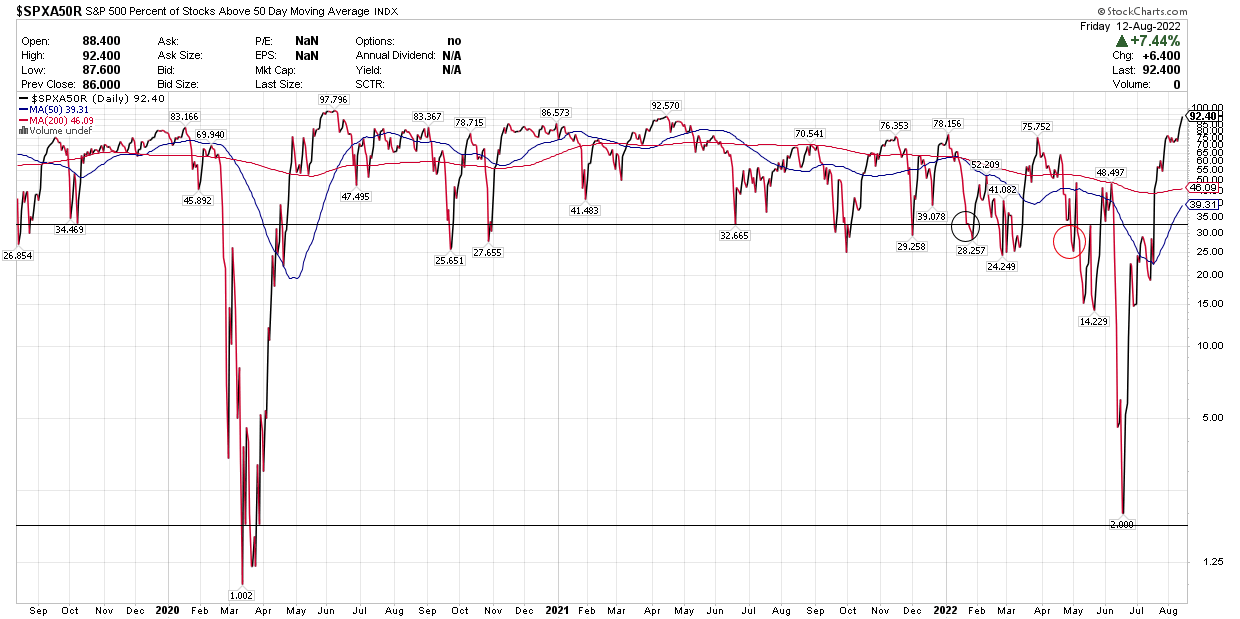
Be the first to comment