

William_Potter
Originally published on Aug 3, 2022
After what had to be one of the worst combined first halves of a year for stocks and bonds on record, July provided a respite as the S&P 500 rallied more than 9% and long-term treasuries, as measured by the BofA/Merrill 10+ Year US Treasury Index, jumped over 3%. Even after those rallies in July, though, trailing 12-month returns for both asset classes remain firmly in negative territory and well below the historical average.
The chart below compares the S&P 500’s annualized total return over the last one, two, five, ten, and twenty years to the historical average for all other periods since 1928. Historically, the S&P 500’s average annual total return has been a gain of 12.0%. With a decline of 4.6% over the last year, the current period ranks in just the 19th percentile relative to all other one-year periods. While one-year returns have been below average, it follows a period of strength for stocks which is evident by the fact that two, five, and ten-year returns are all still at least two full percentage points above their historical averages. Over a 20-year window, however, the S&P 500’s annualized total return of 10.0% is nearly one percentage point below the historical average of 10.9%. The last year has been bad for stocks, but it follows what has been a very good period for investors.
Author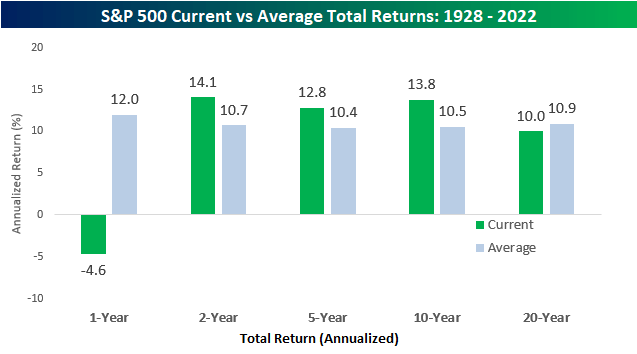
The experience of fixed-income investors has been an entirely different story. While bonds, and US Treasuries specifically, are supposed to be considered a safe asset class, over the last year, long-term US Treasuries are down over 17.5%, and the two-year annualized performance is a decline of 14.2%. Yup, that’s a cumulative decline of 26.4%- in Treasuries! Longer-term, the performance of long-term US Treasuries isn’t negative, but with annualized gains of less than 2% over the last five and ten years and just 5.2% over the last twenty years, calling the recent history of investing in this asset class the dark ages wouldn’t be an understatement.
Author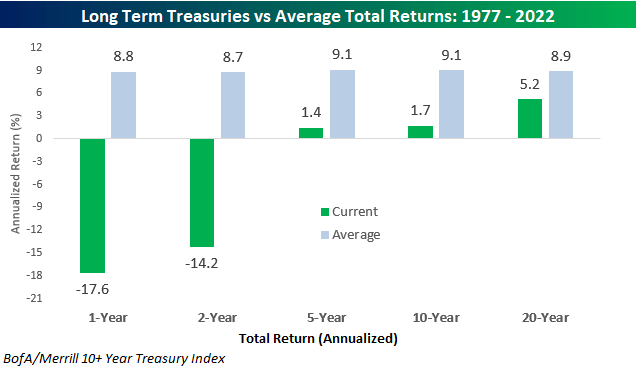
Editor’s Note: The summary bullets for this article were chosen by Seeking Alpha editors.
Be the first to comment