

ronniechua
By David W. Berson, Ph.D.
In the spirit of Charles Dickens’ A Christmas Carol, we look not at the ghosts of Christmas, but at the ghosts of recessions in the recent past, the present, and the near future.
Past
The popular definition of a recession is two or more consecutive quarters of real GDP declines. Indeed, almost all the recessions in US history fit this description (although the 2001 and 2020 recessions did not).
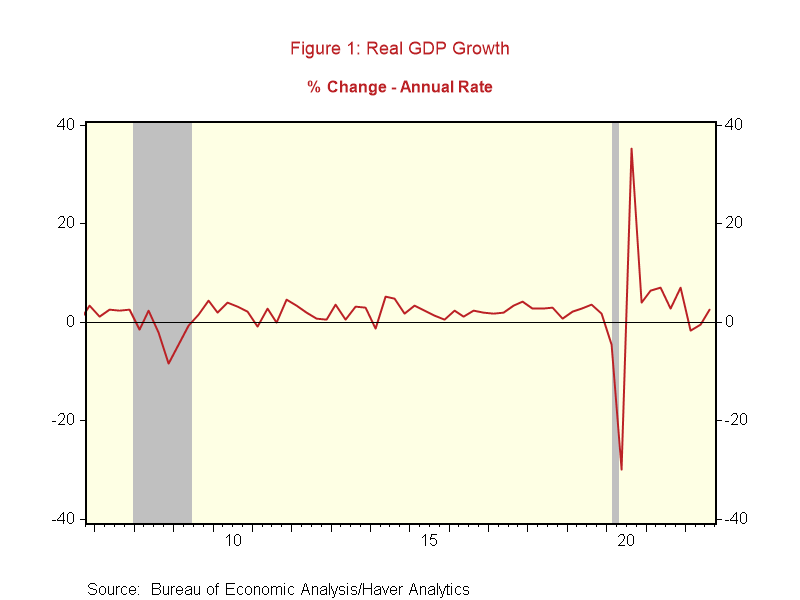
Moreover, real GDP growth in the first two quarters of this year was negative – down by 1.6 and 0.6 percent at annualized rates (Figure 1, below). But while that negative growth fit the common definition of a recession, was it really?
A group of economists at the National Bureau of Economic Research (NBER) actually determines when recessions begin and end. They usually wait until after downturns have begun to call the start of a recession. Similarly, they wait until after the downturn has ended to state that a new expansion has begun.
There are two primary reasons for these delays: (1) economic data are generally released with a lag, so data confirming a move down or up in the economy aren’t usually known until months or even quarters after the fact; and (2) economic data are subject to revisions, often substantial, and the NBER economists want to be certain that data revisions wouldn’t change their view of recession starts and ends.
For the reasons noted above, the NBER didn’t state that the Great Recession began for a year after it started. And it was more than a year after it ended before the NBER noted as much. But what data do they look at to make these recession/expansion determinations? The NBER noted that it looked at a number of economic indicators in determining the 2007 peak in economic activity and the 2009 trough.
The indicators that NBER used to make these business cycle calls were real personal income (less transfer payments), nonfarm payroll employment, real manufacturing and trade sales, employment from the household survey, industrial production, monthly estimates (from S&P Global) of real and nominal GDP, and the index of aggregate weekly hours worked from the payroll employment survey.
Based on these indicators, recessions and expansions come from a broad set of economic data rather than only the published quarterly real GDP figures.
What did these indicators show for the first two quarters of 2022, a period of negative real GDP growth?
- Real personal income (less transfer payments was up for three of the six months during this period and down for the other three. But income at the end of the period (June) was down slightly (0.8 percent) from the beginning (December). A weak recession signal.
- Nonfarm payroll employment growth slowed over this period but was still consistently strong in every month – with an average gain of 444,000. A strong growth signal.
- Real manufacturing and trade sales fell in the final five months of this period, after a strong gain for January. By the end of this period, the level of sales was down by 1.4 percent from the beginning. A modest recession signal.
- Household employment is based on a much smaller sample than nonfarm payrolls, and so tends to be far more volatile. But it is often a leading indicator of movements in payrolls because there is a significant trend component in the payroll survey as a result of how it is collected. Employment increased in four of the six months during this period, and by the end it was up by 2.1 million from the start. Another strong expansion signal.
- Industrial production climbed for the first four months out of six, and by the end it was up by 2.3 percent from the start. But this is only a modest expansion signal because much of the increase came from utilities output rather than manufacturing production.
- Real GDP (monthly estimate) slipped in four of the six months of this period but was down by only 0.6 percent (1.3 percent annualized) from start to end. Another weak recession signal.
- Nominal GDP (monthly) grew solidly in each month of this period, and in June was up by 4.1 percent from December. This is a strong gain, but it clearly shows the impact of higher inflation in the first half of this year when compared with real GDP growth. Still, it is an expansion signal.
- Aggregate hours worked declined in January, was unchanged in two other months, and increased in the other three. By June, the index had increased by 1.3 percent – another solid expansion indicator.
Taken together, three of the indicators suggested that the economy was in recession during the first half of the year, while the other five indicated continued expansion.
Importantly, the employment indicators all increased strongly. On balance, the ghost of recession past did not pay a visit in the first half of the year, but it may have been lurking in the neighborhood.
Present
While real GDP growth in the first half of the year was negative, it increased by a solid 2.6 percent (annualized rate) in the third quarter (the most recent period for which data are available).
Note that the Federal Reserve Bank of Atlanta’s widely watched GDP Nowcast (basically an accounting tool rather than a forecasting mechanism, using the key economic data released during the current quarter to that point) shows real GDP growth for the fourth quarter up by an annualized rate of 4.3 percent. With little data available for November (and none for December yet), this tells us that October was a strong month for the economy.
Corresponding with the solid reading for third quarter real GDP growth, all of the eight business-cycle indicators that the NBER looks at were up – many strongly. Certainly, no recession indicator there.
Additionally, only four have any data for the fourth quarter thus far, with two up for October (nonfarm payrolls and weekly hours worked) and two down (household employment and industrial production).
Perhaps the monthly data will turn downward when the rest of the quarterly data are collected, but it seems unlikely that the economy is in recession today, especially with retail sales and durable goods orders up solidly for October. The ghost of recession present appears to be somewhere else (perhaps in the EU).
Future
There are no data available for the future, but there are many forecasts. Rather than relying on perhaps inaccurate forecasts, however, there are leading indicators that have been accurate predictors of previous recessions and expansions. There are two, specifically, that have had excellent forecasting records: the shape of the yield curve and the Conference Board’s Index of Leading Economic Indicators (LEI).
The yield curve looks at the current yields on riskless assets of different maturities. US Treasury securities are viewed as having no credit risk, although all fixed-income securities have at least some interest-rate risk, so analysts use these securities when looking at the yield curve.
When plotted on a graph from the shortest to the longest maturity, the yield curve usually slopes upward as risks (principally from inflation) increase over time as our ability to forecast decreases. But sometimes the yield curve changes direction and slopes downward.
This shift typically occurs when the Federal Reserve tightens monetary policy, driving short-term interest rates higher relative to long-term rates. When the shortest yields (typically measured using either the 3-month Treasury bill rate or the federal funds rate) exceed longer-term yields (usually using the 10-year Treasury note yield), we call this an inverted yield curve.
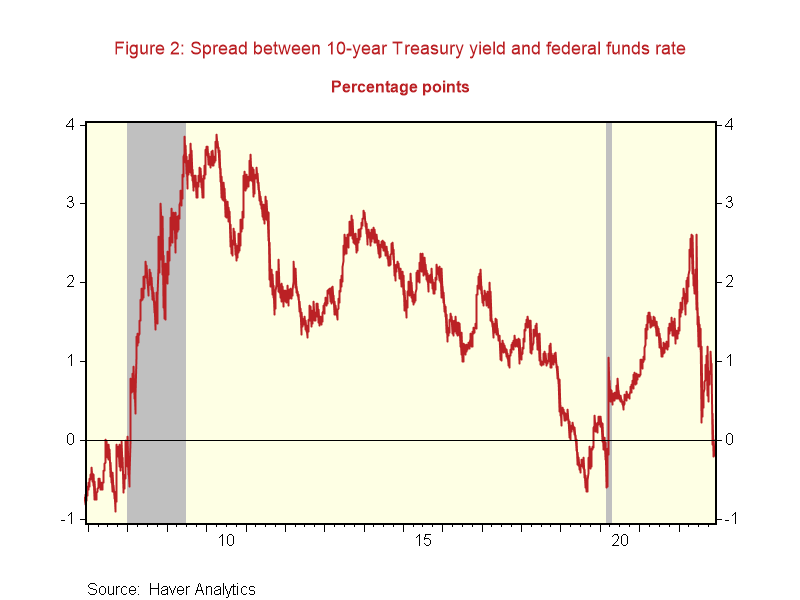
Historically, inverted yield curves have had an almost perfect record of predicting recessions 6-18 months in advance, as long as the inversion lasts for at least a couple of months. While much of the current yield curve has been inverted for a number of months (the spread between the 2- and 10-year Treasury note yields, for example, has been negative since early July), rates on the shortest maturities (for example the mid-point of the Federal Reserve’s target range for the federal funds rate) have only recently risen above 10-year Treasury note yields (Figure 2, below). This is a strong recession indicator, but only if it is sustained – perhaps through at least year-end.
The LEI is comprised of 10 components, one of which is the spread between the federal funds rate and the yield on the 10-year Treasury note (as described above). The other nine components of the LEI include the S&P 500 stock price index, consumer expectations, a leading credit index, and six measures of economic activity.
It’s easiest to look at the 12-month change in the LEI to get a view of its trend. When this trend view of the LEI turns negative, the economy usually slips into recession within the next year.
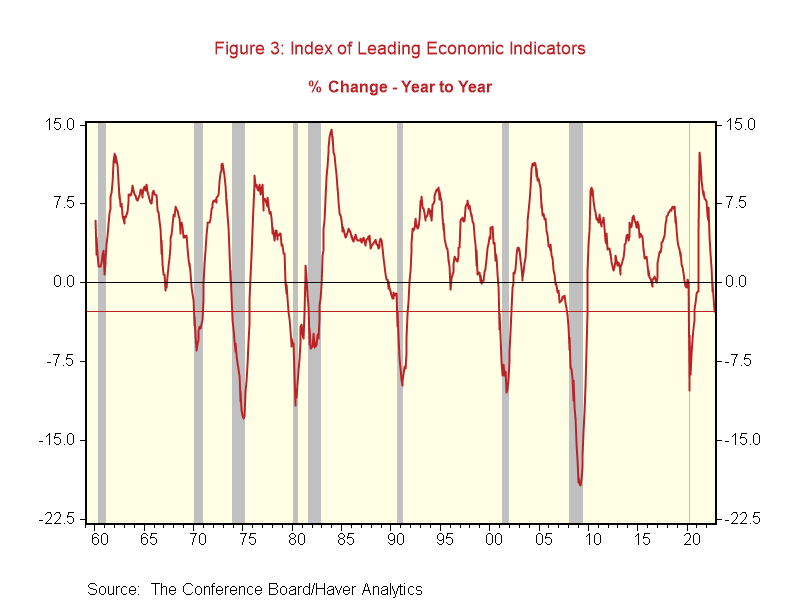
It’s not a perfect indicator, however, as there have been several instances of false positive readings. But the LEI has never failed to predict a downturn in the economy when the trend growth rate has been as negative as it is today, with the October 2022 reading down by 2.7 percent from a year earlier (Figure 3, below).
With the key parts of the Treasury yield curve inverted and the LEI down by a substantial amount over the past year, the odds of a recession within the next year are high.
While the yield curve has not yet been inverted for long enough to definitively call it a recession signal it is suggestive. The ghost of recession future may not be knocking on the front door quite yet, but it appears to be strolling up the walkway toward it.
Editor’s Note: The summary bullets for this article were chosen by Seeking Alpha editors.
Be the first to comment