

JamesBrey
As mentioned in this article’s bullets, the TTM distribution yield of the Fidelity High Dividend ETF (NYSEARCA:FDVV) – at 3.96% – is not exactly what I consider to be “high yield”. That said, I do believe the FDVV ETF delivers a relatively high yield – more than 2x that of the S&P 500 (1.74%) – while also having a relatively lower risk profile as compared to many higher yield alternatives. That being the case, investors looking for decent yield and the prospect of long-term capital appreciation should consider the FDVV ETF.
As most of you know, the 2022 bear market has been particularly hard on those companies with high-valuation levels that pay little or no dividends directly to investors. Meanwhile, energy stocks that do pay strong dividends (the yield of the Energy Select Sector SPDR ETF (XLE) is 3.35%) have also led the market this year in capital appreciation:
Seeking Alpha Homepage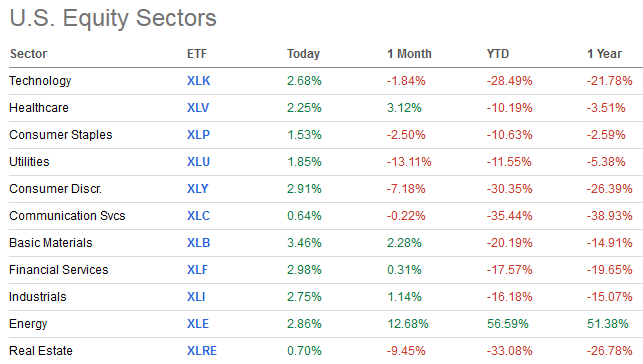
Indeed, as the graphic above clearly shows, the Energy Sector is the only sector in the green YTD and over the past year. The combination of yield and capital appreciation is a good reason for any dividend income-oriented ETF that might be overweight the Energy Sector – and the FDVV is certainly that. Let’s take a closer look at the FDVV portfolio.
Top-10 Holdings
The top-10 holdings of the Fidelity High Dividend ETF are shown below and equate to what I consider to be a well-diversified 28% of the entire 116 company portfolio:
Fidelity Investments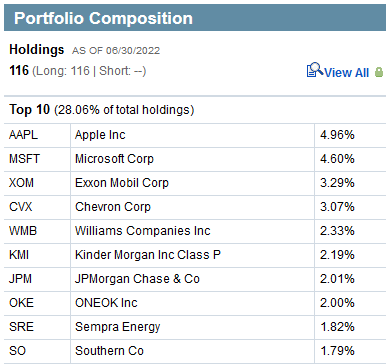
Source: Fidelity’s FDVV ETF Homepage
As mentioned earlier, Apple (AAPL) and Microsoft (MSFT) are the top-two holdings in the ETF and – in aggregate – account for 9.6% of the entire portfolio. Neither of which throw off exciting or even decent yields (0.62% and 1.12%), so you must be wondering what they are doing in the portfolio to begin with, let alone the top-2 holdings.
The likely reason is that both Apple and Microsoft pay significant dividends in terms of stock buybacks. Over the first 6 months of this year, Apple spent $43.1 billion on share buybacks (almost 6x the amount spent on dividends directly to shareholders) and – as a result – reduced its average fully diluted outstanding share count by 3.3% yoy.
Similarly, Microsoft spent $15.1 billion on share buybacks over the first 6 months of this year (about 60% more than dividends directly to shareholders), which has only reduced the average fully-diluted outstanding share count by ~0.9%. Clearly, Apple’s share buyback is much stronger as compared to Microsoft, while MSFT does give investors a bit of a fairer shake in terms of dividends directly to them.
Getting back to the theme of energy, note that five of the top 10 holdings are energy companies. These include the #2 and #3 holdings, Exxon (XOM) and Chevron (CVX), both of which yield 3.3% despite having risen 68.9% and 55.0% YTD, respectively.
Other than #7 holding financial firm JPMorgan Chase (JPM), #9 holding Sempra Energy (SRE), and the #10 holding utility company Southern Company (SO), which yield 3.3%, 3.2%, and 4.2%, respectively, the remainder of the FDVV portfolio’s top-10 holdings are midstream energy companies: Williams Companies (WMB), Kinder Morgan (KMI), and ONEOK (OKE). These three midstream companies throw off very strong dividend income and yield 5.4%, 6.3%, and 6.6%, respectively.
In aggregate, petroleum companies in FDVV’s top-10 holdings equate to 12.9% of the entire portfolio, of which Morningstar (which gives FDVV a 4-star rating) reports a total energy exposure of 13.43%. Note that utility companies have an 11.85% weight. The entire sector breakdown is shown below, with Financial Services companies – currently benefiting from strong net-interest margin – having an 18.15% weight:
Morningstar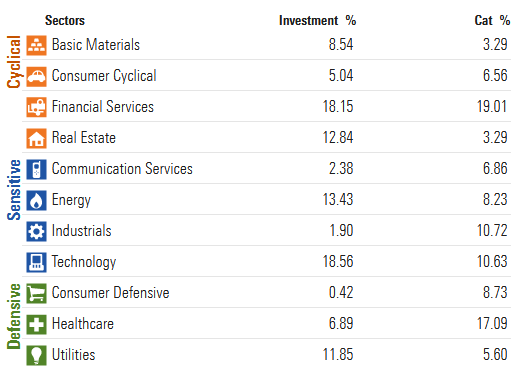
Source: Morningstar’s FDDV ETF Webpage
Performance
The FDVV’s average annual total returns track record is shown below:
Fidelity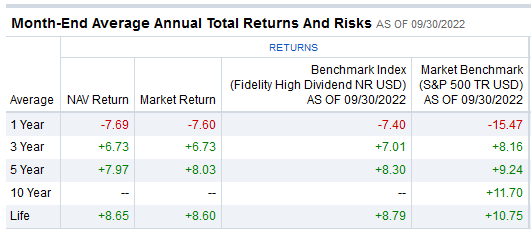
Despite the 2022 bear market, FDVV’s average annual 5-year total return of 8% still lags that of the Vanguard S&P 500 ETF (VOO) – which has averaged a 9.2% annual return, by over 1%. Part of that outperformance can be attributed to the fact that VOO has an expense fee of only 0.03% as compared to FDVV’s rather stiff expense fee of 0.29%.
Comparing FDVV with another dividend-centric fund, like the Schwab U.S. Dividend Equity ETF (SCHD), shows that FDVV trails its Schwab competitor – in terms of total returns – by about 16% over the past 5 years:
Seeking Alpha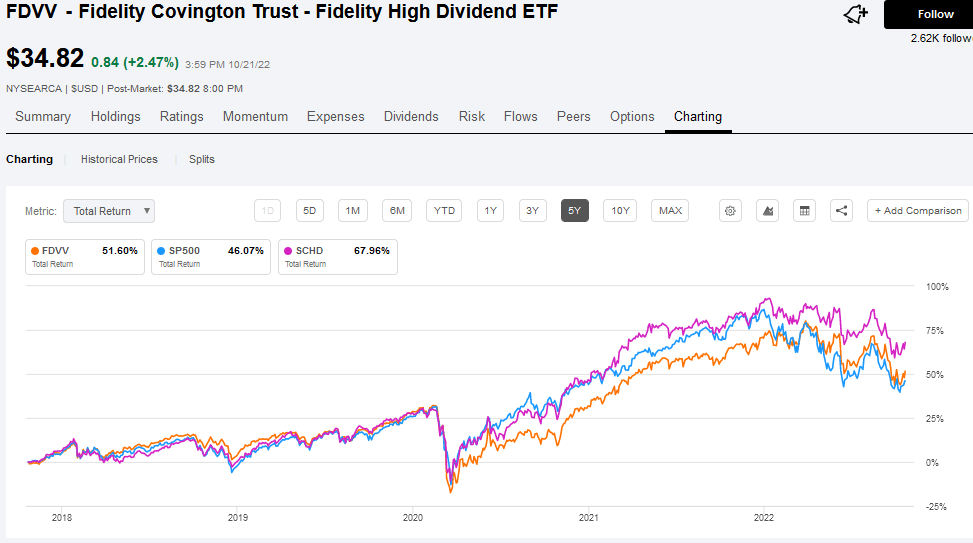
Note that both FDVV and SCHD have delivered better total returns as compared to the S&P 500 over the past 5 years. Also, note that the SCHD ETF also has a significantly lower expense ratio (0.06%) as compared to FDVV (indeed, 23 basis points lower).
Risks
The risk of investing in the FDVV ETF at this point in the cycle is the general market risks that you all are already familiar with: high energy and food inflation as a result of Putin’s horrific war-of-choice on Ukraine – that effectively broke the global energy & food supply chains – are forcing governments to respond with higher interest rates. Those higher rates are, no doubt, part of the reason behind the 2022 bear market and could lead to a significant slowdown in the global economy, a global recession, or potentially – given Putin has arguably lost his grip on reality – even worse.
Meantime, the FDVV ETF is over-weight energy with a 13.43% exposure (note the XLE Energy ETF is only ~5.35% of the S&P 500). That being the case, a significant recession that could lead to significant oil and gas demand destruction, would likely hit this fund more than, say, the SCHD ETF, which has only 4.7% allocated to the Energy Sector, which has more of its portfolio allocated to sectors like Consumer Staples, HealthCare, and Financials. That said, I do believe FDVV’s relatively high exposure to Apple and Microsoft makes it a bit more of a defensive and lower-risk oriented income fund given those companies’ very strong free-cash-flow profiles.
Summary & Conclusions
The FDVV ETF is an “OK” fund, but the expense ratio is too high. That said, I generally like the positioning of the portfolio and will rate it a HOLD. Meantime, in the same investment class, I prefer the Schwab SCHD ETF. If you are already overweight the energy sector, SCHD would be a much better ETF as compared to FDVV if you are looking for portfolio income diversification.
Be the first to comment