

By James J. Puplava
“How did you go bankrupt?” “Two ways. Gradually, then suddenly.”
–Ernest Hemingway, The Sun Also Rises
“To summarize, each price-revolution developed through five stages: slow beginnings in a period of high prosperity; a period of surge and decline; a time of discovery and institutionalization; an era of growing imbalances and increasing instability; and finally a general crisis…Each successive price-revolution became less catastrophic in its demographic consequences, but more sweeping in its social impact.”
- David Hackett Fischer, The Great Wave
In five short weeks, America changed. We’ve gone from the lowest employment in six decades to an unemployment rate reminiscent of a severe recession or depression. Over 30 million Americans have filed for unemployment insurance and that figure may rise as high as 40 million before the virus is contained. First quarter GDP shrank at its fastest pace since the last recession, signaling the end of the longest economic expansion on record. The economy contracted at an annual rate of 4.8% in the first quarter. Forecasters expect a much larger contraction of 12% in the second quarter-a 40% drop if it were to persist for a year.
The stock market lost 38% in just five weeks; the worst and fastest decline since the October crash of 1987. At the end of the government’s fiscal year ending on September 30, the deficit is estimated to be $3.7 trillion, equal to 18% of GDP, the highest level since WWII. Federal debt held by the public is projected to hit 110% by the end of the fiscal year.
As bad as these numbers sound, they could end up much worse if the economy remains on lockdown or if a second or third wave of the virus returns during the next flu season. Through its shutdowns, the government and its quarantine actions have blown a hole and destroyed a good portion of the U.S. economy. The energy sector is now in a depression not seen since the 1930s. Not even national oil companies can remain solvent with $10-$15 oil. If the economy remains on shutdown and people aren’t flying planes or driving their cars, demand destruction will bankrupt many oil companies and much of OPEC.
We have now come to the point where our leaders must decide if the cure is worse than the disease. If the economy remains closed for much longer, we may not recover and enter a depression much worse than the one the country experienced during the 1930s, a time when we were much stronger financially and less dependent on the rest of the world for the goods we consume.
The coronavirus caught the country by surprise and was unprepared to handle a pandemic which, in terms of deaths, just passed one of the worst flu seasons over the past 10 years. Looking at the numbers, the flu has killed between 12,000 and 61,000 people each year since 2010. As of May 1st, there are 1.13M cases and 65,245 deaths from the coronavirus.
What makes COVID-19 different is that it is easily transmitted, more virulent and we have no cure or vaccines at the present time. Another differentiating factor is the government response to quarantine the majority of Americans who are healthy. Normally, quarantines are used to isolate the sick. In addition, a vast swath of the U.S. economy has been shut down. Hotels, restaurants, bars, gyms, sporting events and schools have been shut down. Factories have switched to making respirators and masks instead of cars and industrial goods. Planes are parked on the runway and cars are parked in garages. Energy demand has fallen off a cliff erasing an entire decade of growth in demand.
As bad as this is, the worst is yet to come. Even scarier is that members of the media, some health officials and many politicians are calling for the quarantine to remain in effect until a vaccine or cure is produced. If that were to happen, the economy would likely collapse and make the Great Depression look like a mild recession by comparison.
Let’s examine the response to the shutdown, which is still in its formative stages. As I mentioned in my first installment in this series, the first stimulus was one of many to come.
- CARES Act $2.2 trillion
- Supplemental aid to small business $484 billion
- Stimulus 3 (in the works) payroll tax suspension for employers/employees + $2,000 a month to individuals under a certain income limit $130K. Cost $500B?
- Infrastructure bill $2 trillion (early planning stages)
- Direct payments to qualifying taxpayers of $1,200 per individual plus $500 per child
- Extended unemployment benefits to 39 weeks plus an extra $600 a week for four months for those who qualify
- Waiver of early IRA withdrawal penalties
- $4 trillion in loan guarantees
- Fed loan package increased by $2.3 trillion for direct loan assistance of $8.5 trillion
There could be more if the virus returns in the fall. This is just getting started. Now let’s look at the cost.
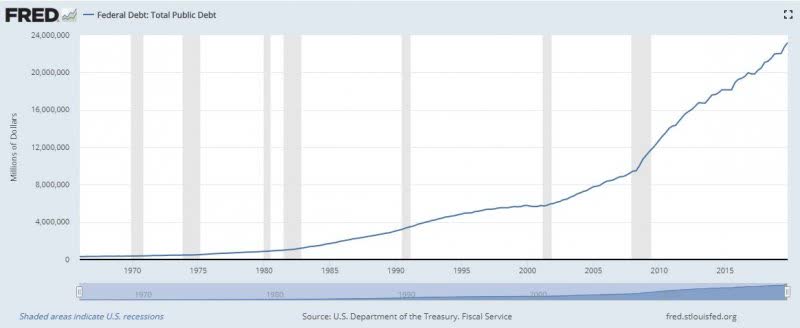
Let’s begin with a look at debt at all levels of the economy. Below is a graph of government debt which is at $24.9 trillion as of this writing. With a fiscal deficit approaching $4 trillion this year, we should easily be at $28 trillion by year end. It could be much worse as a result of the shutdown as social spending rises and tax revenues plunge.
Source: U.S. Department of the Treasury. Fiscal Service, Federal Debt: Total Public Debt [GFDEBTN], retrieved from FRED, Federal Reserve Bank of St. Louis; https://fred.stlouisfed.org/series/GFDEBTN, May 1, 2020
We can’t tax a business that is shut down or employees that are furloughed or laid off. By next year we will be well over $30 trillion of government debt at the present rate of spending and that is assuming a U-shaped recovery. If we remain shut down or go into quarantine this fall, those figures will look even worse. As shown in the graph below the amount of debt in relation to GDP has been rising steadily and will look much worse after this year.
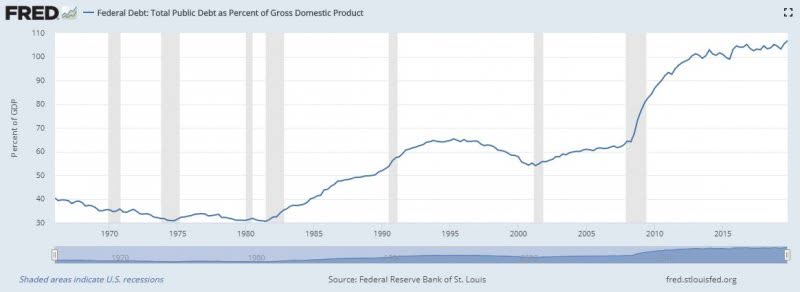
Source: Federal Reserve Bank of St. Louis and U.S. Office of Management and Budget, Federal Debt: Total Public Debt as Percent of Gross Domestic Product [GFDEGDQ188S], retrieved from FRED; https://fred.stlouisfed.org/series/GFDEGDQ188S, May 1, 2020.
Those are the government’s debt levels. Now let’s look at the rest of the economy. Consumer debt looks good when compared to assets such as housing prices or the stock market before the crash in stock prices. The two graphs below depict different outlooks when it comes to consumer debt. The first from the St. Louis Fed shows consumer debt/GDP which has been falling as GDP has risen for the longest recovery period in US history.
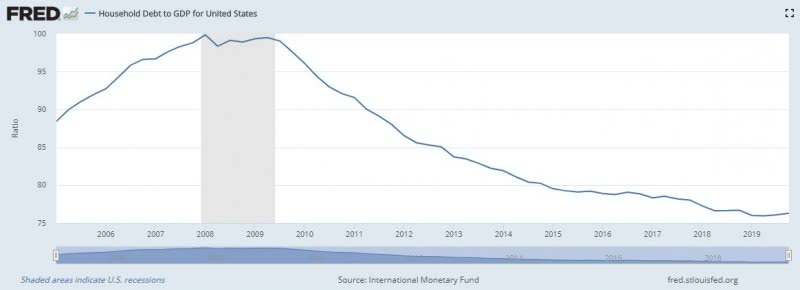
Source: International Monetary Fund, Household Debt to GDP for United States [HDTGPDUSQ163N], retrieved from FRED, Federal Reserve Bank of St. Louis; https://fred.stlouisfed.org/series/HDTGPDUSQ163N, May 1, 2020.
The second graph is a breakdown of all levels of debt, government, corporate, consumer, state and municipalities. You can see that consumer debt has steadily risen throughout the recovery. It looks better when you compare it to a rising economy and rising asset markets which we have seen throughout the last decade.

Source: Bloomberg, Financial Sense Wealth Management
The problem with debt levels is that they look good in rising asset markets, such as we saw in the housing and stock market, until recently. The problem arises when asset markets fall and deflate as we saw with stocks between February and March of this year. When assets deflate, the debt remains the same which is why the Fed has acted expeditiously to prop up asset markets from stocks and government bonds to corporate bonds, junk bonds, money market funds and commercial paper. More about the Fed in just a moment.
Now let’s look at corporate debt which has more than doubled in the last decade.

Source: Board of Governors of the Federal Reserve System (US), Nonfinancial Corporate Business; Debt Securities; Liability, Level [NCBDBIQ027S], retrieved from FRED, Federal Reserve Bank of St. Louis; https://fred.stlouisfed.org/series/NCBDBIQ027S, 5/1/20
What is not shown here is that close to 50% of that corporate debt is rated BBB, just one step above junk bonds. The problem with recessions and a shutdown is that corporate debt can get downgraded to junk bond status. Much of that BBB debt is held in investment grade bond mutual funds and ETFs. A downgrading to BB would force investment grade bond funds and ETFs to sell those bonds to remain within the bounds of their mandate. Now you know why the Fed is intervening in the corporate debt markets for the first time to keep the debt markets from imploding.
Finally, let’s look at all this debt combined, its relation to GDP and revisit a graph from my first article The End of Money, linked to above. As the graph clearly shows, debt levels within the economy are growing exponentially and much faster than GDP. You cannot borrow your way to prosperity.
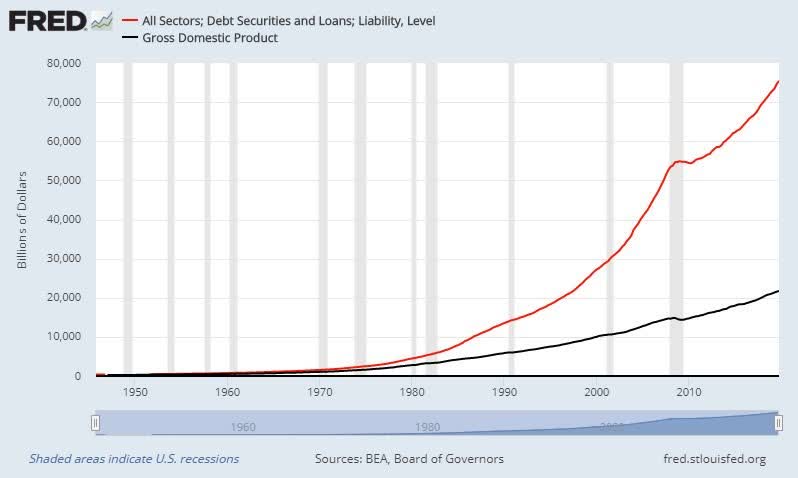
Source: Board of Governors of the Federal Reserve System (US), All Sectors; Debt Securities and Loans; Liability, Level [TCMDO], retrieved from FRED, Federal Reserve Bank of St. Louis; https://fred.stlouisfed.org/series/TCMDO, May 1, 2020.
You may be wondering, “How do we pay for all of this debt and spending?” No problem according to Modern Monetary Theory (MMT). You simply print the money since, according to MMT, there is no limit to debt and spending when your debt is issued in your own currency.
B-52 Bombing Runs and Helicopter Drops
Enter the Fed. Shown below is a graph of the Fed’s balance sheet. Notice the slight dip between 2018-2019 which was quantitative tightening (QT). It didn’t last long once the repo market blew up in September 2019. We are now on quantitative easing (QE) four and could see the Fed’s balance sheet double or triple by year end at the present rate. To put this into perspective, just look at the amount and the time frame shown below.
- QE1: $1.7 trillion in 14 months
- QE2: $600 billion in 9 months
- QE3: $1.6 trillion in 16 months
- QE4: $2 trillion in 2 months!
Since the beginning of February, the Fed’s balance sheet has grown from $4.17 trillion to $6.2 trillion at the end of April and is still growing rapidly.
The Fed met on April 28 and April 29 but did not announce any new policy initiatives or a change to interest rates. They did expand their lending rules to small businesses with details yet to be announced as of April 30. Fed officials have been busy bees since the crisis first began to emerge as shown in the sequence of policy responses below.
- March 3: Fed Funds ½ point rate cut to 1-1 ¼%
- March 4: Reduces capital requirements for banks
- March 15: FOMC meeting cuts Fed Funds to 0-1/4%
- March 17: Reduces bank regulatory capital buffers
- March 17: Establishes CPFF, Commercial Paper Funding Facility to buy commercial paper
- March 17: Establishes PDFF, Primary Dealer Credit facility to support primary dealers
- March 18: Establishes MMMLF, Money Market Mutual Fund Liquidity Facility
- March 19: Establishes facility for dollar swaps with foreign central banks
- March 19: Increases discount window availability and borrowings
- March 20: Announces coordinated efforts with major foreign central banks
- March 20: Expands MMMLF to include tax exempts and municipal bonds
- March 20: Loosens credit rules and encourages lenders to work with borrowers
- March 23: Announces unlimited QE and purchases of Agencies and Treasury Securities as needed to address market conditions. Previous limits were set at $500B for Treasuries and $200 B for agencies.
- March 23: Establishes PMCCF, Primary Market Corporate Credit facility
- March 23: Establishes SMCCF, Secondary Market Corporate Credit facility
- March 23: Establishes TALF, Term Asset Lending Facility to buy student loans, car loans, asset backed loans
- April 30: Fed expands rules for $600B lending effort designed to reach small and mid-size businesses
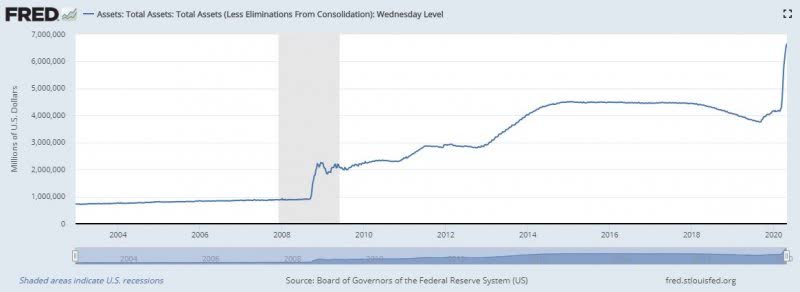
Source: Board of Governors of the Federal Reserve System (US), Total Assets (Less Eliminations From Consolidation): Wednesday Level [WALCL], retrieved from Federal Reserve Bank of St. Louis; https://fred.stlouisfed.org/series/WALCL, May 1, 2020
In this series of moves the Fed is in effect agreeing to backstop the entire financial system from the government debt markets, U.S. Agency debt, Commercial Paper, money market funds, municipal bond market, foreign central banks, primary government dealers or brokerage firms, student loans, car loans, or any other asset backed security. They have become the backstop and guarantor of every kind of debt instrument in the financial system. They are putting into effect MMT or the largest money printing operation in the history of the world.
Where will all of this money come from you ask? It will be money created out of thin air. There has been talk for years of helicopter drops. What you are seeing now is akin to B-52 bombing runs. They are simply flooding the financial system with liquidity and backstopping every form of security on the planet.
The only area not touched so far has been the stock market. But as they implement ZIRP (zero interest rate policy) they are driving down the yield curve to nearly nothing with 3-month T-bills at 0.107%, 10-year notes at 0.618% and 30-year bonds down to 1.242%. As I wrote in Zero-Bound: The Return of Inflation and the Loss of Income, “it is going to be slim pickings for income investors from pension funds, insurance companies, to retirees.”
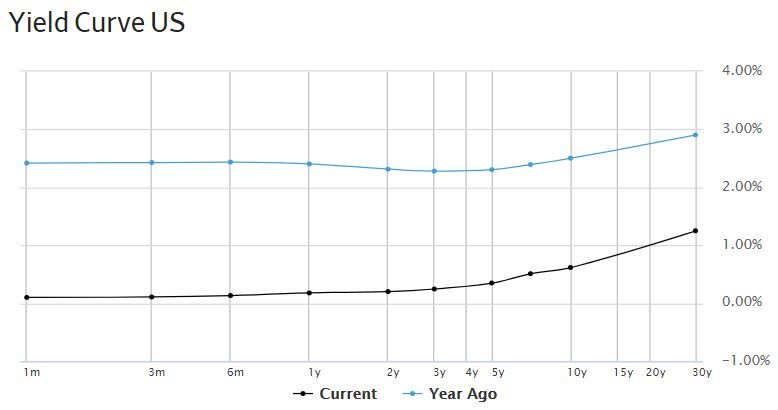
Source: The Wall Street Journal
The Nuclear Option
If these measures don’t work, the Fed could employ additional measures from their arsenal in order to keep the biggest bubble of all, the bond bubble, from imploding. They include the following options:
- Implement NIRP, (negative interest rate policy) in the range of -2 to -5%. This will be used with nuclear levels of QE in the possible range of $100 billion per month.
- Attempt a ban on cash or large denomination bills along with a carry tax placed on small denominations. Those metal strips on bills could be used to keep a time stamp on money in circulation with a carry tax when redeposited.
- Implement numerous bail-ins where savings deposits will be frozen and converted into a firm’s equity, or simply seized in order to prop up failing banks and financial institutions. Think Cyprus.
At this point you may think this will never happen. It did in 1933. To deal with the banking problem President Roosevelt did the following:
- Made it illegal for Americans to own gold
- Confiscated physical gold, forcing Americans to own US dollars
- Devalued the US dollar by 70% against gold (the equivalent of a massive amount of money printing)
The theoretical justification for penalizing cash with the goal of stopping individuals from hoarding cash was first outlined in a Richmond Fed paper Overcoming The Zero Bound on Interest Rate Policy, published in August of 2000.
As I quote here:
A carry tax could be imposed on a currency by imbedding a magnetic strip in each bill…A carry tax could be deducted from each bill upon deposit according to how long the bill was in circulation since last withdrawn and how much carry tax was ‘past due.’…The carry tax would serve as a powerful deterrent to hoarding currency.
The author of this paper is an economist who’s now a visiting scholar for three major central banks as well as the IMF.
But before the inflation comes, there is a deflationary wave until monetary and fiscal policy become enjoined. In the last wave of money printing, there was very little inflation. This was due to two reasons: most of the money remained at the Fed, and money velocity remained low. When inflation erupts it can emerge in two places: the real economy inflating the cost of goods and services or in asset markets which is where the money flowed in the last economic cycle.
The real story here is the purchasing power of the dollar which has been declining steadily since the Fed’s creation in 1913. It accelerated under Roosevelt when the dollar was devalued in 1933, and then more rapidly after 1971 when President Nixon removed dollar backing of gold.
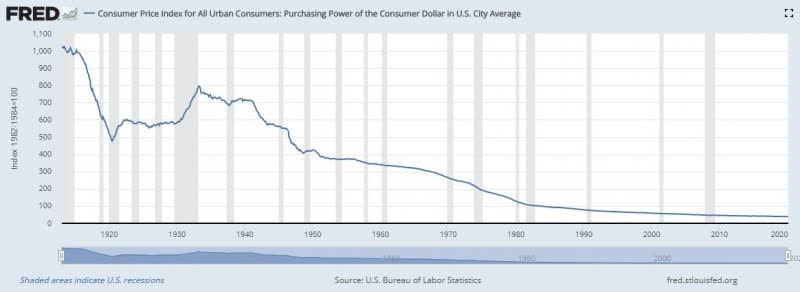
Source: U.S. Bureau of Labor Statistics, Consumer Price Index for All Urban Consumers: Purchasing Power of the Consumer Dollar in U.S. City Average [CUUR0000SA0R], retrieved from FRED; https://fred.stlouisfed.org/series/CUUR0000SA0R, May 1, 2020.
The Fed will have to walk a tight rope in implementing its current nuclear option. The trick will be to implement these policies while maintaining public confidence, which will be the subject of my next installment in my The End of Money series.
“Confidence is certainly an important element which must be taken into account in a study of the variations of the value of money…One must observe, however, that confidence based on declarations and acting as a powerful support to the value of the currency, even speculation from direct operations against it, is maintained and strengthened only if the public knows that the issues of money are strictly limited; if they are continued the wave of confidence is quickly broken. At the beginning of the inflation, when the public still did not understand the phenomenon of monetary depreciation and attributed the rise in prices to other causes, confidence in the depreciated money was maintained for a time in spite of the rise in the issues; but in a later phase each new issue weakened confidence more and more.”
– The Economics of Inflation, Constantino Bresciani-Turroni
Editor’s Note: The summary bullets for this article were chosen by Seeking Alpha editors.
Be the first to comment