

CreativaImages/iStock via Getty Images
Many investors and traders are focusing on the next CPI release this week for clues about Fed policy and market direction. This is a very short-sighted view based on wishful thinking and a desire for things to return to how they were before the market correction started. Hopes and dreams will not change reality or the very complex dynamics of the economy and stock market.
Inflation is hard to forecast because it is the outcome of the interactions of a large number of variables in a highly complex system. As soon as an inflation mode is triggered, it becomes hard to dampen it and for the system to find another stable path to return to its initial state. In the best case, there is a path that brings the system to another but maybe an inferior stable state. These come from the mathematics of non-linear systems, but a picture is worth a thousand words. Below is the seasonally-adjusted CPI chart from the late 40s.
We will focus on the period between 1967 and 1980 to illustrate the complexity of the inflation process and why any forecasts may be an exercise in futility.
CPI Chart – Seasonally Adjusted, With S&P 500 Drawdown Profile (Price Action Lab Blog – Norgate Data)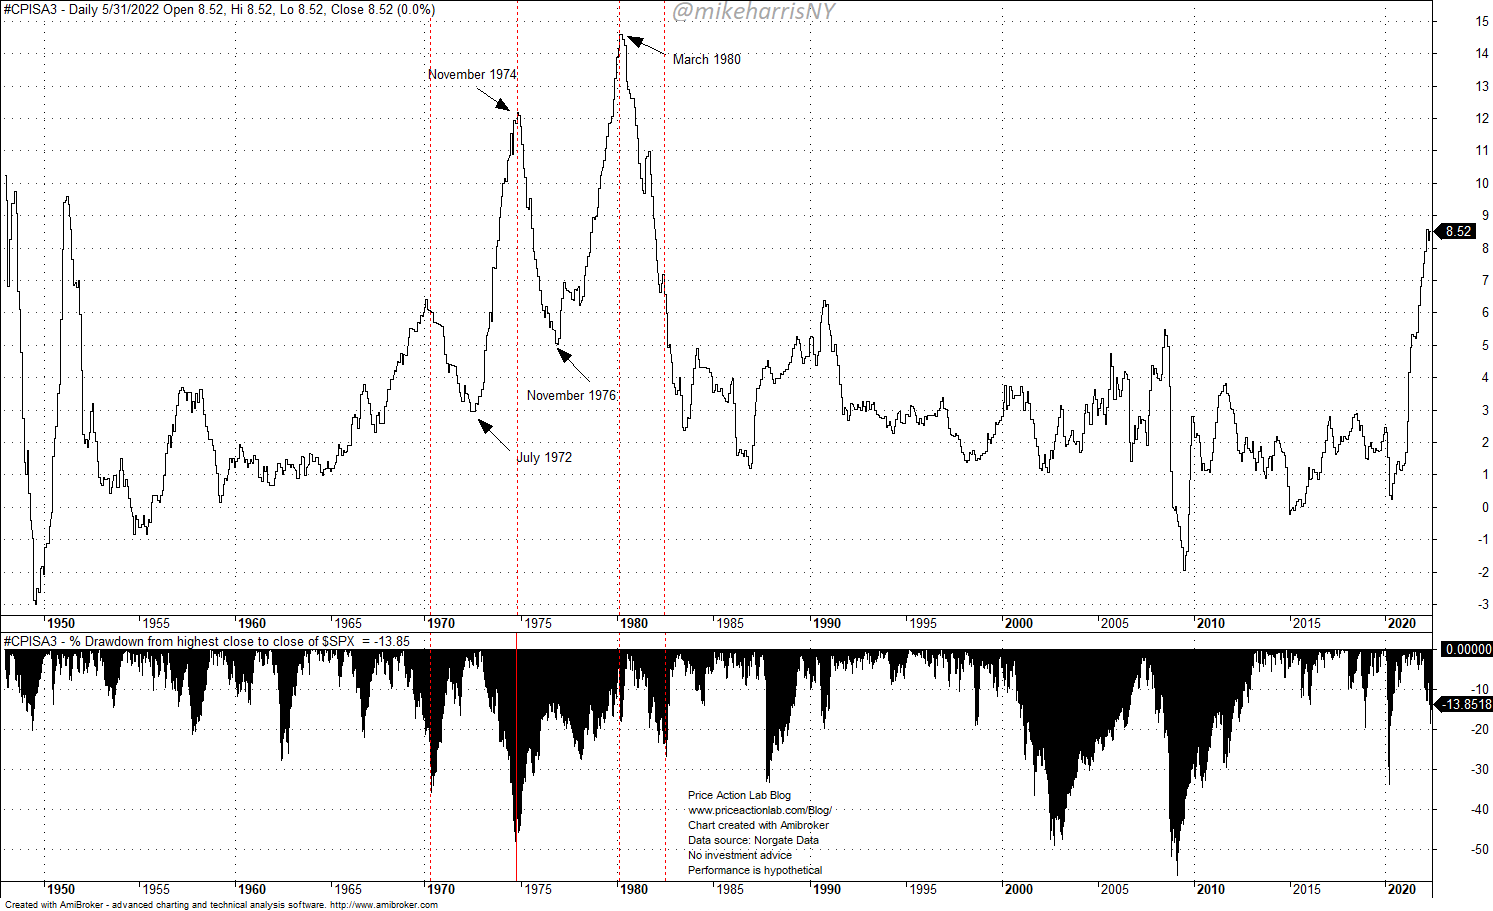
By July 1972, inflation appeared to be coming down. Stocks (SPX) had already recovered from a 36% drop from previous all-time highs and investors were looking forward to new highs and profits.
By November 1974, the CPI had risen above 12%, and the S&P 500 had fallen more than 48% from its previous all-time highs. Inflation started coming down, and there was the hope of new highs in the market.
By November 1976, the CPI had fallen to 5% and stocks had recovered about two-thirds of the losses. Inflation started rising again and stocks fell again, with the drawdown from previous all-time highs reaching 25%.
In March 1980, the CPI was above 14% and stocks were still about 20% below the previous all-time highs. After a long period of high swings, inflation started falling, and by February 1983, stocks had recovered.
The unpredictable nature of inflation and stock market response humbled investors and economists during that period. It is most likely wishful thinking to believe inflation will go straight down from current levels after just a few small interest rate hikes by the Fed. Anything can happen and all scenarios are possible, but what counts is not the subjective probabilities of forecasters but risk management in case things do not go as expected.
If inflation falls temporarily from current levels but then rises again as in 1974, the process could create many bagholders of equity. In my opinion, the proper task of forecasting is to gauge the risks, not to offer optimistic scenarios that investors like to hear. Unfortunately, risk management is not the focus of most public forecasts, but rather a race to see who is going to be proven correct and take the credit. Some will be correct due to the luck factor.
Stock and Bond Market Scenarios
There are optimistic and pessimistic scenarios going forward. The latter is about new lows without a significant rebound from these levels. Since a “summer rally” appears to have started, below are two scenarios for the medium-term path of the S&P 500.
Daily S&P 500 Chart (Price Action Lab Blog – Norgate Data)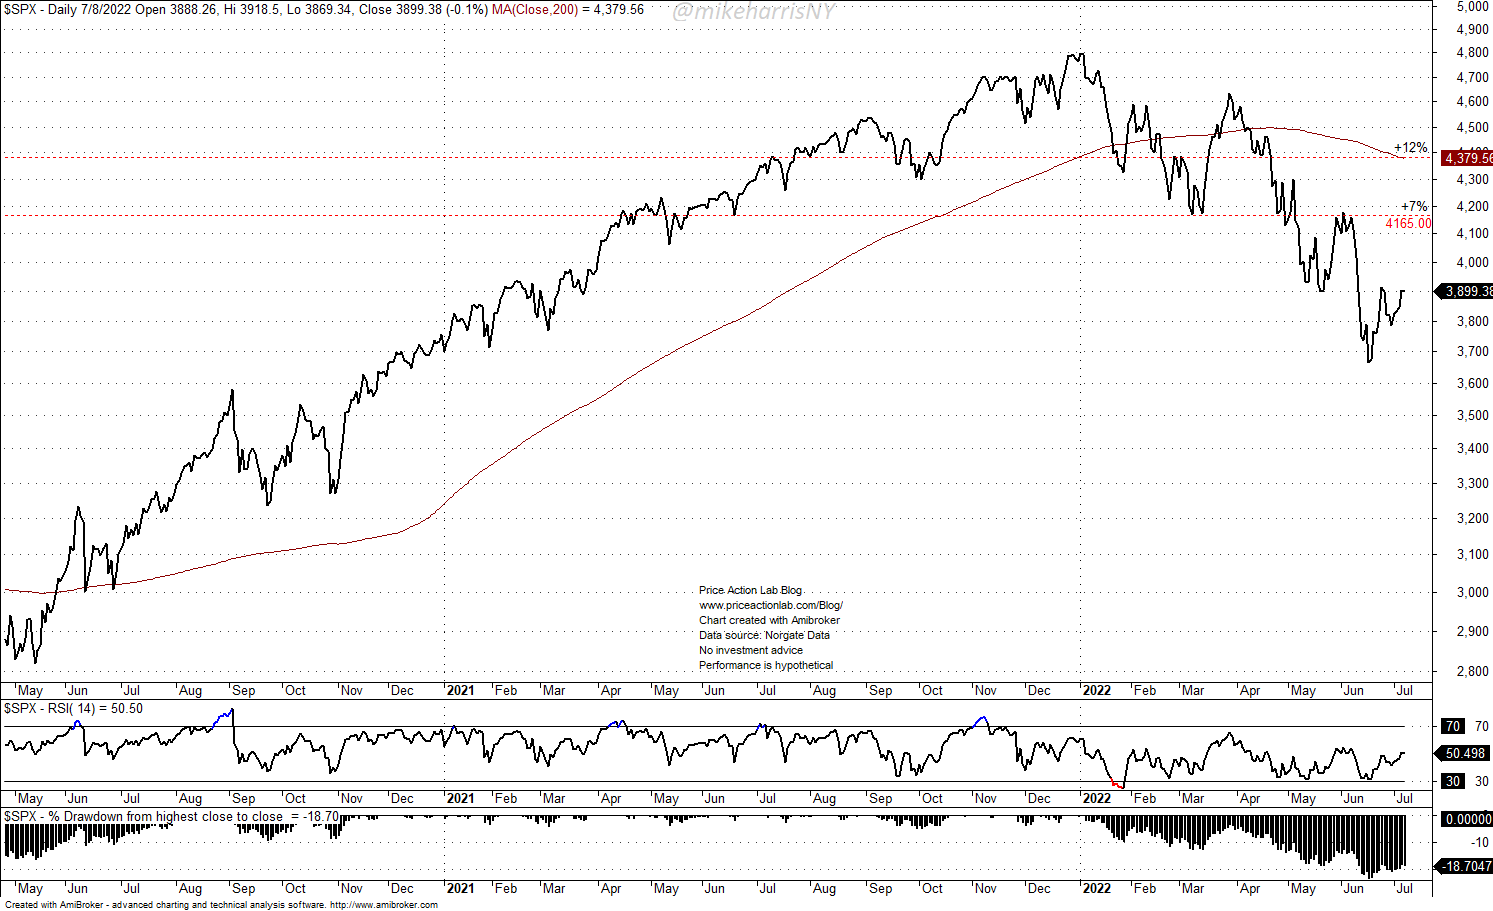
The less optimistic scenario is a rally of 7% from current levels towards 4,165, followed by sideways consolidation for several months.
The most optimistic scenario is for stocks to rise 12% from current levels, with the S&P 500 testing the 200-day moving average before whipsawing and consolidating.
Daily Chart of TLT ETF With Linear Regression (Price Action Lab Blog – Norgate Data)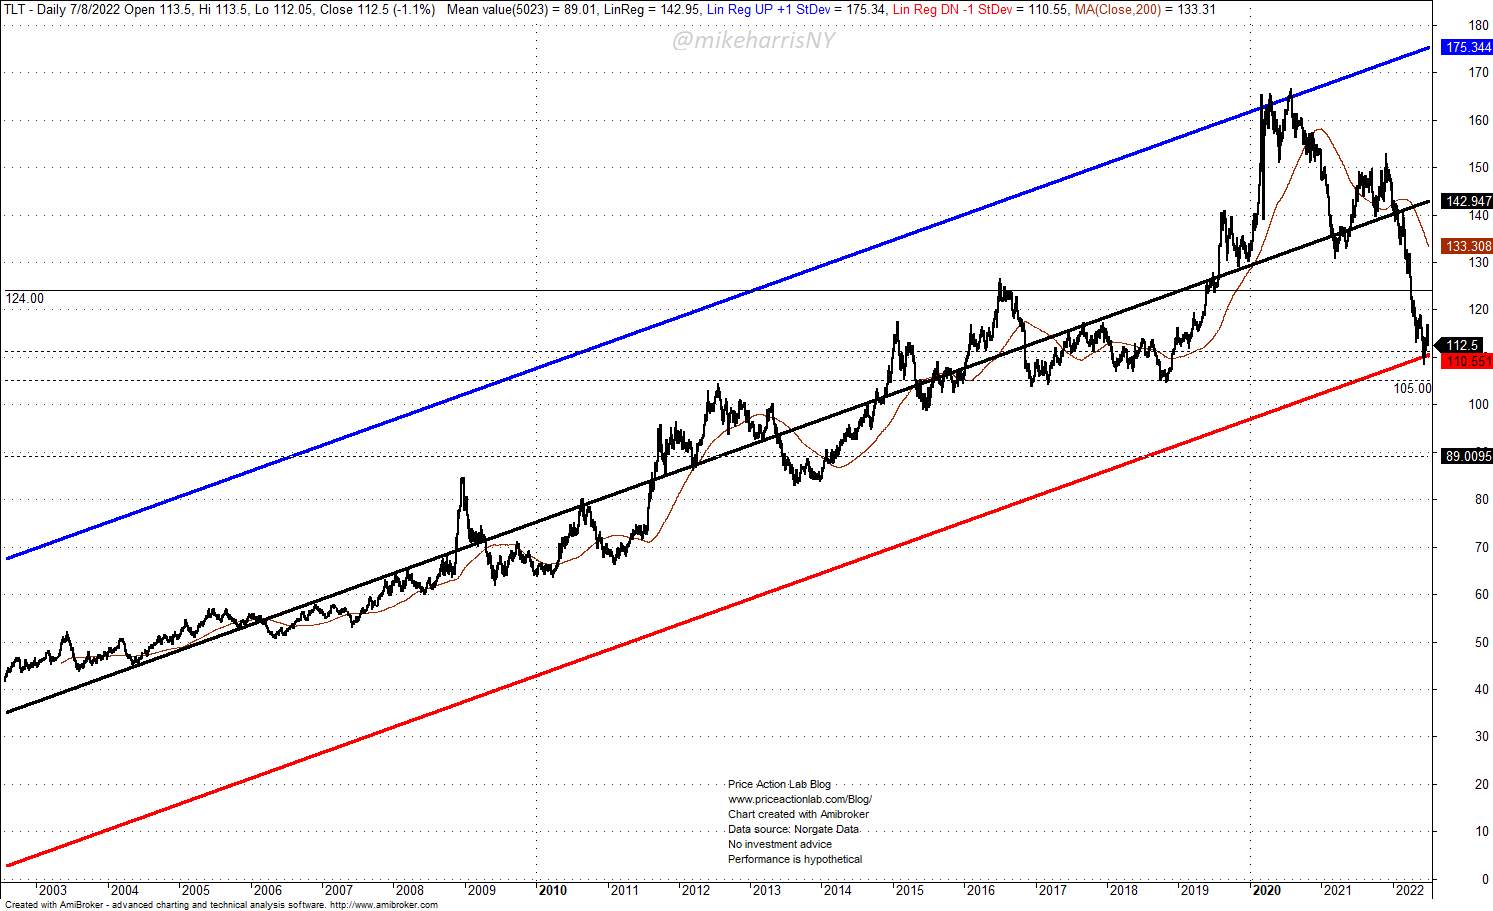
The above TLT ETF (TLT) chart with the one-standard-deviation linear regression channel shows the massive decline from the upper blue line to the lower red line of the channel of about 32%. This has been an unprecedented period of losses for long-duration bonds.
There is always the possibility of a break below the red line and lower lows, but at this point, it appears TLT has found support and could move towards 124 in the short term for a gain of about 10% from current levels.
Just to clarify, probabilities for market scenarios are subjective and dynamic. It is guesswork and there is no science behind it. The bulk of market moves are reflexive, and that renders probabilities and statistical analysis useless. If enough investors believe a recession is coming, even if they are wrong, the market could go up, despite what happens afterward. Therefore, analysts do not know anything to any reasonable precision but can only guess using experience as a guide.
Be the first to comment