

Torsten Asmus/iStock via Getty Images
Let me explain the title first. Since 2015, Blackstone (NYSE:BX) has achieved, on a CAGR basis, ~20% annual appreciation of its stock despite the recent drop. Meanwhile, it is trading at a ~5.5% TTM dividend yield. I struggle to name another stock with a similar appreciation potential and high yield at the same time. Typically investors get either one or the other, but not both.
Does it mean that investors can enjoy both high income and growth in the future? Please read on but be aware that this post assumes a certain familiarity with the company and industry.
Accounting and structural complexities
GAAP accounting is misleading because BX has to consolidate plenty of accounting data that are attributable to non-controlling interests (NCI). Differently from some other alternative asset managers, NCI includes not only investees (mostly owned by Blackstone funds supplied primarily by third parties) but also the owners of the so-called Blackstone Holding Partnership Units.
Blackstone operations are owned by both Blackstone, Inc. (the one trading on NYSE) and the Blackstone Holding Partnership with units exchangeable on a one-to-one basis to BX shares (both groups are equally eligible for dividends and distributions). The unitholders consist of management, employees, and some third parties. Every year (since 2019 when Blackstone was converted into a corporation from a partnership), some units are being converted into shares but new units are being issued to certain newly hired and pre-existing senior managing directors. This process is not very transparent, but currently, about 61% of owners consist of shareholders and 39% of unitholders. For better understanding, here is an image from the last 10-K:
Company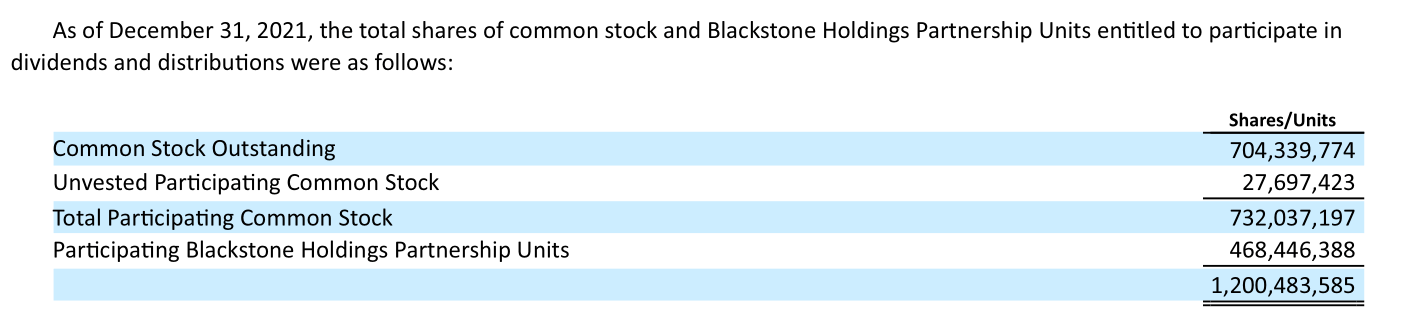
Whenever one reviews Blackstone’s results, she has to split them between transparent shareholders and not-so-transparent unitholders. This picture is further complicated by the different tax statuses of both groups. I will skip the details but in short, it creates the so-called Tax Receivable Agreements (transferring funds from the corporation to unitholders) that BX usually reports together with taxes.
Even within Blackstone, Inc., besides common stocks, there also exist Series I and Series II preferred stocks. The only Series II preferred stockholder (as far as I understand it is the Founder aka Mr. Stephen A. Schwarzman acting through Blackstone Group Management L.L.C.) elects the company’s directors.
There are other privileges for insiders. Let me quote 10-K again:
The Founder, senior managing directors, employees and certain other related parties invest on a discretionary basis in the consolidated Blackstone Funds both directly and through consolidated entities. These investments generally are subject to preferential management fee and performance allocation or incentive fee arrangements. As of December 31, 2021 and 2020, such investments aggregated $1.6 billion and $1.1 billion, respectively.
Summing up, Blackstone’s structure is archaic and favorable to insiders. Common shareholders are at disadvantage (though not at a considerable one). Consequently, despite its size, the company is not eligible for the S&P 500 inclusion (in contrast, for example, with its peer Apollo (APO) due to the recent simplification of its structure).
Because of the reasons mentioned and some additional factors, BX accounting is particularly complex. However, from now on, we will be discussing the company as if these complications did not exist at all.
Valuation complexities
Together with GAAP results, Blackstone publishes its non-GAAP results that filter out accounting and structural complexities. For all practical purposes, investors use only non-GAAP results but their interpretation is not straightforward either.
On a non-GAAP basis, Blackstone has three major sources of revenue and a smaller one:
- Management fees represent periodic fees assessed on third-party capital under Blackstone’s management. They depend on the size of fee-generating assets under management (‘FGAUM’) and are the most stable source of BX’s income. On non-GAAP statements, they are usually grouped with advisory fees which are transactional rather than periodic. However, since advisory fees are much smaller than management fees (perhaps, by the order of magnitude), this grouping is not material.
- Realized performance income (commonly known as carry) is a slice of investment gains/income received by Blackstone upon exit from investments provided investment performance is above a certain hurdle rate. Carry is a big item for BX but it is lumpy. First, exits are not regular and happen only when the investment cycle is over and the investment can be disposed of. And secondly, it is advantageous and easier to exit investments during good markets.
- Fee-related performance income is something in the middle between management fees and carry. Similar to management fees, they are assessed periodically and do not require investment exits. Similar to carry, they are assessed only when certain milestones are reached such as preferred returns or high watermark. Hedge funds’ 20% incentive fees are a good example of fee-related performance income but Blackstone is quite creative in introducing them for different investment vehicles. Fee-related performance income is also big and lumpy.
- Realized principal investment income represents realized returns on Blackstone’s own capital. Blackstone is an asset-light investment manager and provides less than 5% of the limited partner commitments of any particular fund. Consequently, this item is typically much smaller than the three others but also lumpy.
To better understand the environment, let us consider the latest full-year non-GAAP results below:
Company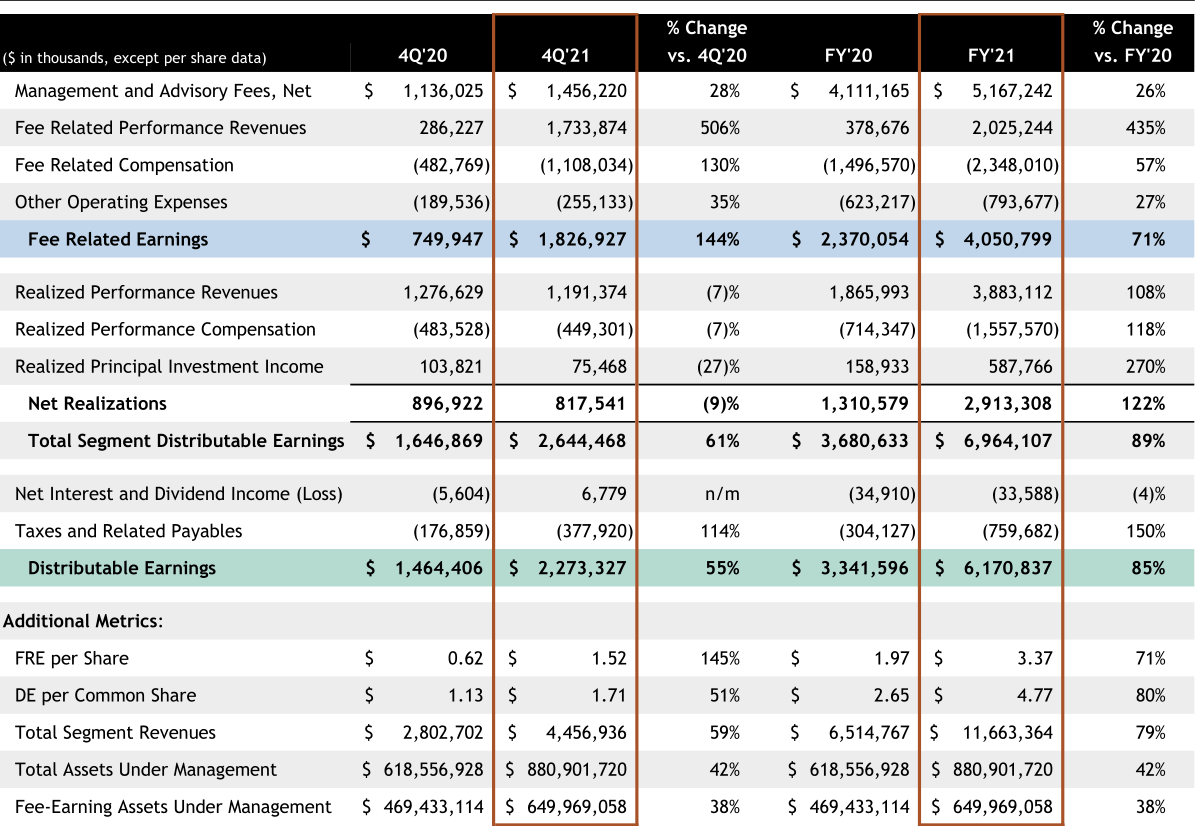
The Distributable Earnings (‘DE’) line (in bold) appears the most important as, per Blackstone’s policy, 85% of DE in a particular quarter will be distributed to shareholders and unitholders in cash the next quarter.
In its turn, DE represents a sum of four sources of income described above less net interest and taxes. We expect management and advisory fees to grow from year to year in line with FGAUM. However, fee-related performance revenues in 2021 were ~6 times higher than in 2020, and carry in 2021 was ~2 times bigger than in 2020. Realized principal in 2021 was ~4 times bigger than in 2020. The difference is partially random, partially due to the growth in FGAUM, but perhaps, mostly due to better markets in 2021 vs 2020 (S&P 500 returns were 28.7% and 18.4% respectively).
In a good year like 2021, Blackstone’s revenues from the management fees can be smaller than from the three other sources combined. This makes Blackstone different from some of its peers. But this is not the only difference.
Fee-related earnings (‘FRE’) are gradually growing for, say, Brookfield Asset Management (BAM) and Apollo and can be rather easily valued. This is not the case for BX, as its FRE includes lumpy fee-related performance revenues that were only ~2.5 times smaller in 2021 than the management fees (BAM and APO have similar sources of revenue but they are small). So, Blackstone’s FRE is a completely different beast than BAM’s or Apollo’s FRE and cannot be valued easily.
Due to the significance of lumpy items, Blackstone’s DE, as well as dividends derived from DE, does not help much to value the company. DE in one accounting period is a poor predictor of what will happen in the next accounting period. For practical purposes, the company’s current high dividend yield cannot be relied upon to make a purchase decision.
Blackstone and other investment companies
An investment company has two major resources for making money at its disposal. It can either deliver returns on its capital or it can extract fees from managing third-party capital. Nothing prevents an investment company to combine both methods.
Equity is the primary metric to measure the company’s capital. Our investment company should try its best to leverage its equity without losing control of the risks involved. For example, Berkshire Hathaway (BRK.B) (BRK.A) uses P&C insurance float for this purpose. Brookfield uses debt, and Apollo uses life insurance liabilities.
The ability to extract fees, on the other hand, is best described by the FGAUM. In the following table, we are crudely comparing resources to make money for four big and successful investors including Blackstone:
Companies’ filings, SA, author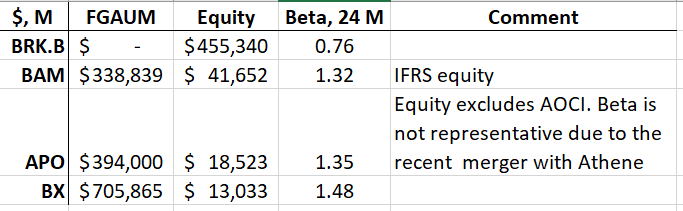
The comparison in the table is not straightforward. For example, IFRS equity for BAM is very different from GAAP equity for the three others, and so on. However, we will focus on the main point only: while BAM and APO are using both resources, Berkshire and BX represent extreme cases. Berkshire does not have any FGAUM and Blackstone has the smallest equity and the biggest FGAUM out of the four.
Since Berkshire can be rather reasonably valued using its equity, we can try to value Blackstone using solely its FGAUM. We do not want to go into details about how BX extracts profits from FGAUM trusting the company to do it most efficiently. Then FGAUM alone determines Blackstone’s earning potential.
Blackstone’s valuations
The table below presents multi-year results for FGAUM/Market Cap for Blackstone. For comparison, we also present the P/DE metric on a trailing basis.
Company, author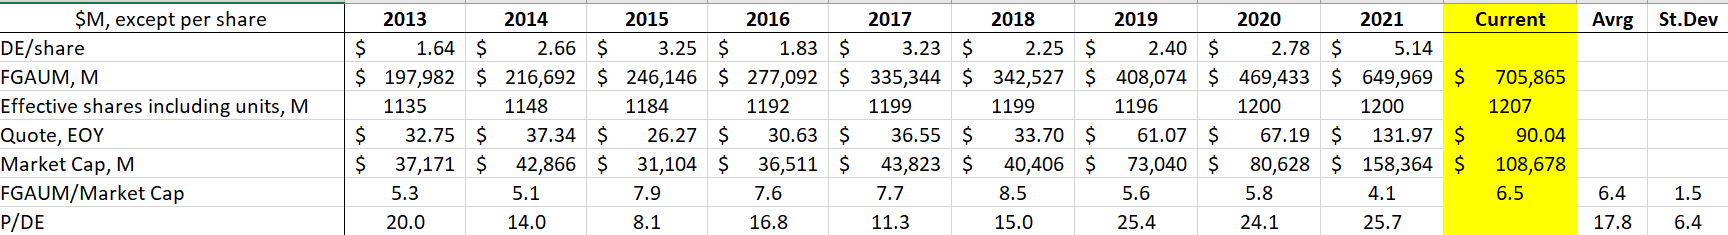
First, the ratio of the average value to its standard deviation is much higher for FGAUM/Market Cap than for P/DE. This is an indication that we have reached some improvement in valuing Blackstone.
Secondly, FGAUM/Market Cap has been fluctuating between 5.1 to 8.5 over the last 10 years with its average value of 6.4. Coincidentally, Blackstone is trading now very close to its average.
Since 2013, Blackstone has been growing FGAUM at ~16% CAGR and we do not see reasons why this growth cannot be repeated (there are several engines for it now, but we will not go into this discussion). Assuming no expansion/contraction of its FGAUM/Market Cap multiple, we can expect forward returns to be the same 16% plus several points in dividends or ~19-20%. The stock appears quite attractive.
Conclusion
Posting about Brookfield and Apollo, I kept receiving questions about Blackstone that I tried to address in this publication.
Please note that Blackstone has a higher beta than its peers. While the stock seems attractive now, the existing volatility may present even better buying points.
I am holding a rather small stake in BX initiated quite recently. It is much smaller than my stakes in BAM or APO simply because I believe I know the latter better. All three biggest alternative asset managers seem rather attractive though I wish Blackstone altered its corporate structure.
And finally about the conundrum I mentioned at the beginning. Blackstone’s capital appreciation is due to the growth of FGAUM while its occasionally high yield is related to particular successful years. Since 2015, the trailing yield has been fluctuating between 2.7 and 11%. High yield is not necessarily the reason to buy BX.
Be the first to comment