

Be wary which stocks you rely on.
ajr_images/iStock via Getty Images
Get ready for charts, images, and tables because they are better than words. The ratings and outlooks we highlight here come after Scott Kennedy’s weekly updates in the REIT Forum. Your continued feedback is greatly appreciated, so please leave a comment with suggestions.
Did you pay attention to our prior high-yield update? We told investors that grasping for yield on GAIN was a bad idea and suggested ARR-C as a replacement. Since then, GAIN fell from $16.90 to $15.52 (down over 8%, or about 1.5 years worth of dividends). Meanwhile, ARR-C fell from $25.61 to $25.57 while paying out a monthly dividend for $.1458 per share. I don’t expect to usually be right so quickly. Mispricing in stocks can last far longer than a few weeks and it usually does. Further, a comparison between a BDC and a preferred share is a pretty strange comparison.
This time I’ll compare two mortgage REITs. Cherry Hill Mortgage (CHMI) facing off against PennyMac Mortgage Investment Trust (PMT).
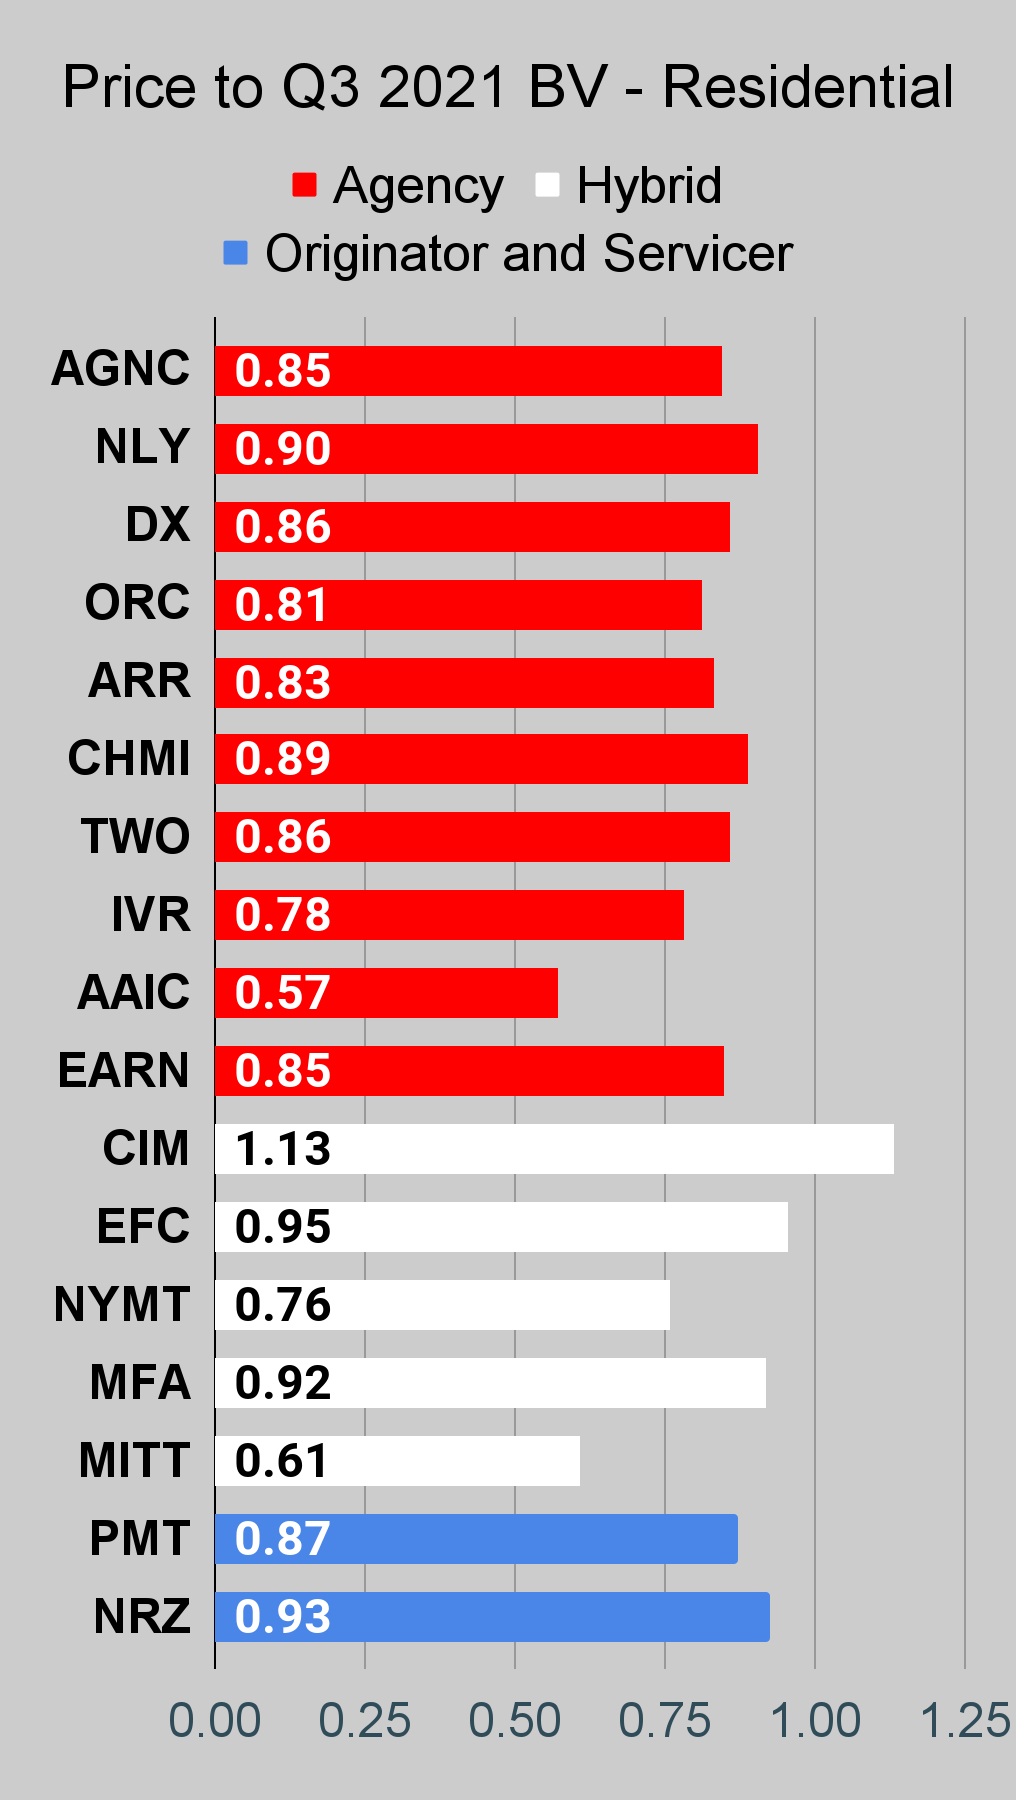
By our estimates, both REITs trade at a discount to current (1/14/2022) projected book value per share. We’ll have new estimates for 1/21/2022 in the subscriber update, usually published on Sunday evenings.
Further, by our estimates, CHMI has a smaller discount to book value than PMT. That’s interesting because PMT deserves a higher price-to-book ratio than CHMI.
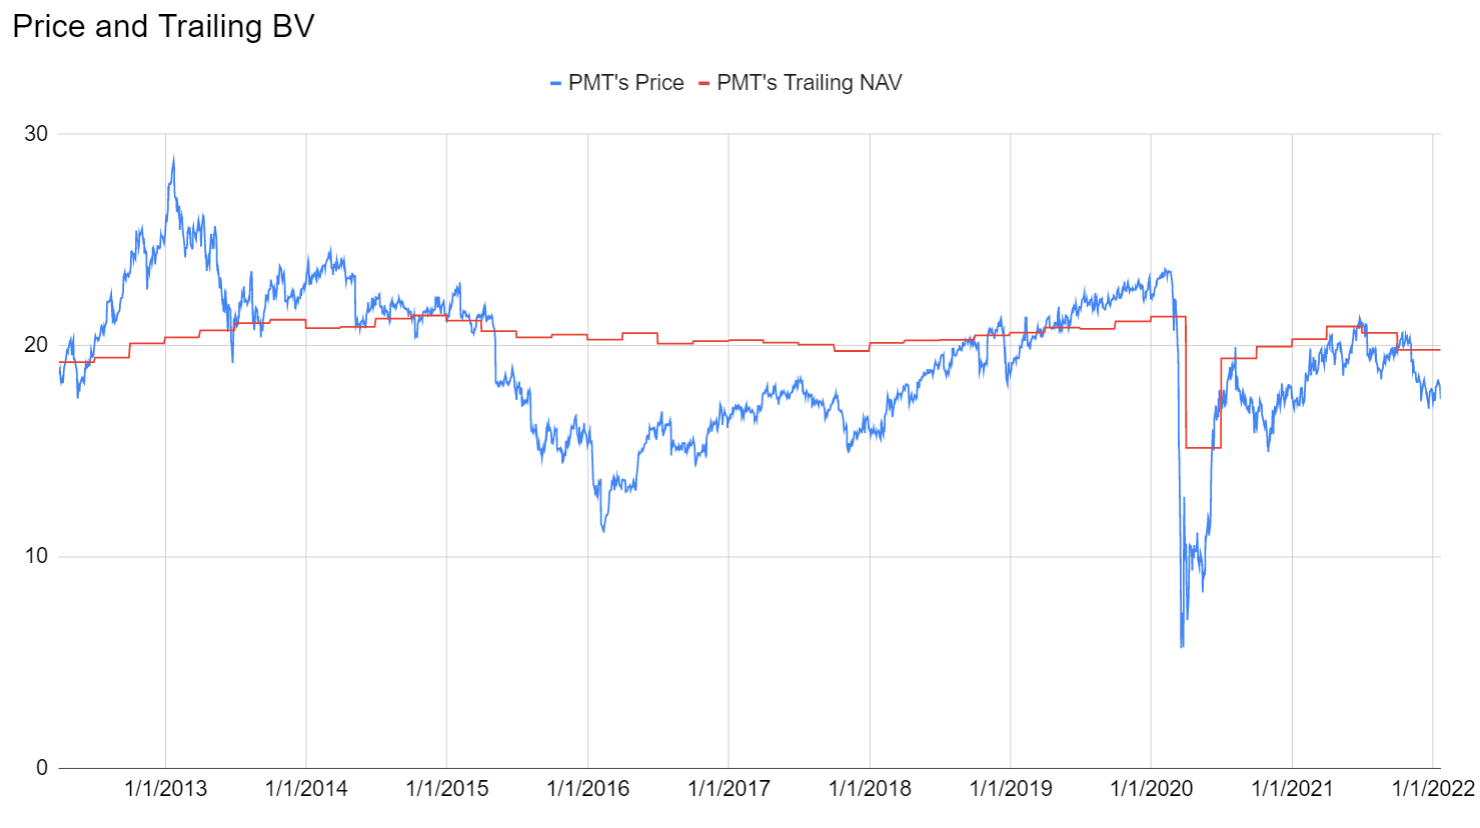
Let’s take a look at how PMT’s share price and book value have changed over the last several years:
The REIT Forum
We’re just using the quarterly trailing book values for that chart. It isn’t as precise as it would be with our estimates following changes during the quarter, but it still gives investors a pretty good idea. Book value took a big hit during the pandemic after being relatively flat for many years. Then over the next several quarters it recovered most of the book value that had been lost before seeing value dip. While we don’t “know” the latest value for PMT’s book value, we do have detailed estimates. Those estimates suggest the share price declined by much more than the BV declined.
All in all, that chart for share price and BV is very impressive for a REIT with an 11% dividend yield.
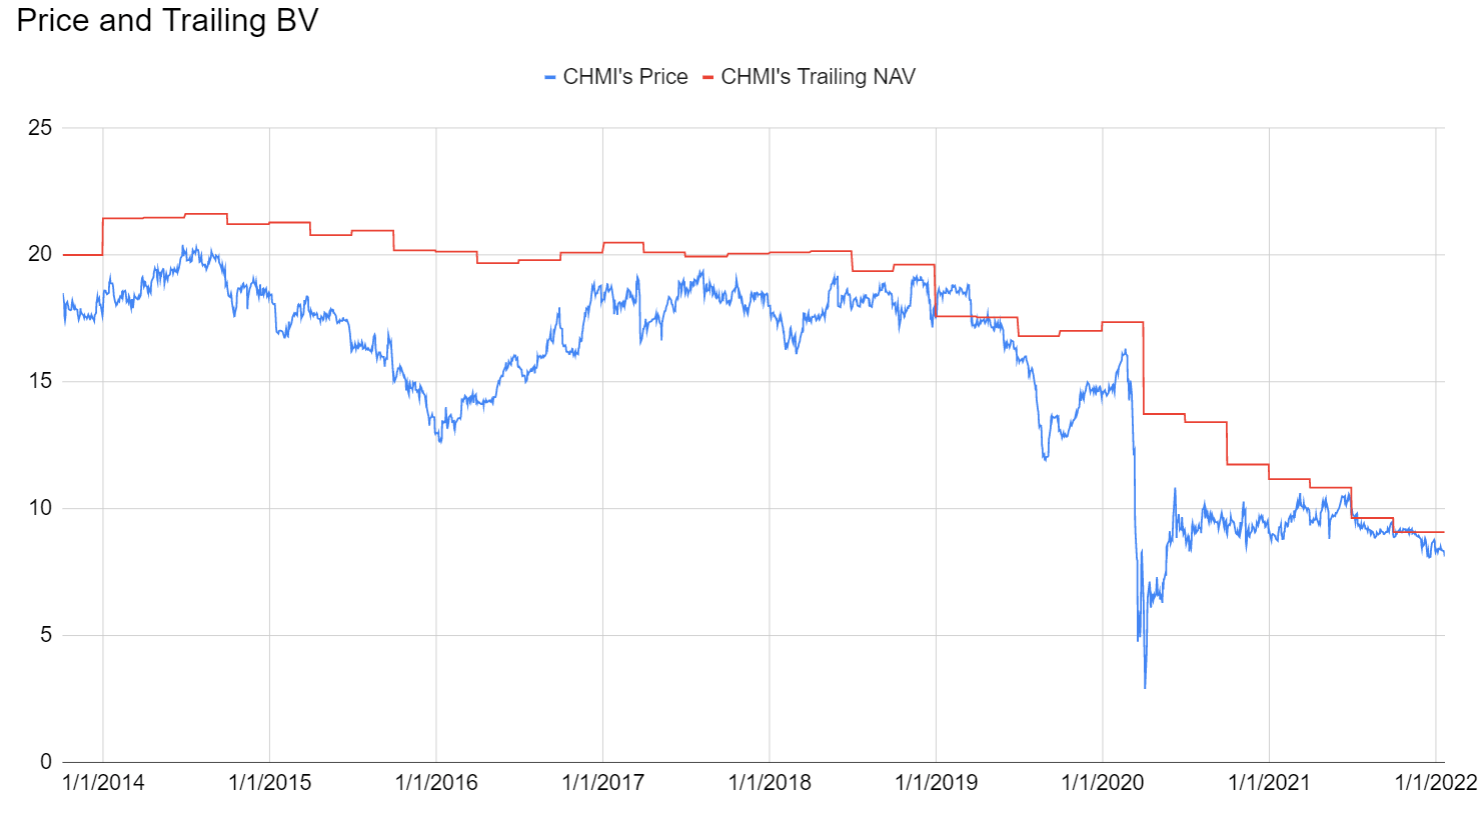
Now let’s turn our gaze over to CHMI:
The REIT Forum
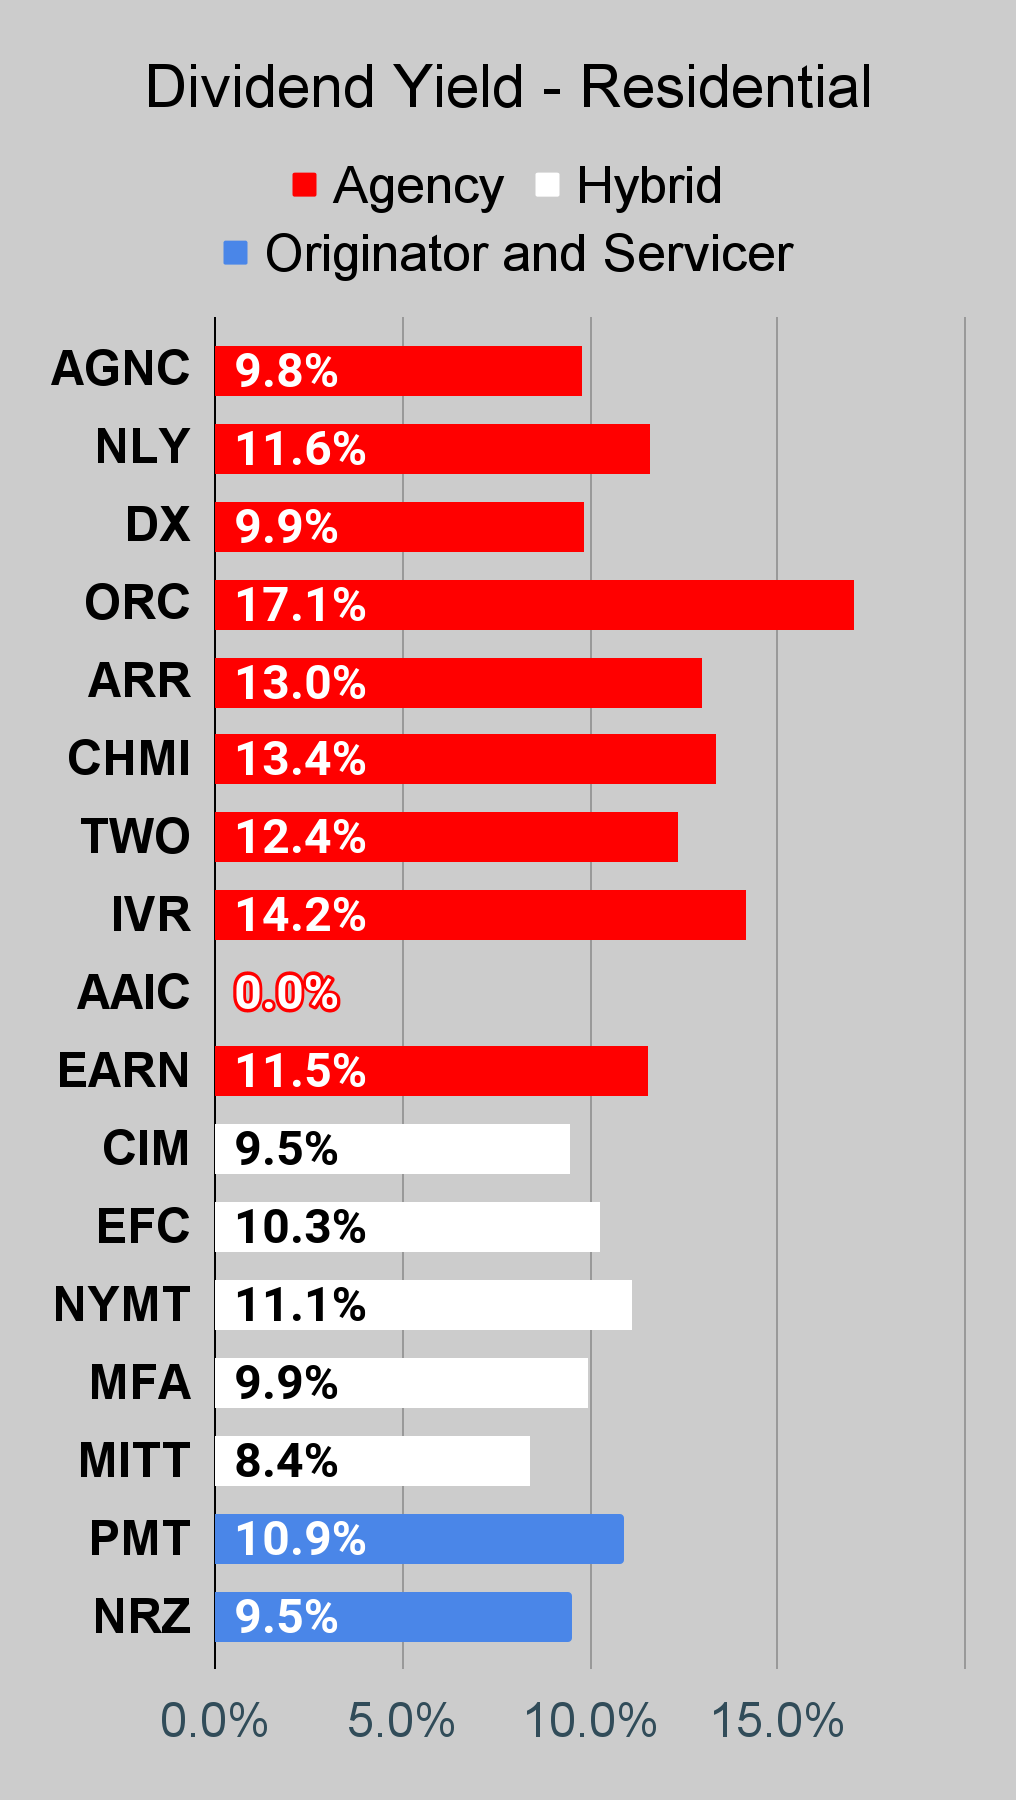
That’s not so impressive. In early 2014 CHMI’s BV per share was running above $21.00. As of Q3 2021 it was down to $9.07. Not impressive. Perhaps even worse, following the pandemic plunge there was still a continued trend lower in BV per share. That’s weak. Anyone who wants to tell me that the 13.4% yield on CHMI is enough to justify taking it over PMT has an addiction to yield chasing.
If investors are going to play with CHMI, they should be demanding a large discount to book value so they can look for a recovery in the share price (to take their gains, not to keep holding it). On the other hand, PMT can be a good deal with only a moderate discount to book value.
Since it may have slipped past investors, I’m going to say it again. As of today, CHMI has a higher price-to-estimated-current-book ratio than PMT. Investors who are picking CHMI aren’t doing it because they are getting a bigger discount. They’re getting a smaller discount. So how much do you love the extra yield? Enough to punish your portfolio long-term? I’d rather keep my portfolio healthy.
Conclusion
Here’s an idea for investors with CHMI. Replace those shares with PMT and get a much better risk/reward profile. You’ve got CHMI and have an unrealized loss? Well, that doesn’t change which share is a better investment today. The fact remains that CHMI simply lost a huge portion of the value of its underlying portfolio. It’s gone. Ignoring that doesn’t change reality. There was a reasonable chance for mortgage REITs to see a recovery in BV during Q2 2020. Most of them did. Believing CHMI needs to recover to a prior price is like expecting the outcome of a prior coin flip to change.
The rest of the charts in this article may be self-explanatory to some investors. However, if you’d like to know more about them you’re encouraged to see our notes for the series.
Stock Table
We will close out the rest of the article with the tables and charts we provide for readers to help them track the sector for both common shares and preferred shares.
We’re including a quick table for the common shares that will be shown in our tables:
Let the images begin!
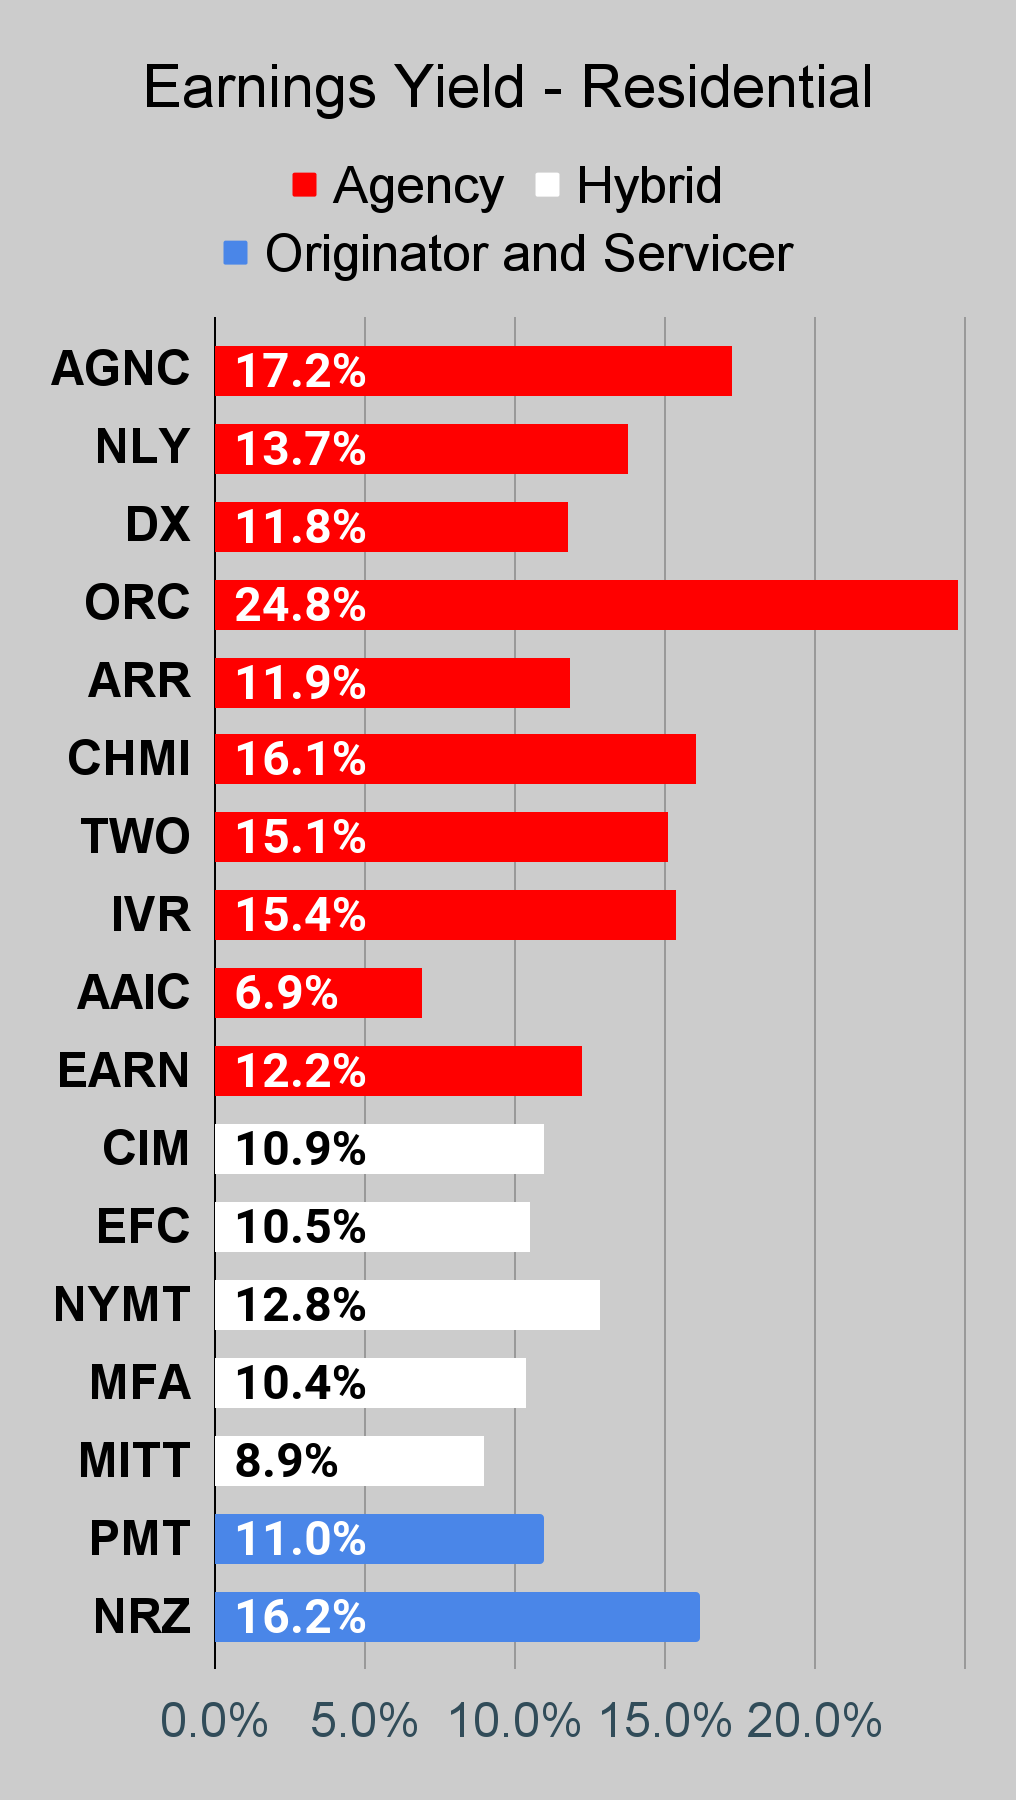
Residential Mortgage REIT Charts
 The REIT Forum |
 The REIT Forum |
 The REIT Forum |
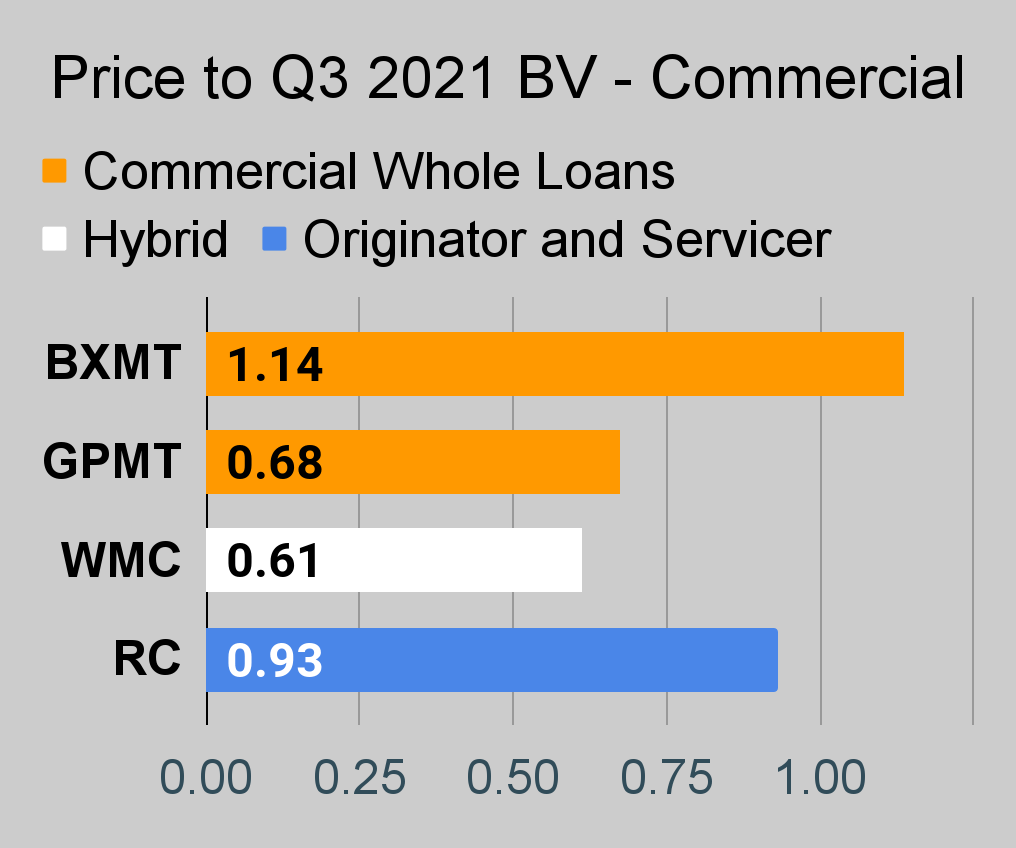
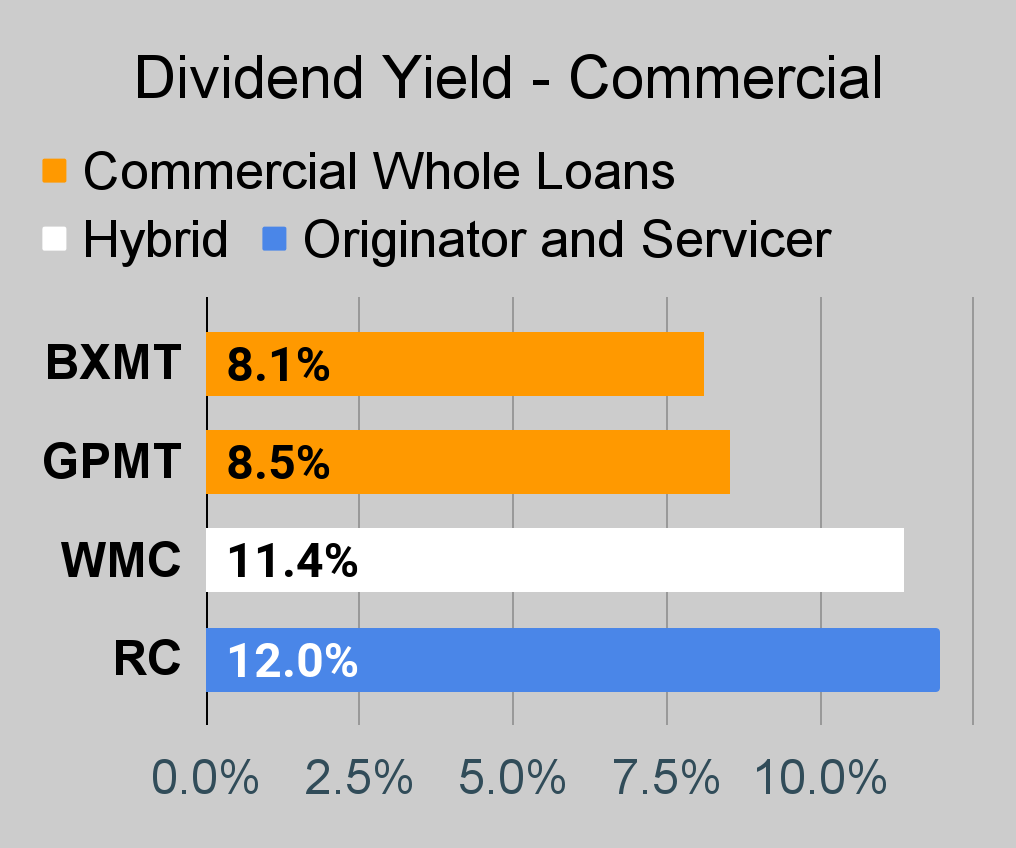
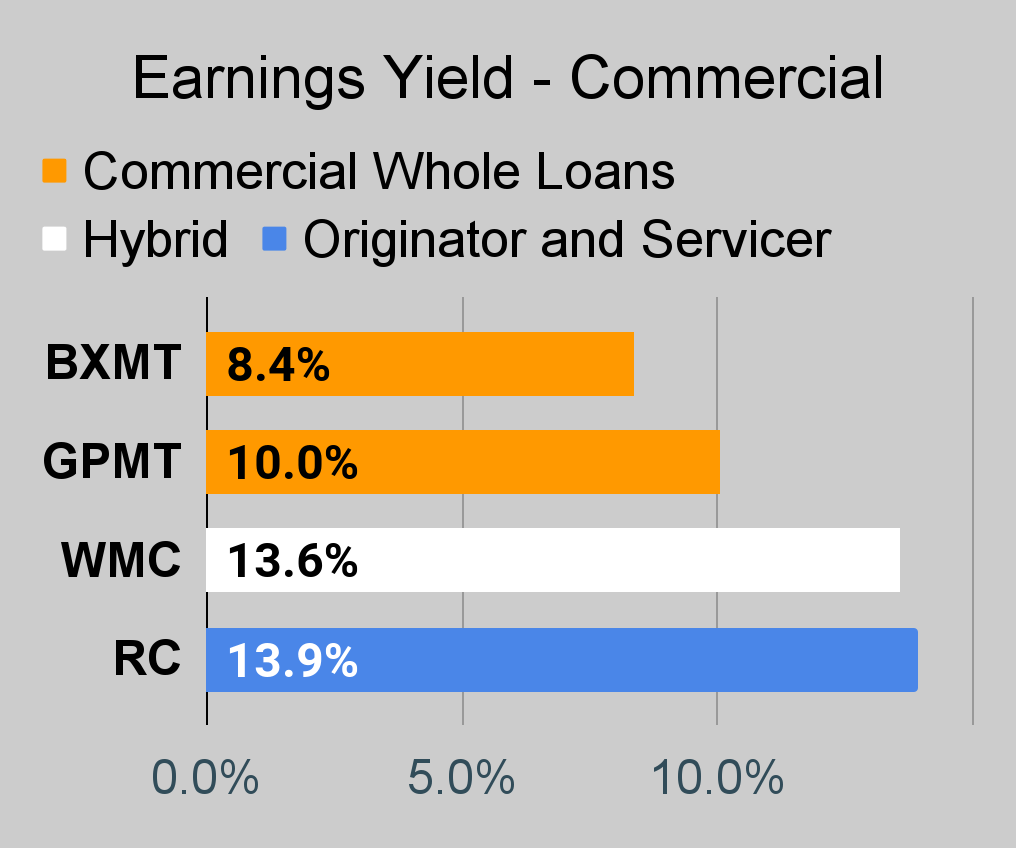
Commercial Mortgage REIT Charts
 The REIT Forum |
 The REIT Forum |
 The REIT Forum |
BDC Charts
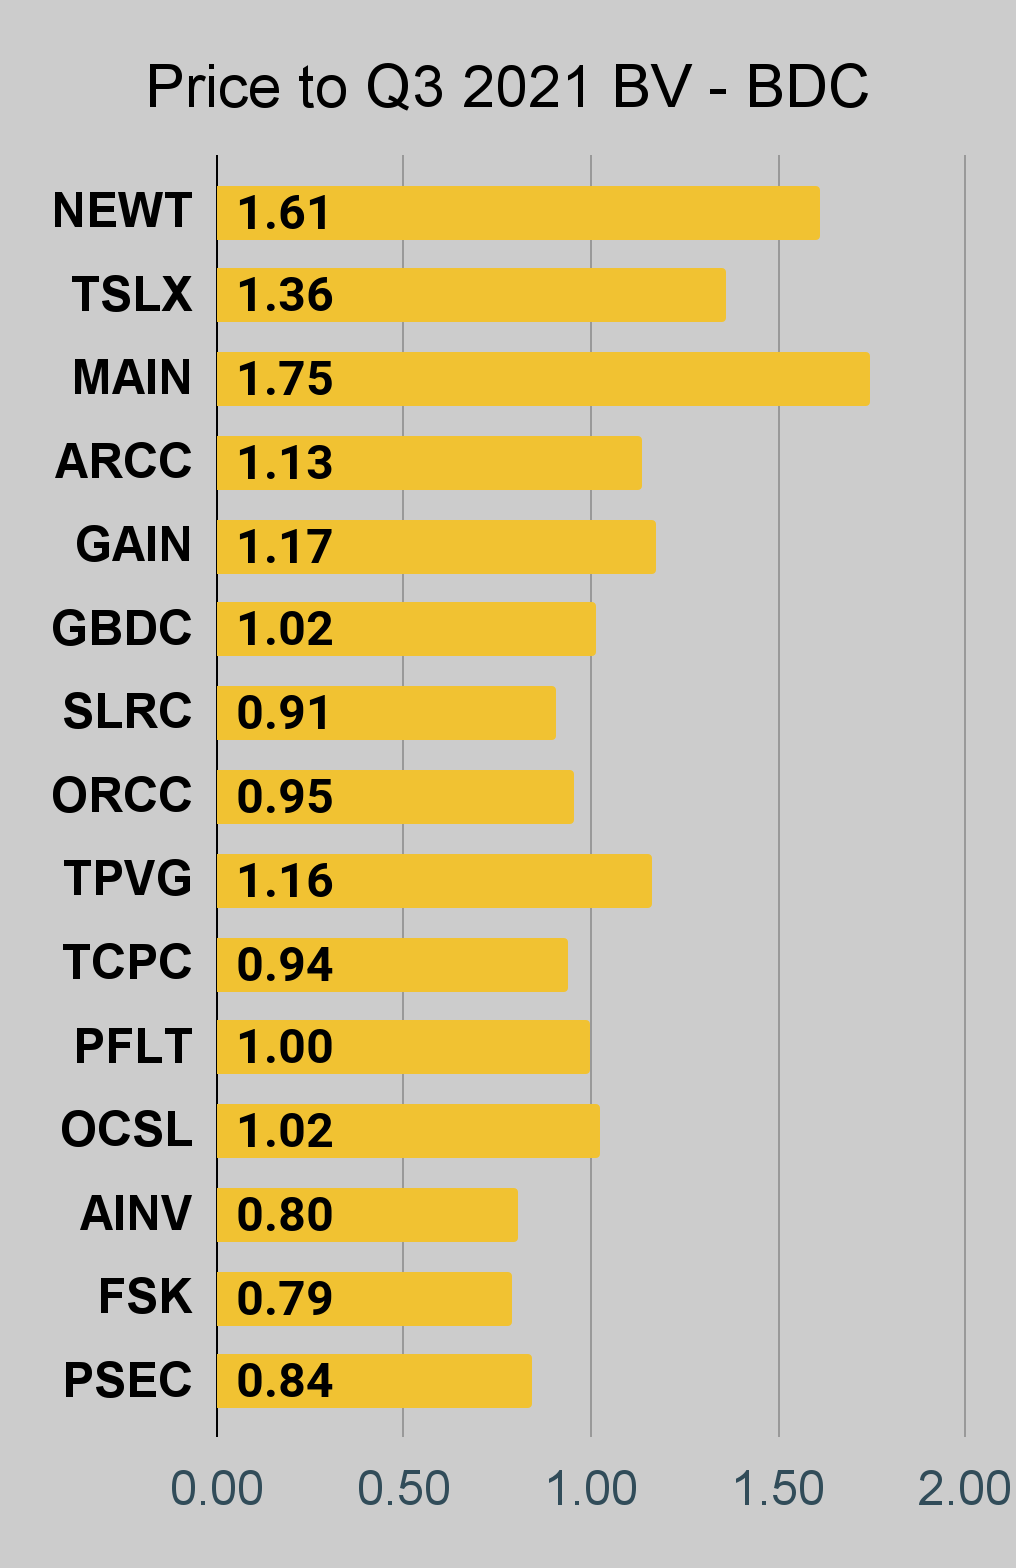 The REIT Forum |
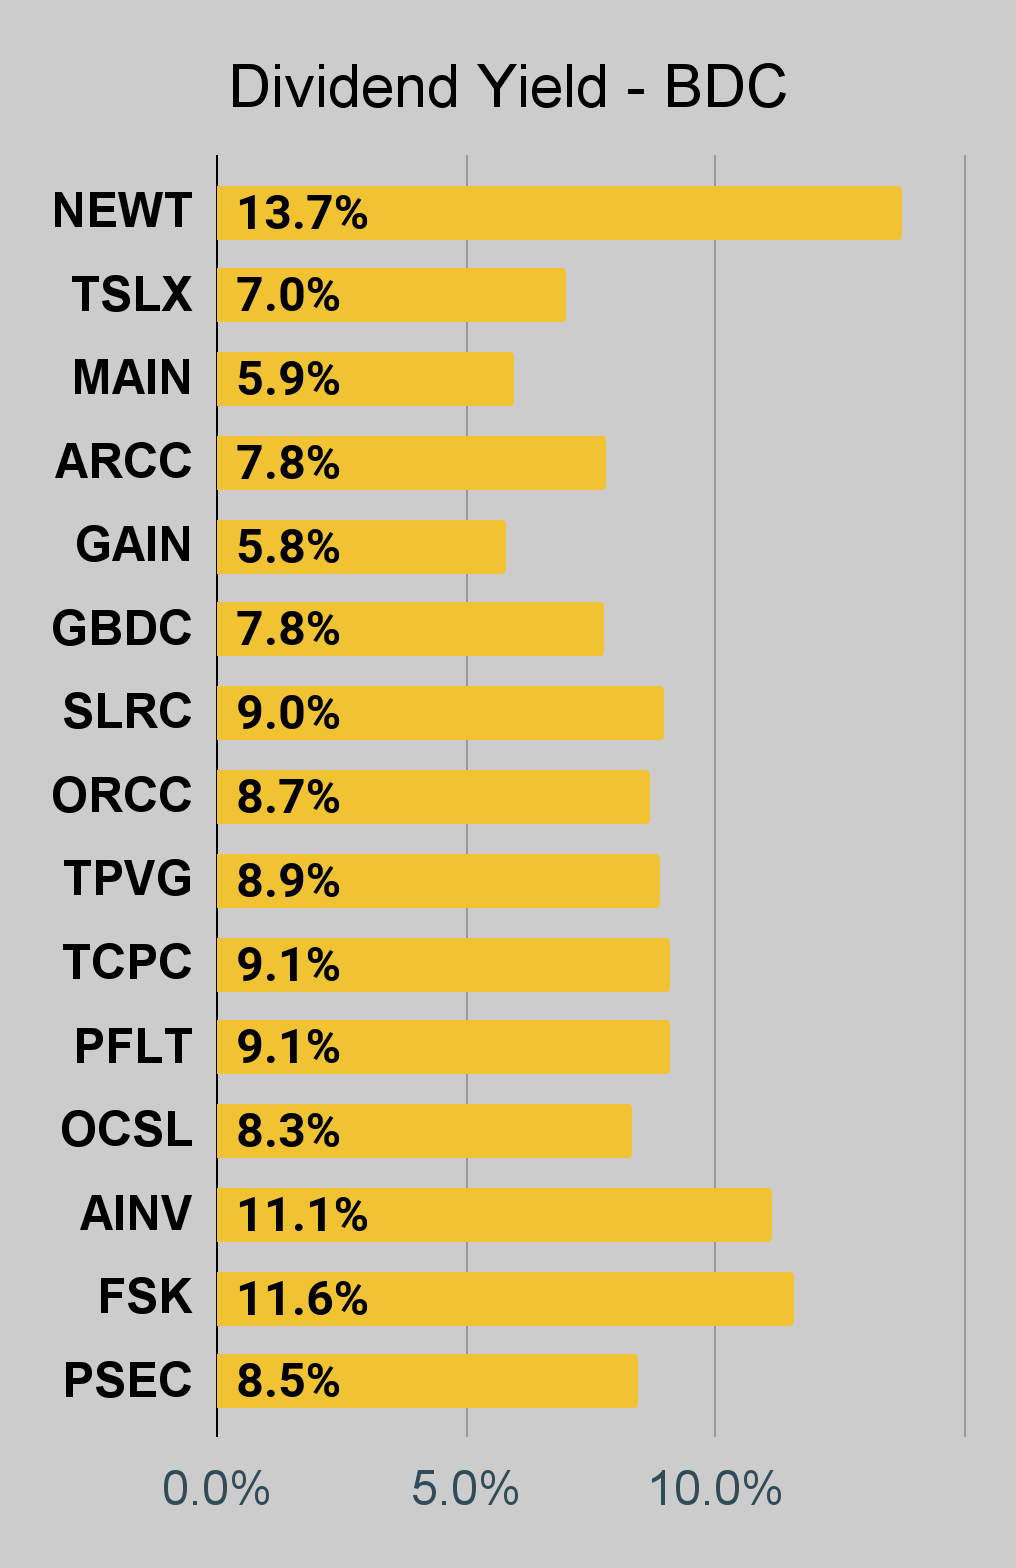 The REIT Forum |
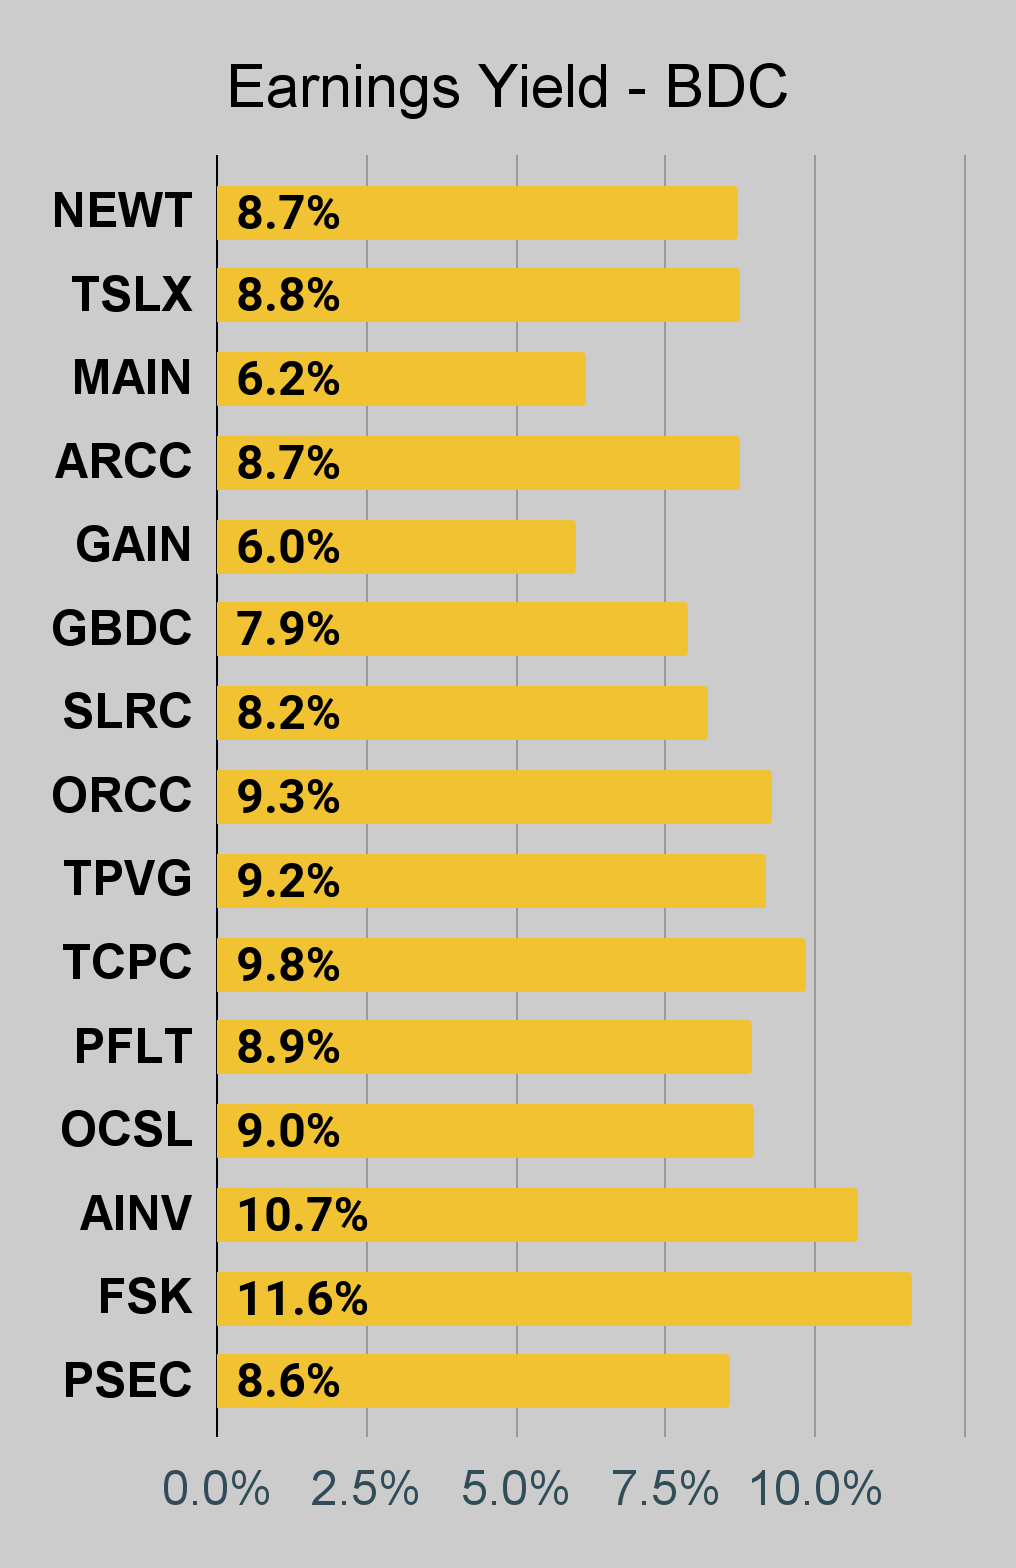 The REIT Forum |
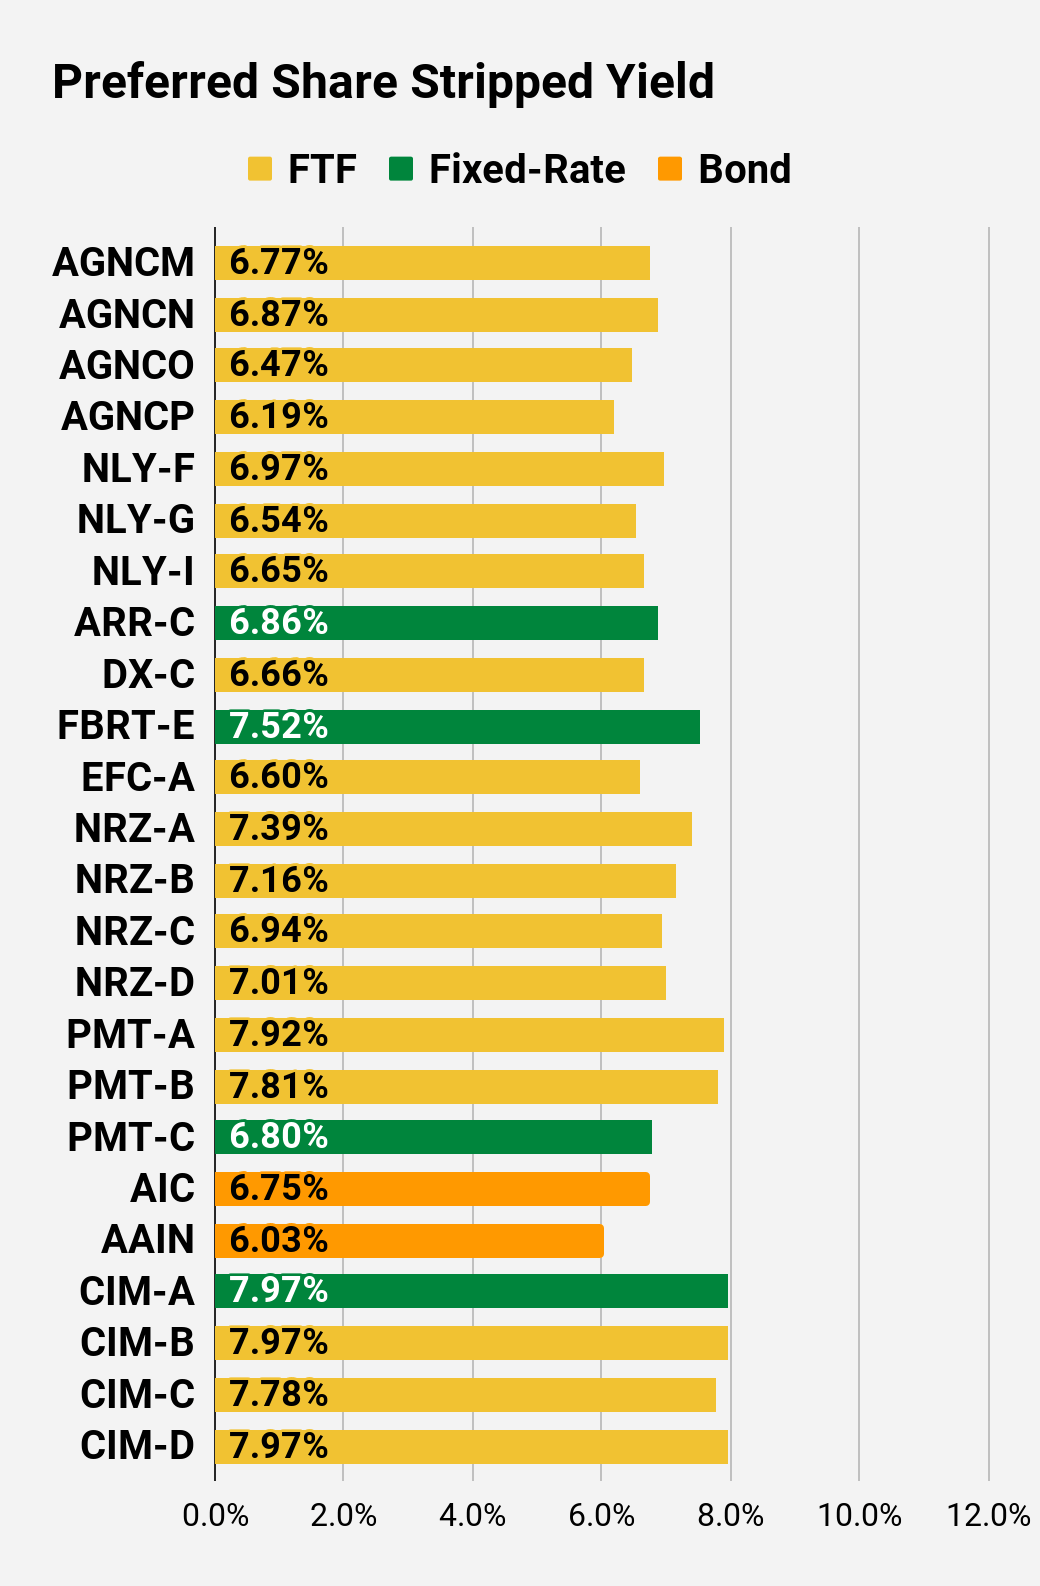
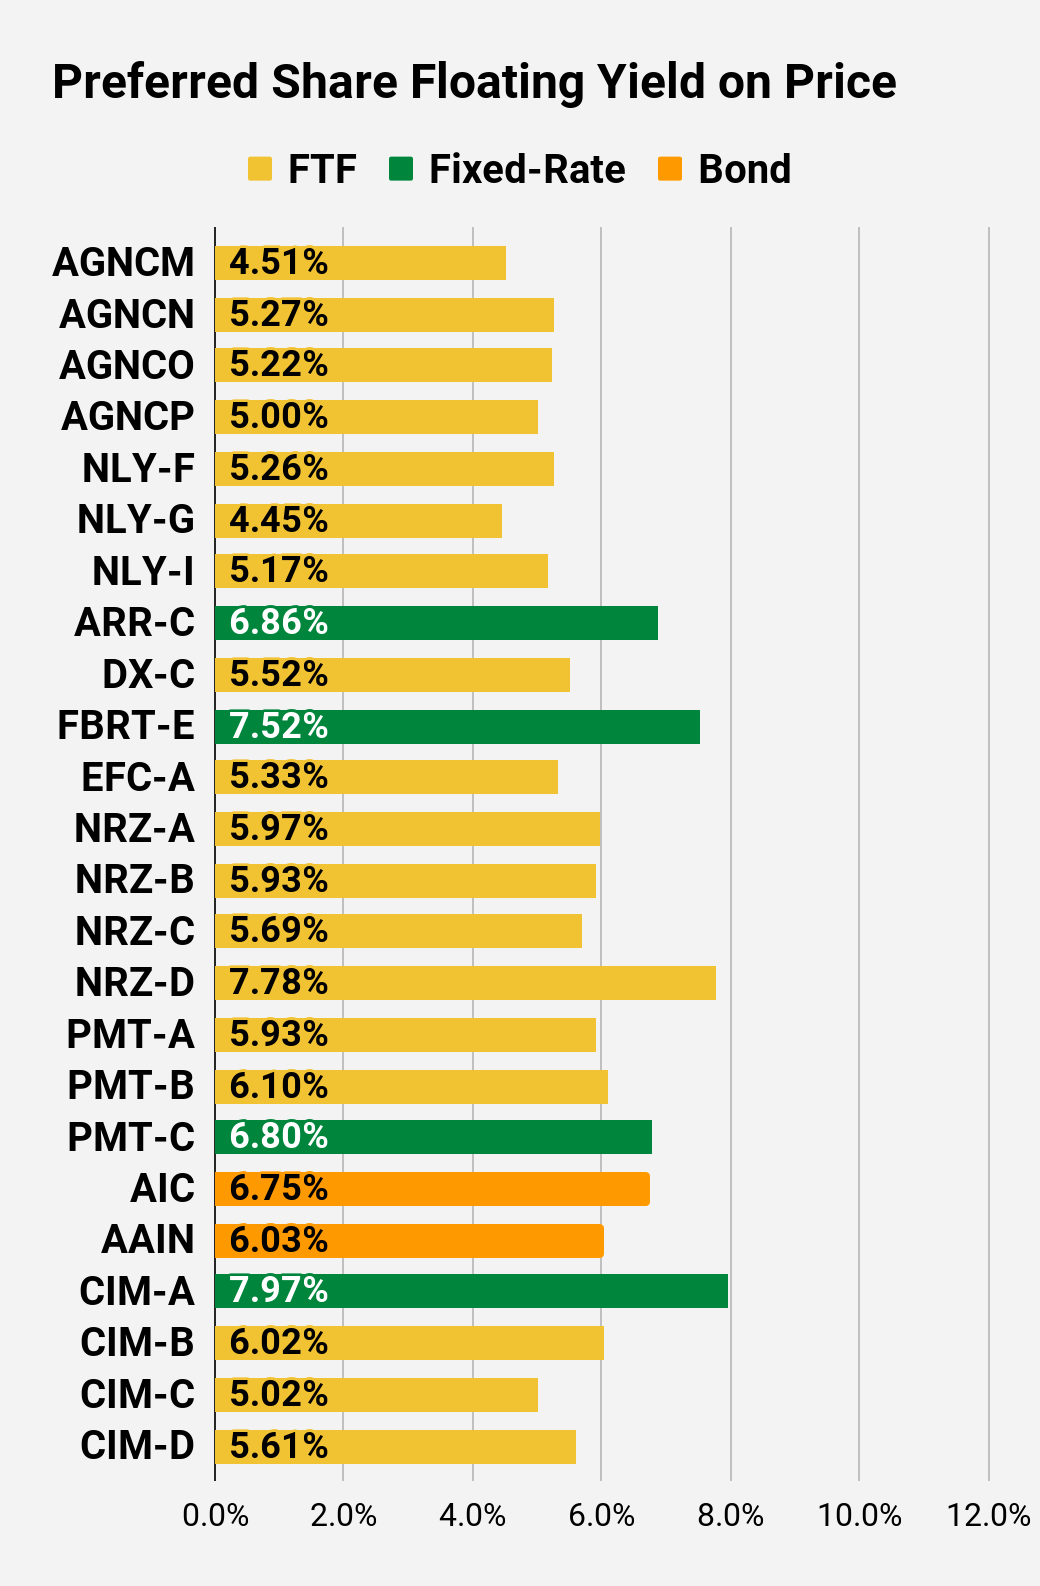
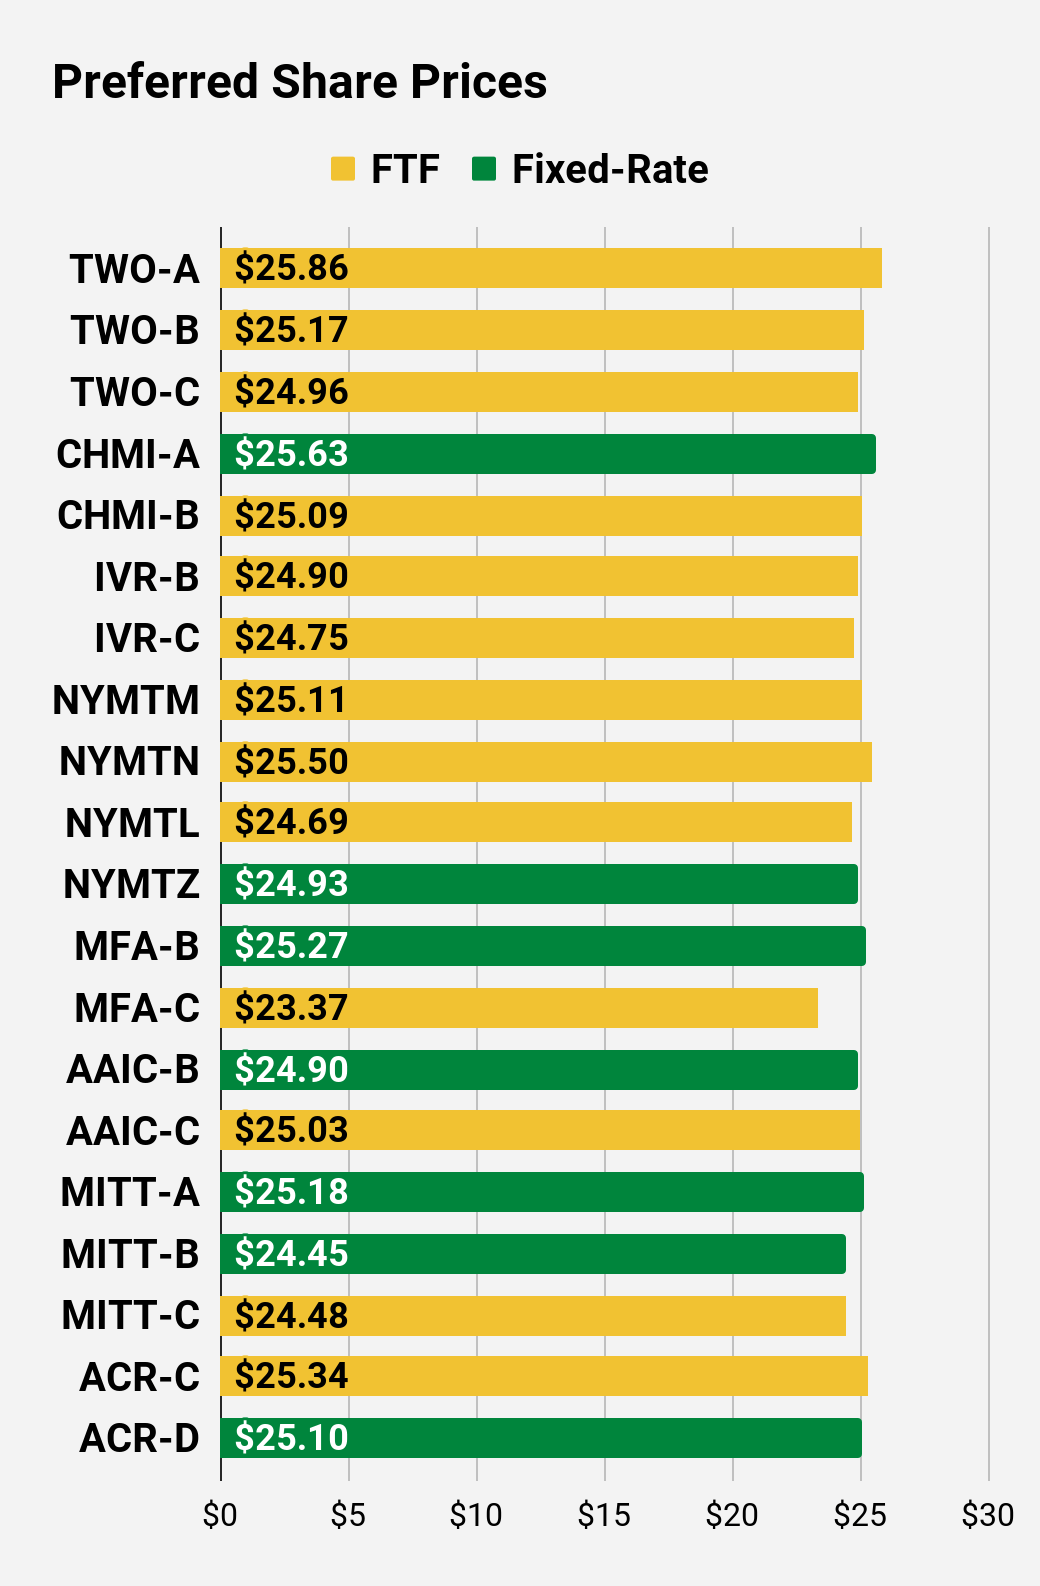
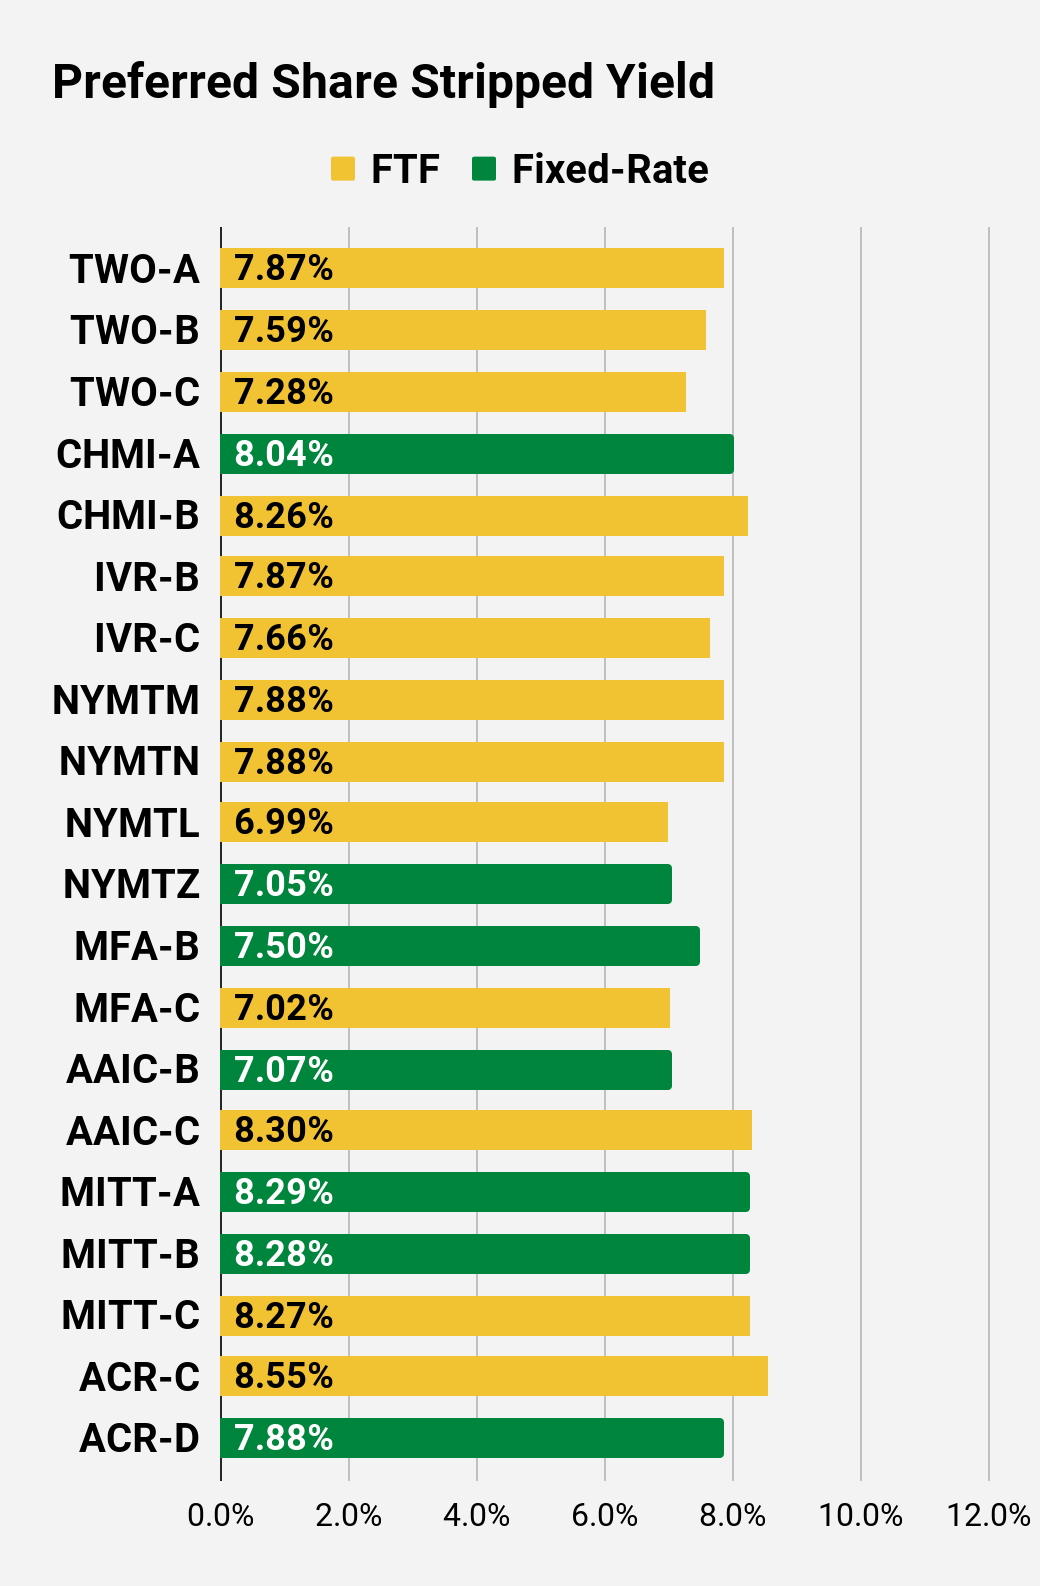
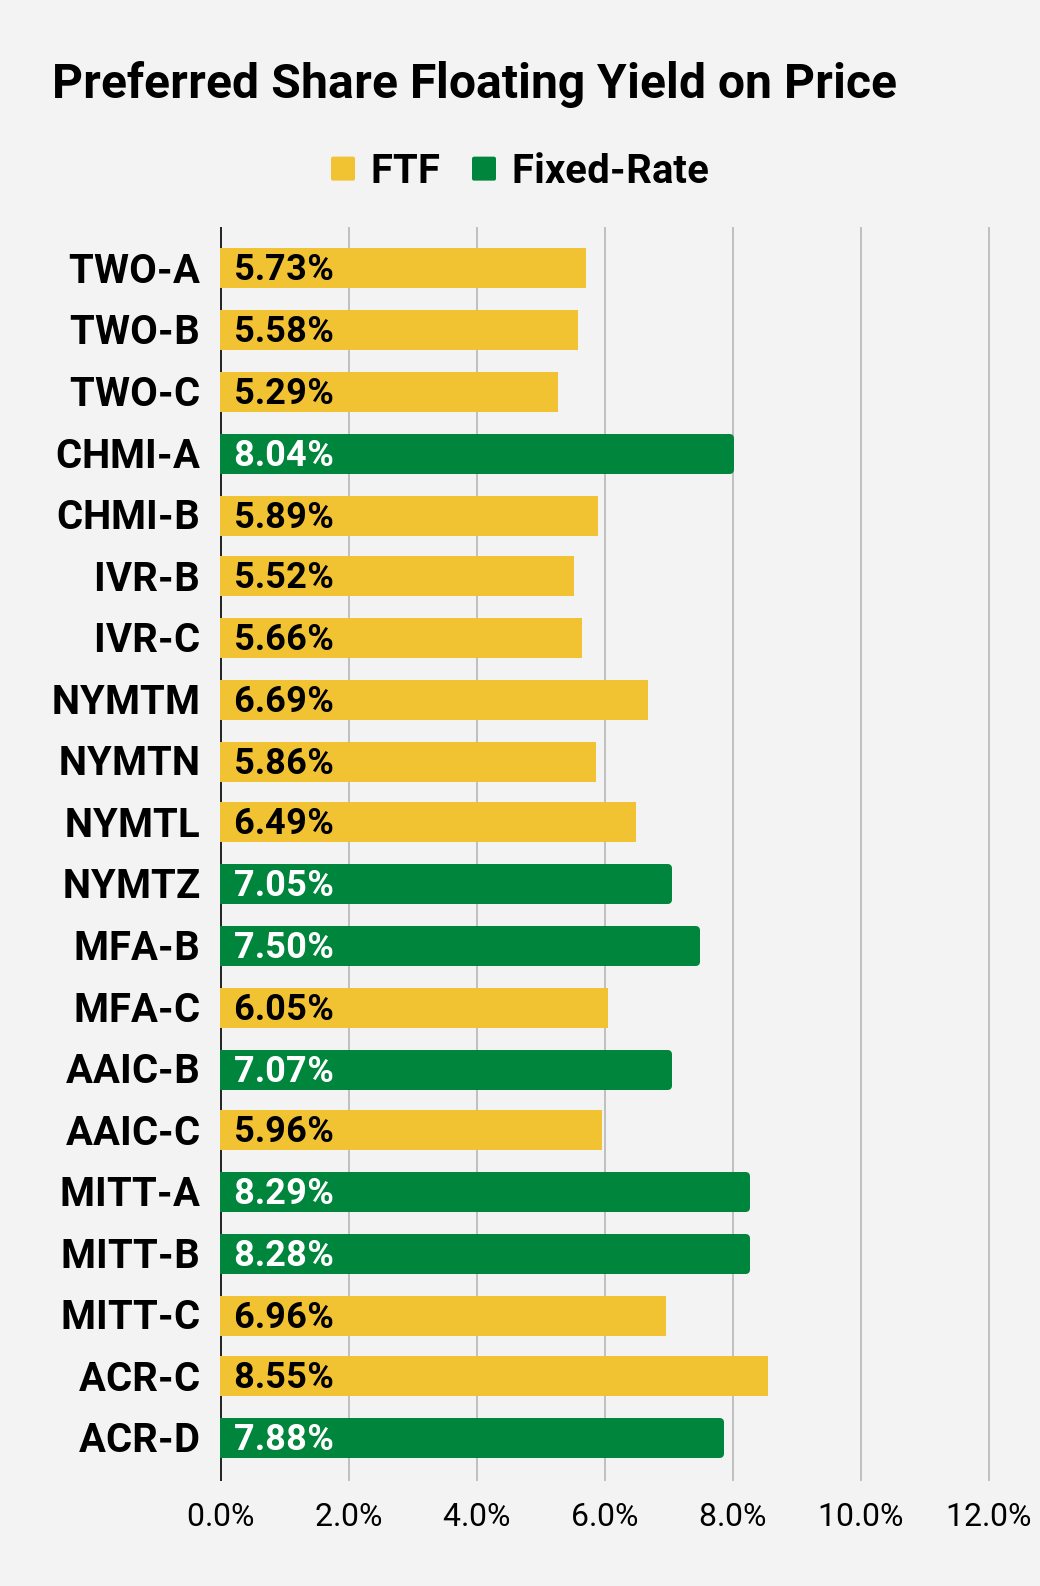
Preferred Share Charts
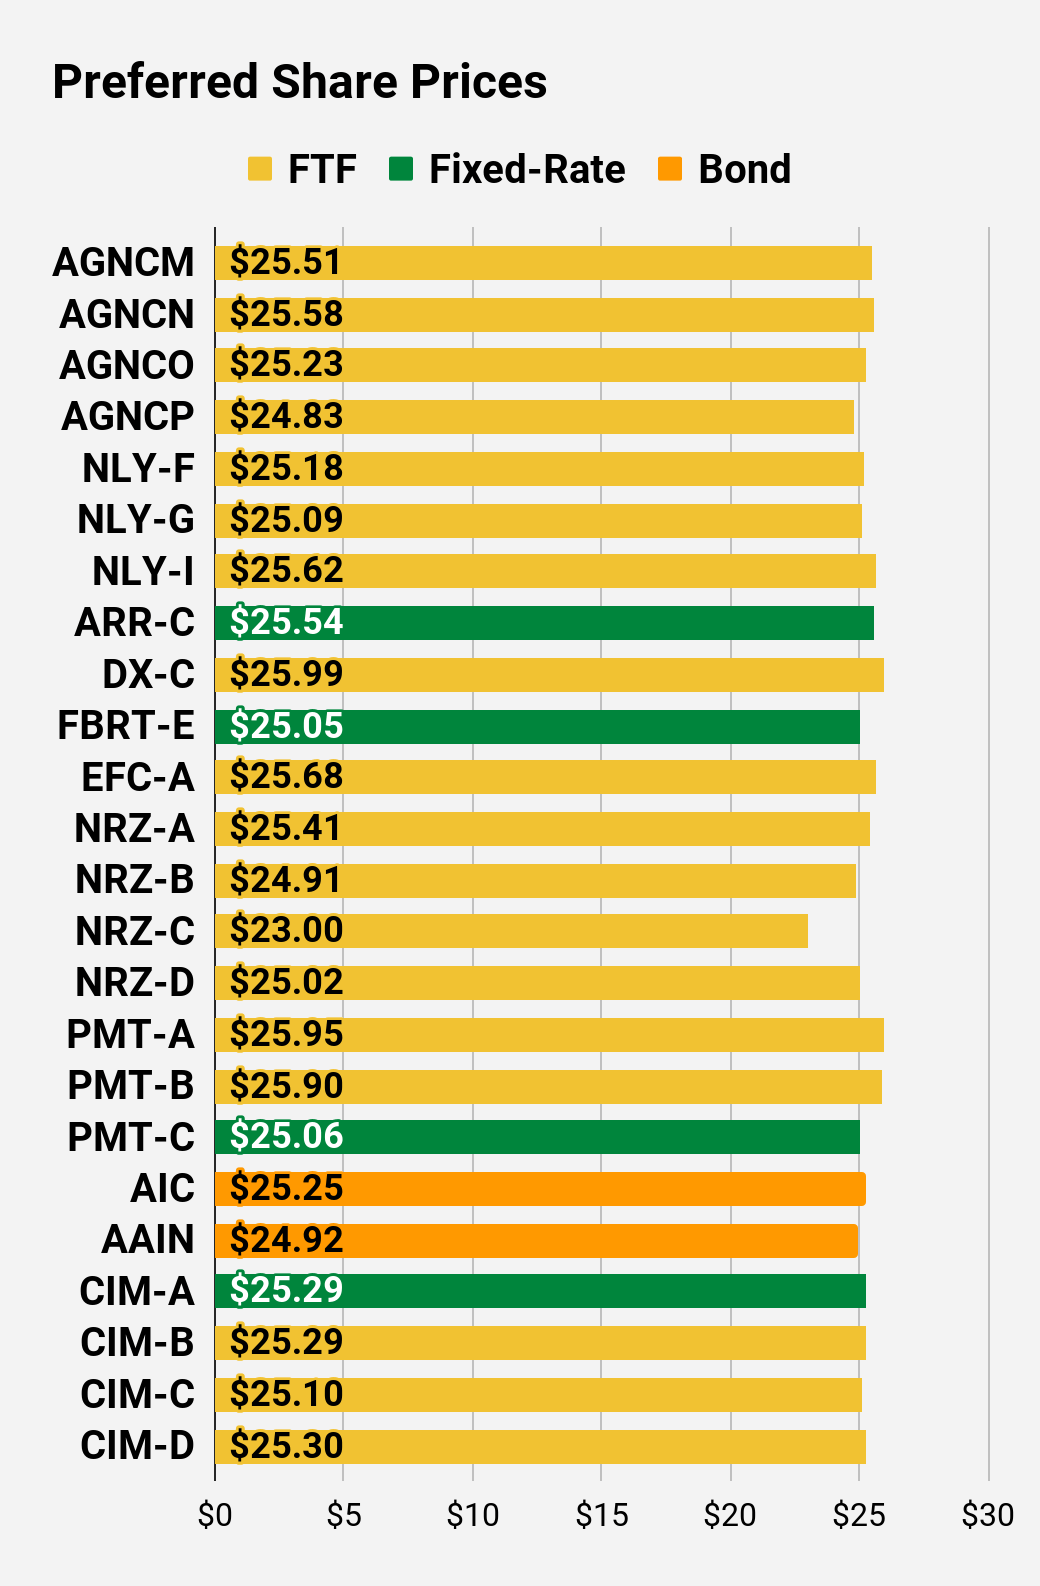 The REIT Forum |
 The REIT Forum |
 The REIT Forum |
 The REIT Forum |
 The REIT Forum |
 The REIT Forum |
Preferred Share Data
Beyond the charts, we’re also providing our readers with access to several other metrics for the preferred shares.
After testing out a series on preferred shares, we decided to try merging it into the series on common shares. After all, we’re still talking about positions in mortgage REITs. We don’t have any desire to cover preferred shares without cumulative dividends, so any preferred shares you see in our column will have cumulative dividends. You can verify that by using Quantum Online. We’ve included the links in the table below.
To better organize the table, we needed to abbreviate column names as follows:
- Price = Recent Share Price – Shown in Charts
- BoF = Bond or FTF (Fixed-to-Floating)
- S-Yield = Stripped Yield – Shown in Charts
- Coupon = Initial Fixed-Rate Coupon
- FYoP = Floating Yield on Price – Shown in Charts
- NCD = Next Call Date (the soonest shares could be called)
- Note: For all FTF issues, the floating rate would start on NCD.
- WCC = Worst Cash to Call (lowest net cash return possible from a call)
- QO Link = Link to Quantum Online Page
Second Batch:
Strategy
Our goal is to maximize total returns. We achieve those most effectively by including “trading” strategies. We regularly trade positions in the mortgage REIT common shares and BDCs because:
- Prices are inefficient.
- Long term, share prices generally revolve around book value.
- Short term, price-to-book ratios can deviate materially.
- Book value isn’t the only step in analysis, but it is the cornerstone.
We also allocate to preferred shares and equity REITs. We encourage buy-and-hold investors to consider using more preferred shares and equity REITs.
Performance
We compare our performance against four ETFs that investors might use for exposure to our sectors:
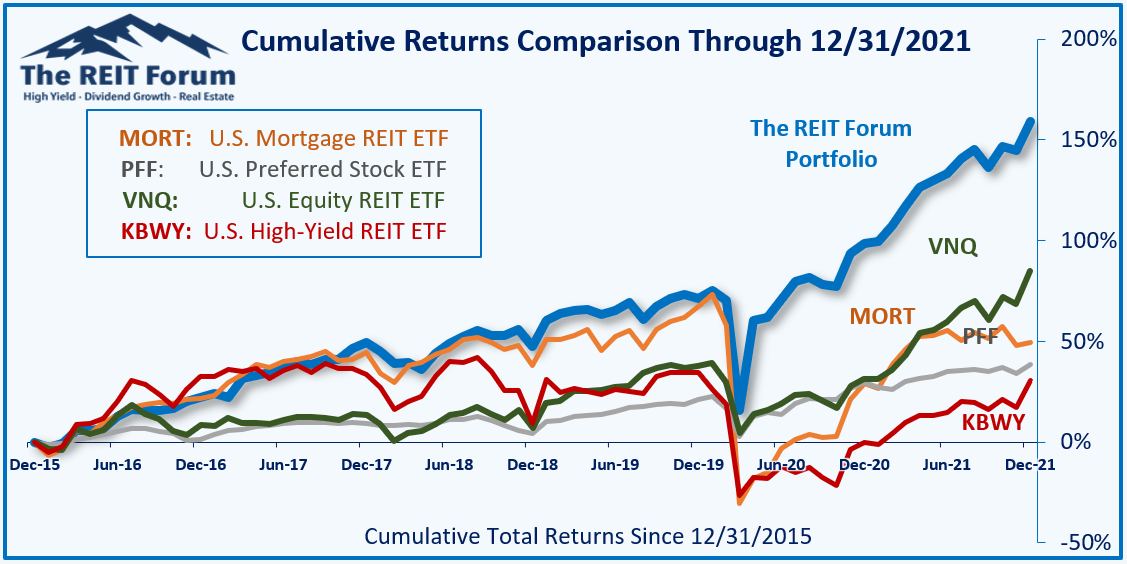
The REIT Forum
Source: The REIT Forum
The 4 ETFs we use for comparison are:
|
Ticker |
Exposure |
|
One of the largest mortgage REIT ETFs |
|
|
One of the largest preferred share ETFs |
|
|
Largest equity REIT ETF |
|
|
The high-yield equity REIT ETF. Yes, it has been dreadful. |
When investors think it isn’t possible to earn solid returns in preferred shares or mortgage REITs, we politely disagree. The sector has plenty of opportunities, but investors still need to be wary of the risks. We can’t simply reach for yield and hope for the best. When it comes to common shares, we need to be even more vigilant to protect our principal by regularly watching prices and updating estimates for book value and price targets.
Ratings:
- Rather than assigning a rating to either today, I’ll simply predict that PMT will outperform CHMI over the next several months.
Be the first to comment