

Chunumunu
Quick Introduction To Business Development Companies (“BDCs”)
Business development companies (“BDCs”) invest shareholder capital in privately owned, small- and medium-sized U.S. companies. BDCs aim to generate income and capital gains when the companies they invest in are sold, much like venture capital or private equity funds. Anyone can invest in BDCs, as they are public companies traded on major stock exchanges.
BDC Buzz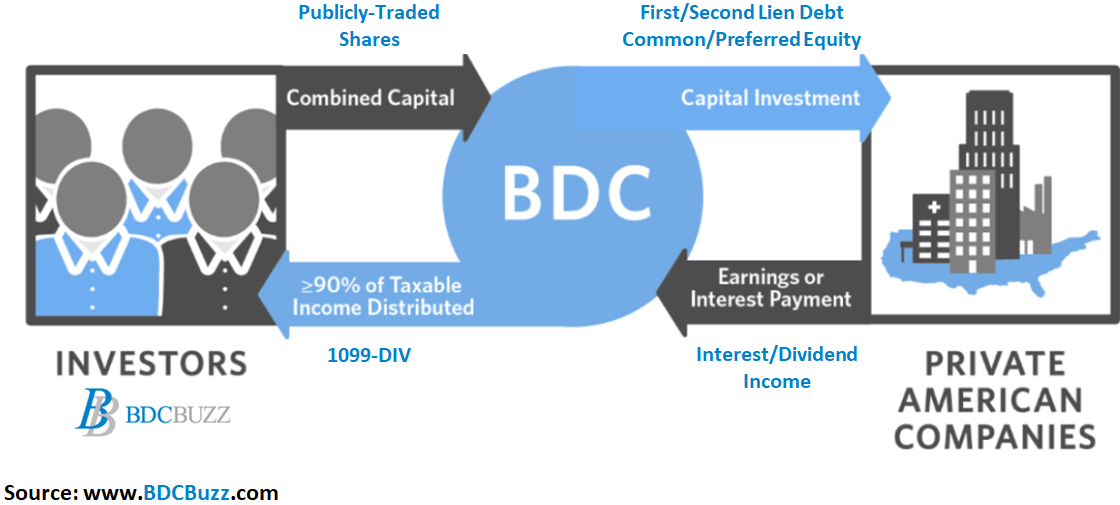
Investment Grade BDC Bonds/Notes
Many BDCs have investment grade (“IG”) bonds/notes for lower-risk investors that do not mind lower yields/returns. Thanks to the recent declines in fixed income, the traditional bond market is now offering some excellent values, especially in the BDC sector, and I will discuss over the coming weeks. However, many of these bonds are now rebounding and I have started making purchases of mid duration maturities, which for me is between 3 and 6 years.
This article discusses Prospect Capital (NASDAQ:PSEC) and many of its bonds, including its 2028 bond, which is currently priced at $79.67, implying a value of $796.70 for each bond. For more information on examples of how to trade bonds using CUSIPs and limit orders, please see the article linked below. Most BDC bonds (including PSEC) have credit ratings from Moody’s and/or S&P and so far, no BDC has ever defaulted for the reasons discussed in:
As shown below, BDCs are highly regulated with plenty of protections for investors in the common stock and debt obligations, such as the amount of leverage (asset coverage ratios discussed later), asset diversification, and having a portfolio that can “generate sufficient cash flows to pay interest as well as dividends to equity investors junior to debt holders”. The following is from PSEC’s investor presentation:
PSEC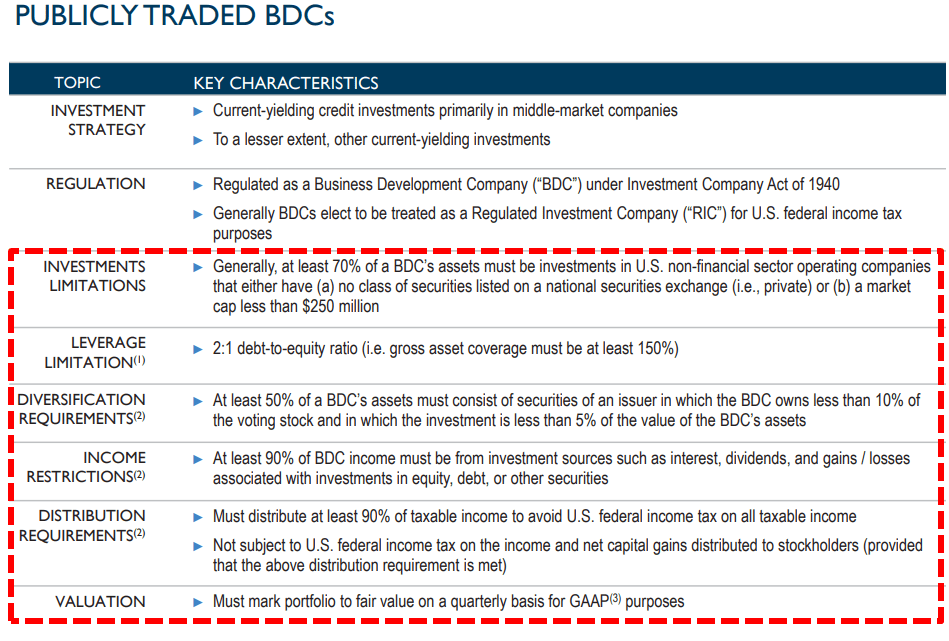
Prospect Capital’s Investment Grade Bonds
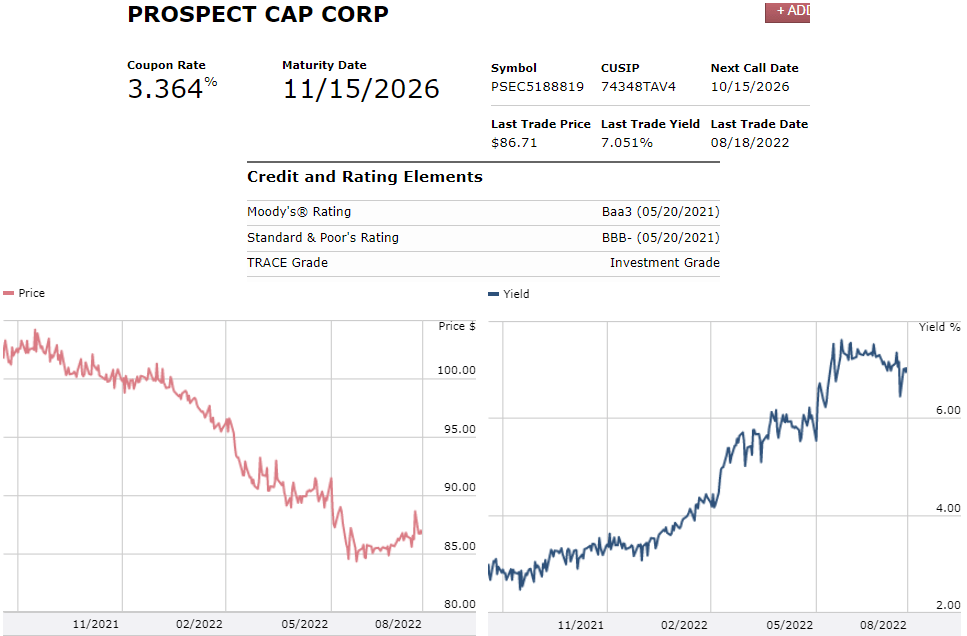
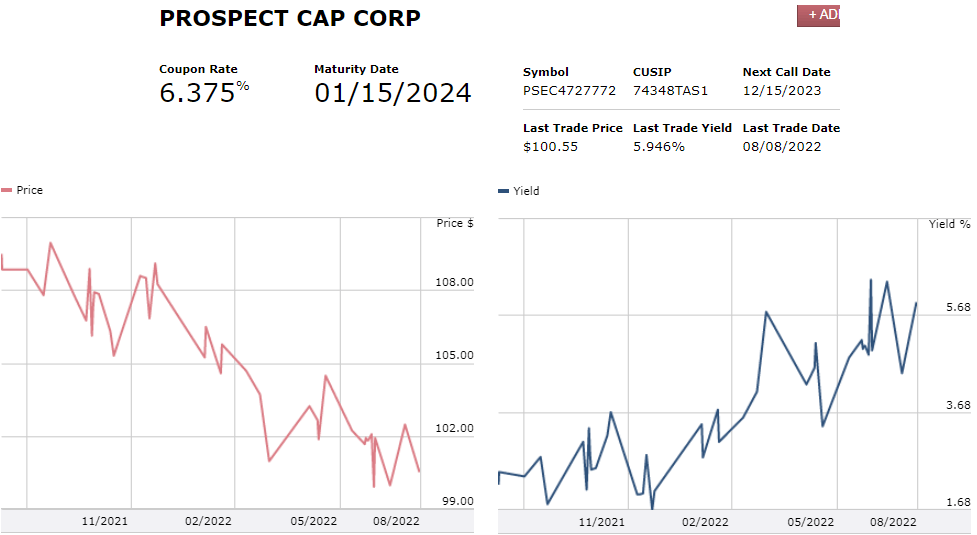
PSEC has many investment grade notes (including CUSIPs: 74348TAJ1, 74348TAS1, 74348TAT9, 74348TAU6, 74348TAV4, and 74348TAW2) with annual yields/returns between 4.1% (7 months) and 7.6% (6 years). These bonds are rated investment grade by S&P, Moody’s, Kroll, DBRS, and Egan Jones:
PSEC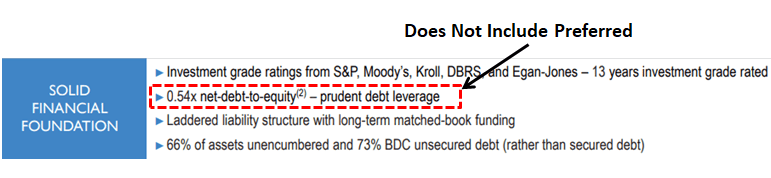
As discussed in the previously linked article, the “Asset Coverage Ratio” is a financial metric that measures how well a company can repay its debts by selling or liquidating its assets. The higher the asset coverage ratio, the more times a company can cover its debt. Therefore, a company with a high asset coverage ratio is considered less risky than a company with a low asset coverage ratio. BDCs are required to maintain minimum asset coverage of 150% providing strong protection to bondholders, which is one of the reasons that no publicly traded BDC has ever filed for bankruptcy nor defaulted on bond holders in the history of the sector.
- PSEC has not reported June 30, 2022, results.
As of March 31, 2022, PSEC’s asset coverage ratio was 230% which is considered higher-than-average as discussed at the end of this article.
BDC Buzz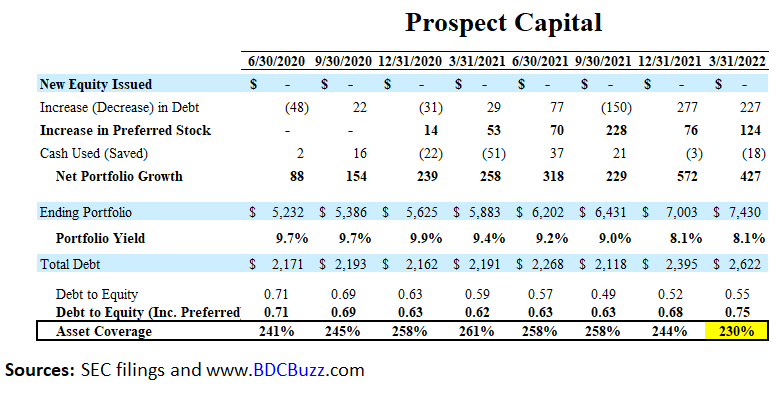
It’s interesting to note that the company typically does not include its convertible preferred when calculating leverage and counts as “equity”:
PSEC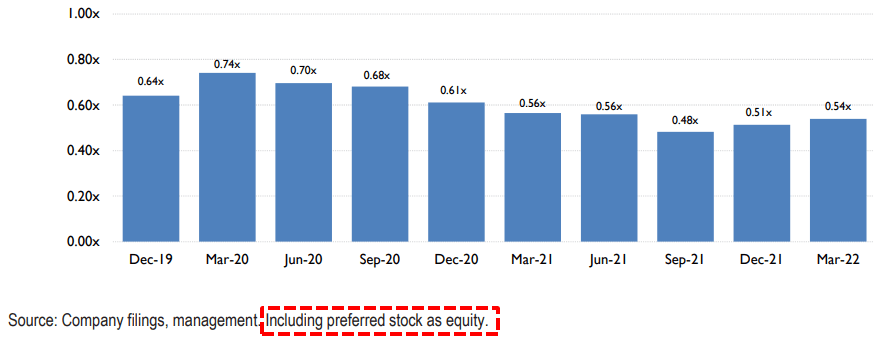
On July 11, 2022, PSEC announced that its preferred stock offerings exceeded $800 million in aggregate liquidation preference issuances. For common shareholders, the perpetual preferred shares create additional risks as the preferred is cumulative and has to be paid in full before common stock shareholders receive their distributions. The preferred stockholders have the option to convert into common at any time (at prices below NAV). Also, PSEC could redeem these shares at “any time” by converting into common stock based on the most recent five-day trading price. This could be another way for management to issue additional shares below NAV.
Also, management is actively issuing these preferred shares and currently does not include the dividends paid on these when calculating adjusted earnings for press releases, as discussed next.
The “Interest Expense Coverage” ratio is used to see how well a company can pay the interest on outstanding debt. Also called the times-interest-earned ratio, this ratio is used by creditors and prospective lenders to assess the risk of lending capital to a firm. A higher coverage ratio is better, although the ideal ratio may vary by industry. When a company’s interest coverage ratio is only 1.5 times or lower, its ability to meet interest expenses may be questionable.
PSEC’s interest expense coverage ratio has historically averaged around 3.0 times, as shown below:
BDC Buzz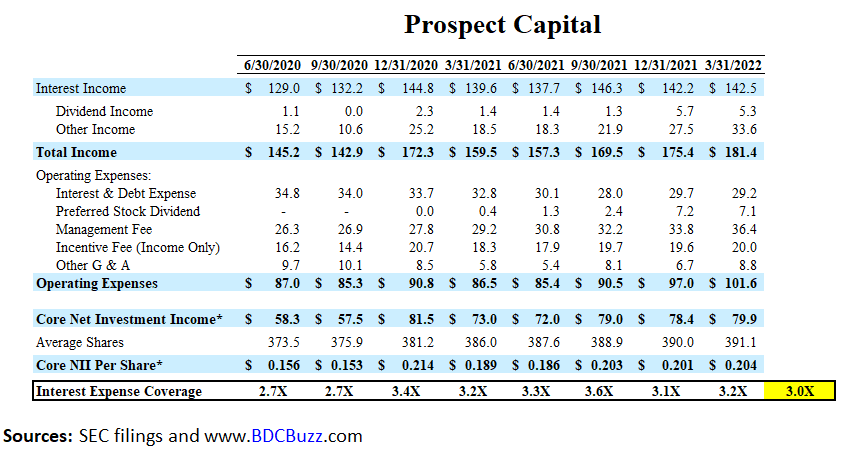
Each quarter, PSEC announces net investment income (“NII”) which does not include the convertible preferred stock dividend. However, this has been accounted for in the ratios provided above.
After taking this into account, the adjusted NII is now around 11% lower. I am pointing this out because this discrepancy will continue to grow larger as the company issues additional preferred stock. This was discussed on a previous call:
Q. “Has there been any internal discussions regarding maybe an adjusted NII figure that takes out the preferred dividend again, given that it’s recurring and impacts common shareholder dividend coverage.”
A. “Sure. It’s a great question. It’s something we have an active dialogue about. It’s fairly simple arithmetic to the preferred interest rate, which is another item shown on the income statement. But it’s something we’ll keep talking about.”
Source: PSEC Investor Call
I will continue to add each BDC to the following table comparing to PSEC to ARCC and MAIN which were discussed in the previous articles:
- Ares Capital: 9% Stock Yield Or 6% For Its IG Bonds
- Fixed 6.5% Return On Main Street’s Investment Grade Bond
- Please see below for discussion of PSEC’s “Portfolio Quality”.
BDC Buzz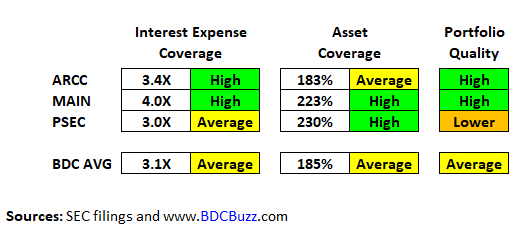
Current Yields For Common Stock and Bonds
PSEC is currently paying a monthly dividend of $0.06 or $0.72 annually, which is a yield of 8.9%.
The following table shows the current annual dividends divided by NAV per share as a simple proxy for current returns on equity (“ROE”) to shareholders. BDCs with higher risk should be able to deliver higher returns through increased portfolio yields. Conversely, lower-risk BDCs have lower portfolio yields due to safer assets/investments, which is why many of the safer BDCs have lower return ratios. However, many of the other BDCs with lower return ratios are due to higher operating costs (including PSEC) and/or credit issues driving lower prices paid by investors.
It should also be noted that I think PSEC management uses aggressive valuations for some of its equity investments, as discussed later, and is partially responsible for having a lower payout ratio relative to its inflated NAV per share.
BDC Buzz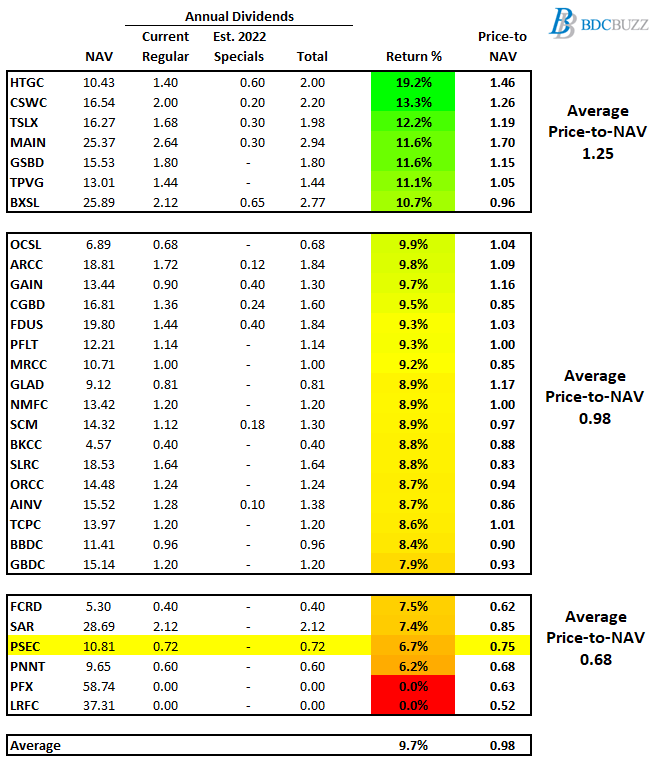
PSEC’s 2028 bond was trading around 77 on July 20, 2022, and is now almost 80 but still yielding over 7.6% (as of August 18, 2022). It is important to note that is a 4% gain (from 77 to 80) and you are still getting a yield-to-maturity of over 7.6% for new purchases:
FINRA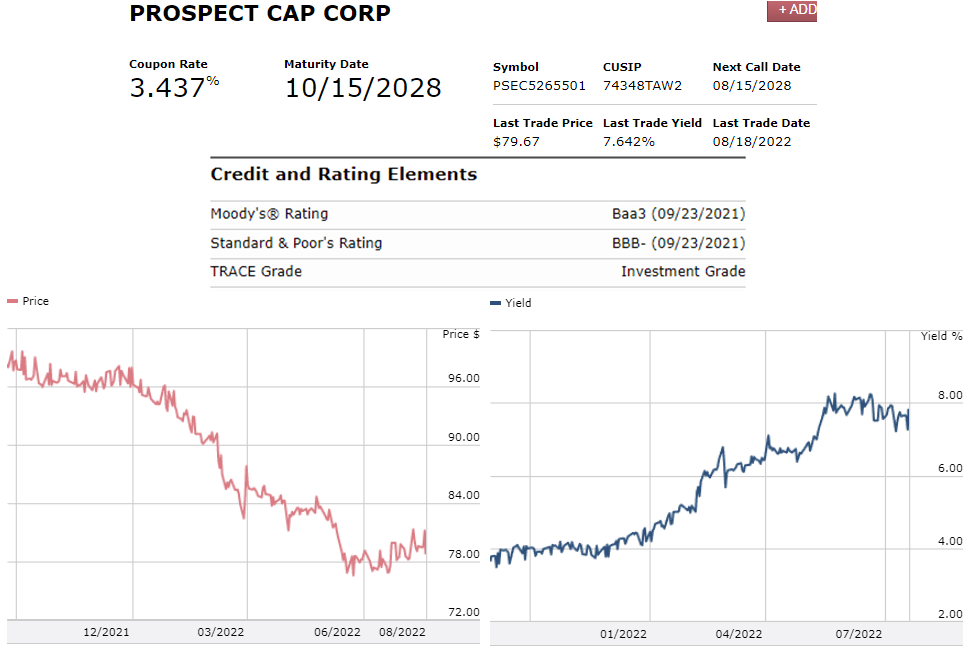
FINRA
FINRA
The following chart is from the BDC Google Sheets showing PSEC’s bonds and I will continue to cover many other BDCs listed below, including their asset and interest expense coverage ratios.
It is interesting to note that many of PSEC’s bonds are currently at relatively higher yields for similar maturities and likely related to having a lower quality portfolio as discussed next.
BDC Google Sheets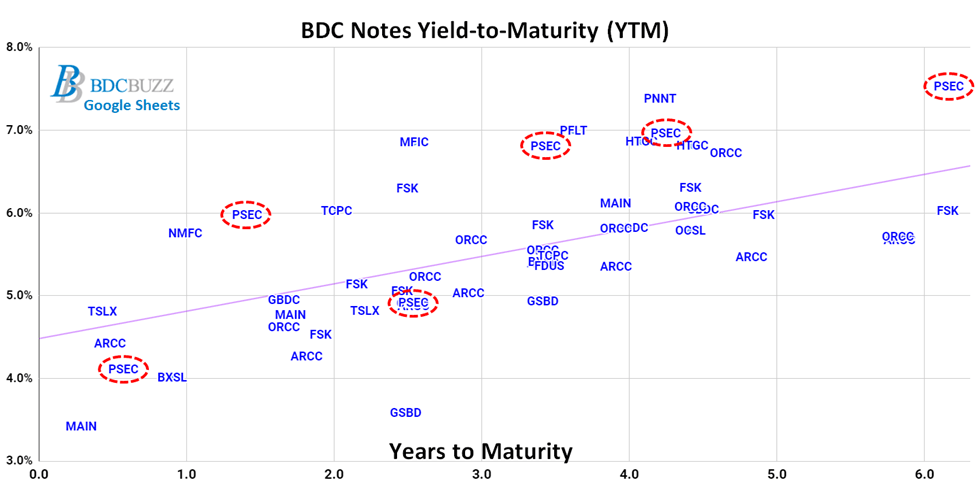
PSEC Portfolio Credit Quality
I consider PSEC to have a higher risk portfolio mostly related to its aggressive valuation policies driving continued unrealized appreciation related to the same control/affiliate investments as previous quarters (National Property REIT during the previously reported quarter – March 31, 2022).
However, there was a meaningful decline for InterDent, Echelon Transportation, and PGX Holdings, as shown below:
SEC Filing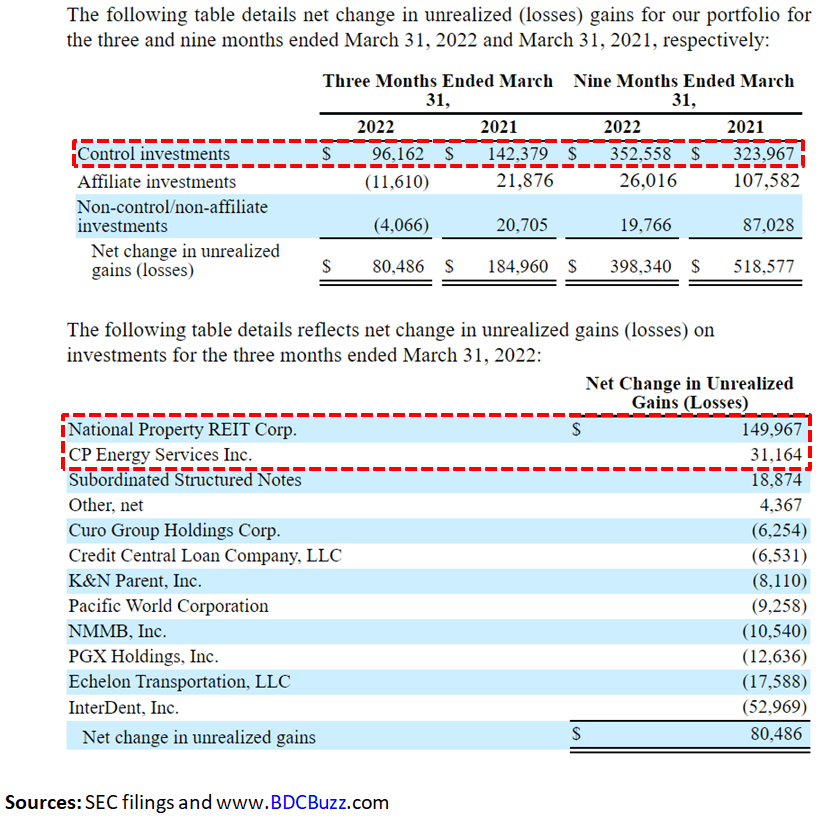
National Property REIT, PGX Holdings, InterDent, Valley Electric, and First Tower Finance now account for almost $3.1 billion, 42% of the total portfolio, and almost 73% of NAV per share, as shown below. This is a very high concentration risk, especially if management is using aggressive valuation measures.
The following table shows the total amount of unrealized gains from these five investments is almost $1.4 billion, which has added $3.49 to its NAV per share. If these investments were marked back down to previous levels, the current NAV per share would decline from $10.81 to $7.32 and have a meaningful impact on the previously discussed asset coverage ratio.
During an economic recession, this is a very real possibility for some of these investments and investors should be prepared for a certain amount of markdowns. This is the primary reason that PSEC management does not use higher leverage, which is directly impacted by any changes to these investments. During a recession, there’s a chance that PSEC would be forced to liquidate assets if the company was overleveraged and these investments were marked closer to cost. Valuing equity investments in smaller private companies during a recession and forced liquidation is a nightmare scenario, which is why you do NOT value BDCs based on NAV multiples (a common mistake for first-time BDC investors).
BDC Buzz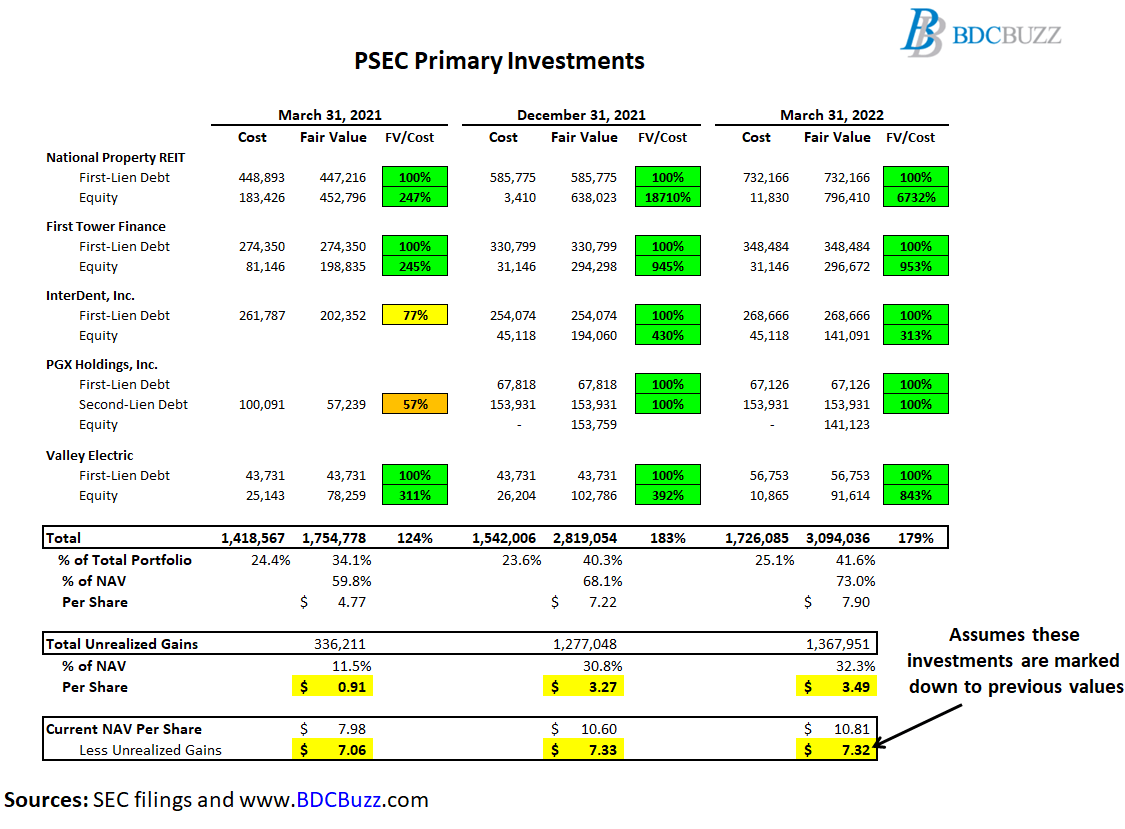
As of March 31, 2022, 23.2% of PSEC’s portfolio was equity positions in a small group of investments mentioned earlier, and 9.8% invested in the equity class of the collateralized loan obligation (“CLO”), which are considered non-qualified investments due to the amount of off-balance sheet leverage (typically 10 times) used to achieve returns. Together these account for 33% of the portfolio and banks will not allow these assets to be used as collateral for credit lines, which is why PSEC needs to use subordinated notes and preferred stock for most of its borrowings. This is why PSEC has among the highest borrowing rates in the sector, reducing the amount of earnings to pay dividends, resulting in a lower dividend payout relative to its NAV per share, as shown earlier.
PSEC BDC Buzz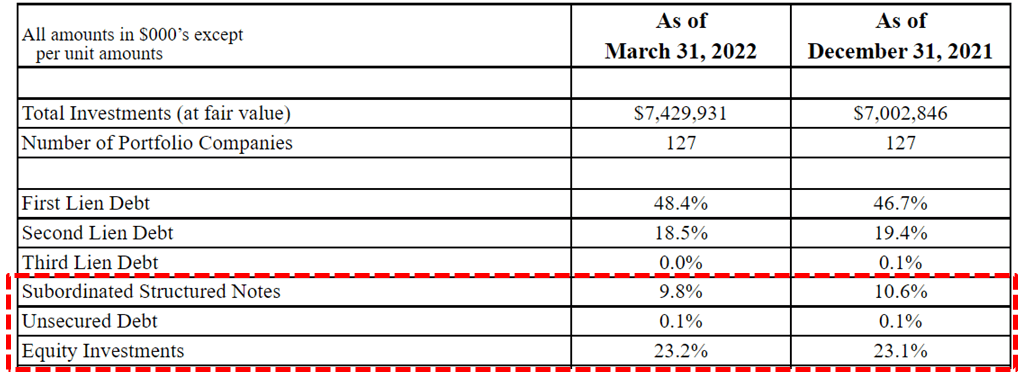
Conclusion – Risk-Adjusted Returns
Given the uncertainty of upcoming returns from equity/stock positions, I would suggest that investors take this opportunity to lock in 6.0% to 7.6% returns provided by investment grade notes especially compared to the PSEC common stock at 8.9% with considerably more risk. If you like PSEC, I would just invest an extra 50% in the 2024 bond at 6.0% for the exact same return.
BDC Buzz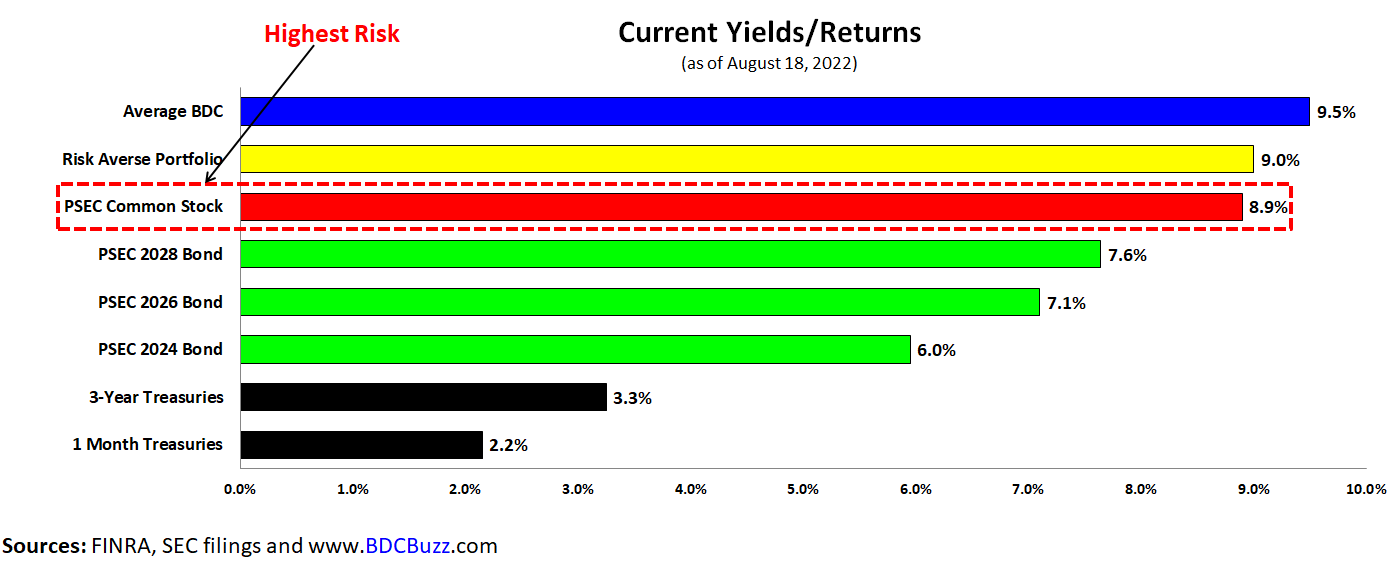
The key risk to the bondholder is a default by PSEC. Please consider the following:
- Asset coverage of debt is 230% which is considered High
- Management uses aggressive valuations for some of its assets
- The perpetual preferreds create additional risks as the preferred is cumulative and has to be paid in full before common stock shareholders receive their distributions
- The preferred shares could be converted into common (at any time) at prices below NAV
- Interest expense coverage has averaged around 3.0 times, which is much higher than most companies but considered average for the BDC sector
- PSEC’s bonds are rated investment grade by S&P, Moody’s, Kroll, DBRS, and Egan Jones
- No publicly traded BDC has ever filed for bankruptcy and impaired debt holders in the history of the sector
Most BDCs with higher asset coverage ratios typically have higher interest expense coverage ratios simply due to having less debt/borrowings. However, this is not the case for PSEC for a few reasons, including having operating costs due to its management and incentive fees that are the highest in the sector as well as higher cost of borrowings for the reasons discussed earlier. Both of these issues drive a much lower amount of dividends as a % of NAV currently at 6.7% compared to the average BDC closer to 9.7% as shown in the table earlier. This is the reason why PSEC typically trades 25% to 35% below NAV.
BDC Buzz
Be the first to comment