

olaser
As a millennial saving for retirement, my goal is to outperform the market by building a portfolio that loses less in crashes, gains nearly as much during bull markets, and produces an income stream with a significantly higher yield and faster growth rate than the S&P 500.
In order to succeed, I want to make sure I only own companies with excellent management whose balance sheets and income statements reflect my beliefs about their future prospects. I plan to hold and add to each position for ten years or more, so knowing my companies’ financial histories helps me resist the urge to sell during rocky times and, most importantly, sleep well at night!
In this series of articles I’m going to examine companies with consistent fiscal discipline, strong competitive advantages, and quality management for possible inclusion in my Best Balance Sheets Portfolio. I want to focus on the strongest stocks in each sector that I believe can comfortably grow their revenue and EPS for the next 10-20 years. I’ll also discuss my portfolio composition and investing strategy along the way.
In this article, I’d like to highlight T. Rowe Price Group Inc.’s (NASDAQ:TROW) financial strength and competitive advantages, take stock of its current challenges, and finally look at best- and worst-case scenarios for the company going forward to arrive at a rating.
TROW: Batting Above Its Weight
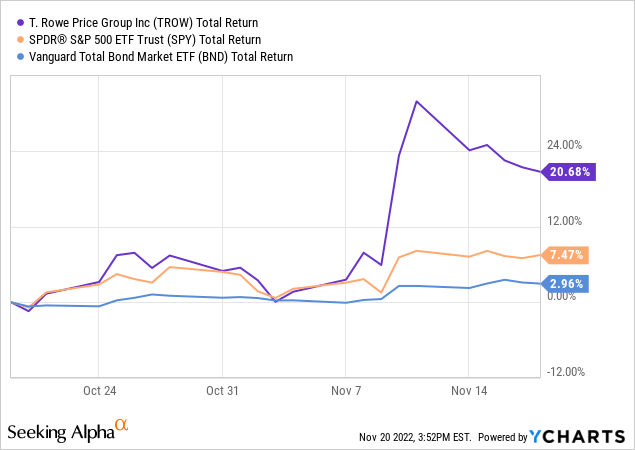
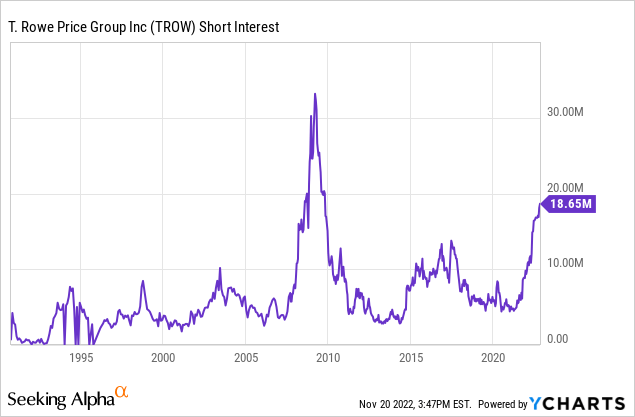
Dating back to 1937, T. Rowe Price Group Inc. is one of the oldest and most respected US-based asset managers. After a terrible Q3 earnings report and subsequent price spike above $134 that may have been boosted by short sellers covering their positions, Fed officials have tempered investors’ interest rate optimism and the stock has come down a bit to levels around $120 that might offer an attractive entry point.
Despite its relatively smaller size compared to heavyweights like BlackRock (BLK) and The Vanguard Group – TROW was ranked 18th in the world in assets under management (AUM) at the beginning of 2022 — the firm is consistently ranked among the top five in overall quality and brand awareness by fund ranking leaders Peregrine and Morningstar. Its marketing efforts are frequently cited as best-in-class, which is no surprise given that until recently the company has continued to grow its AUM and client base while competing against a deluge of lower-cost ETFs from larger firms and free stock trading platforms that often do not offer mutual funds.
With two-thirds of its AUM in retirement accounts and a strong reputation for actively managed mutual funds, T. Rowe Price also typically enjoys high client retention rates as those accounts tend to have higher switching costs, especially for employer plans with limited fund options. Studies have also shown that households with multiple retirement accounts are less likely to switch than other investors, as are older clients compared to younger ones in general.
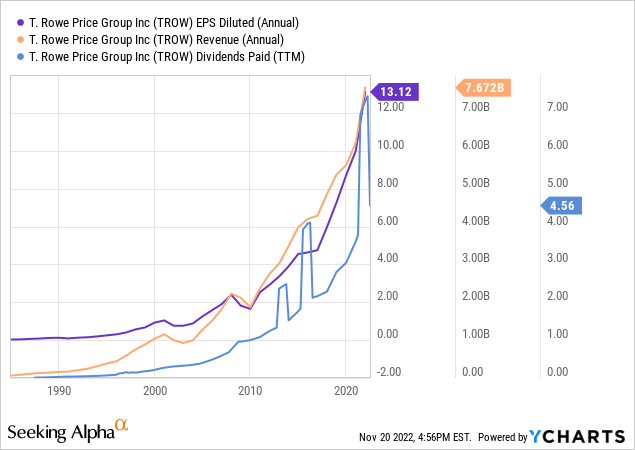
For my Best Balance Sheets Portfolio, I only want to own companies that have proven themselves across long periods of time and have shown an ability to grow through the most difficult market conditions. TROW’s decades-long history of consistent EPS, revenue, and dividend growth (with special dividends included in the chart) meet this criteria in spades:
Disciplined Management & Shareholder Value
Before getting into the weeds with TROW’s struggles, let’s look at a few positives. Bucking the outflow trend, their target date retirement funds continue to show quarterly inflows, growing from $0.5B in Q2 to $3.5B in Q3, and now comprise $312B of the firm’s AUM. This may be a sign that their current “Invest In Your Future” marketing campaign is paying off. And even though AUM and revenue has decreased significantly this year, the firm has wisely increased its cash position to $2.37B from $1.52B at the beginning of the year.
In a sign that management recognizes the possibility of continued outflows, CEO Rob Sharps has committed to implementing cost-cutting measures going forward to shore up the company’s balance sheet. So far cuts have been relatively small at 2% of the workforce, equating to about 150 associates, as well as reductions in third-party spend and future hiring plans. Net margins are strong at around 30%, and TROW’s 3-year annualized revenue, income, and EPS growth are still higher than most peers.
TROW Valuation Metrics (Morningstar)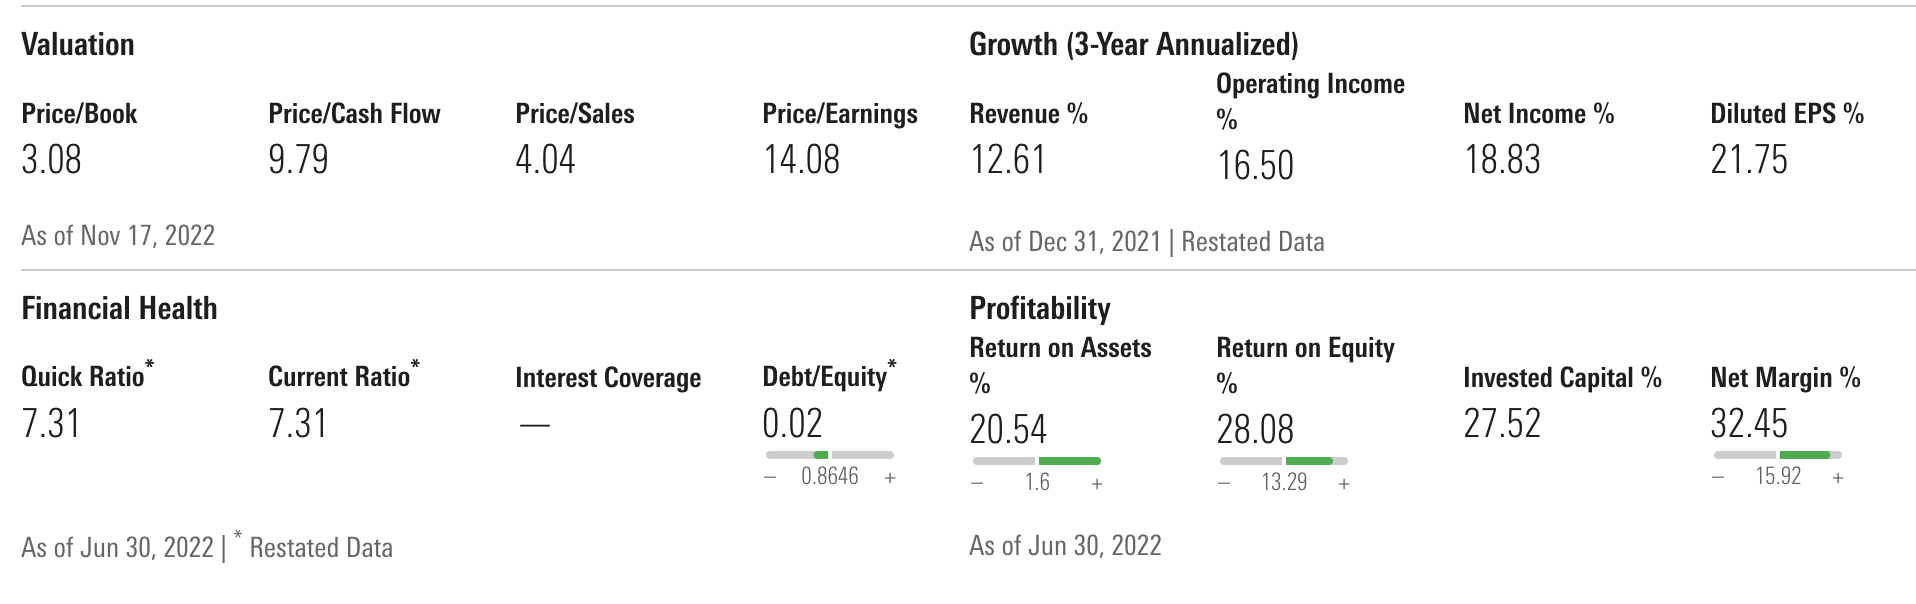
A testament to its disciplined and shareholder-friendly approach, over the past ten years TROW’s share count has decreased by 10% as its buybacks have remained in line with larger rival BlackRock, its price to book value has decreased by nearly 30% while BlackRock’s has more than doubled, and the firm has maintained no long-term debt.
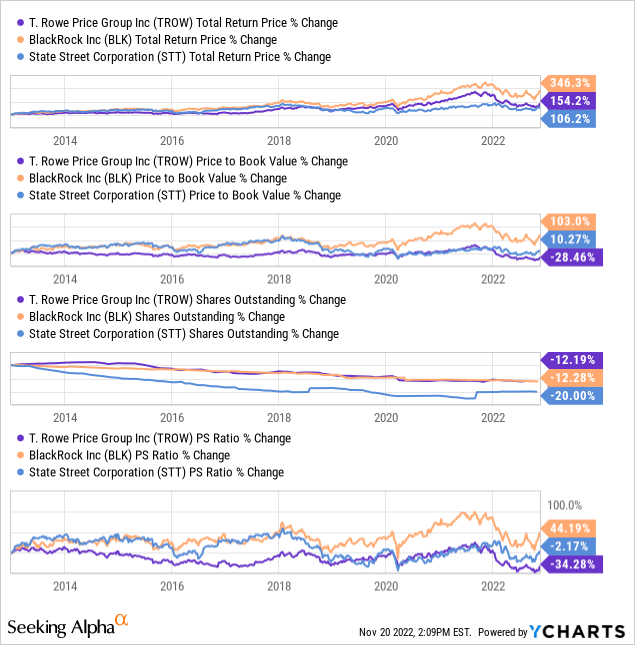
While BLK obviously wins in the total return category, we can see that much of its outperformance is due to expanding valuation multiples over time. Of course it’s fair to argue that BlackRock deserves a premium here based on its better long-term outlook, but I think the numbers show that TROW has done a great job of increasing intrinsic value for shareholders even as its valuation stagnated or fell, and thus the current drawdown may offer a chance to buy at a significant discount to historical valuation levels should market conditions improve.
We can also see that TROW outpaced similarly sized peer State Street Corporation (STT) in total returns in spite of STT’s aggressive share repurchases and similar dividend yield largely thanks to TROW’s superior dividend growth. A Dividend Aristocrat with a 35-year growth streak and a consistent record of high-double-digit increases, 2022 saw a lower-than-usual 11% dividend raise from TROW, but in light of a difficult macro environment, falling AUM, and their high current yield of 3.93%, it was certainly a respectable hike and better than many expected. For now the dividend remains well-covered at around a 50% payout ratio, but the dividend growth outlook becomes more uncertain should the market turn downwards again.
TROW Dividends (Seeking Alpha)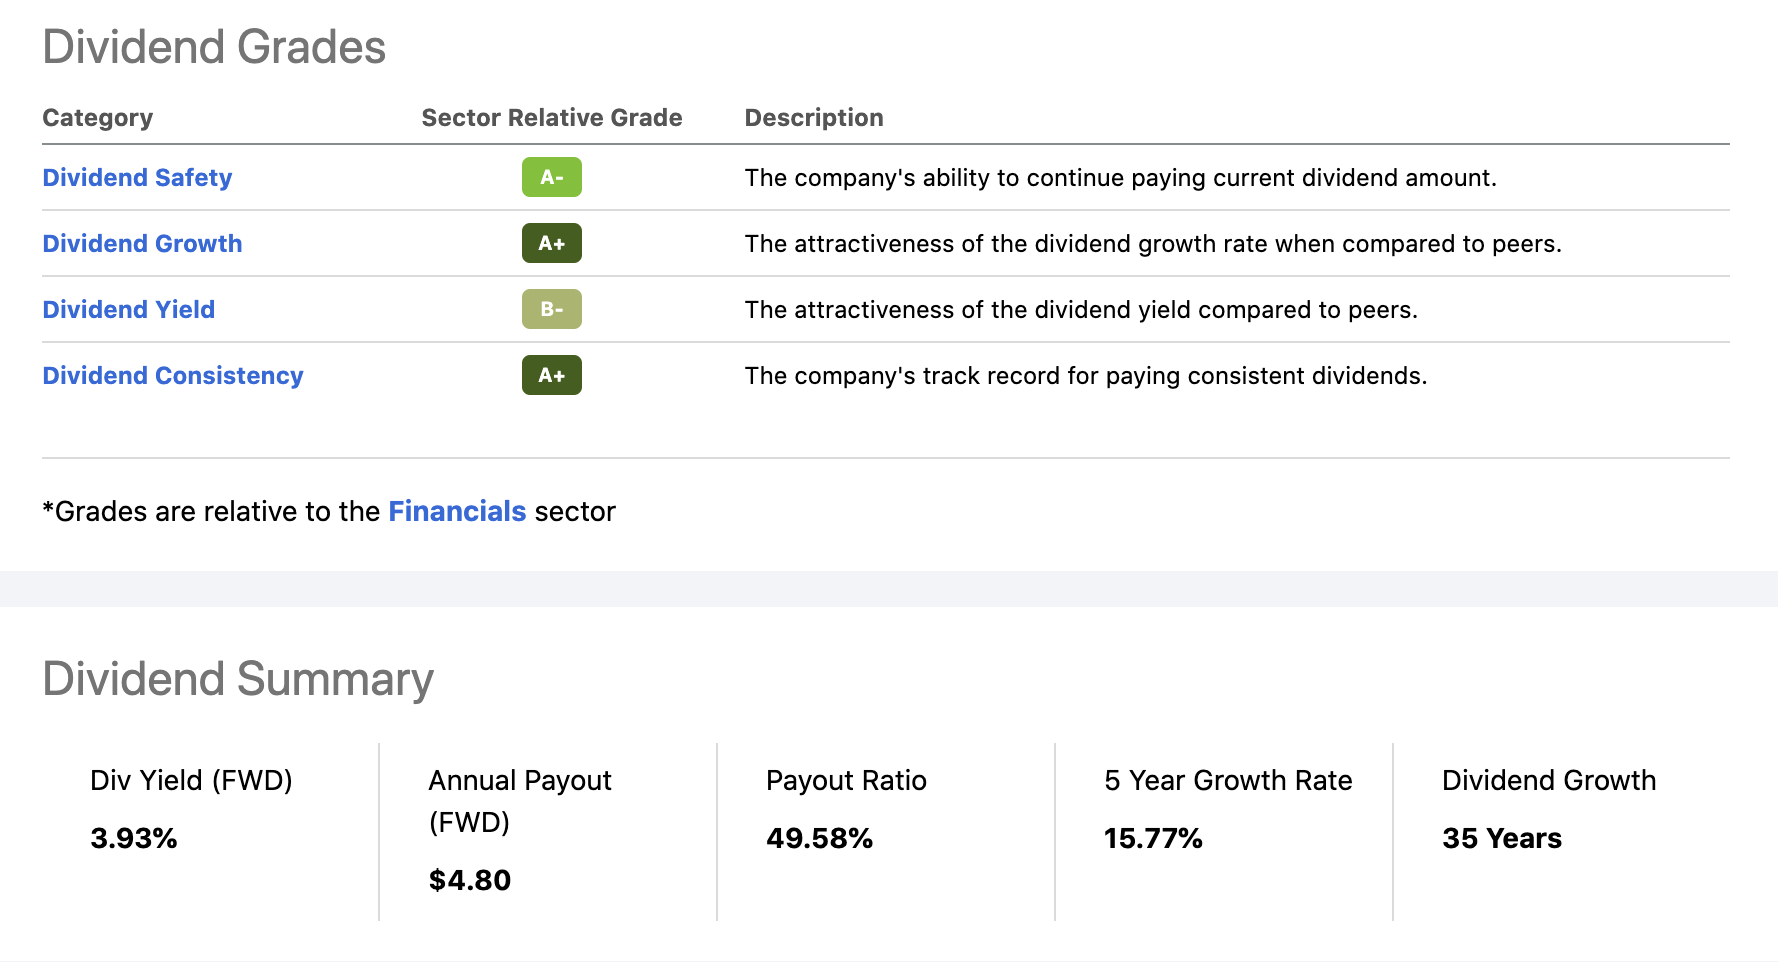
Cracks In The Armor Emerge
With that said, as goes the market so goes AUM, and TROW’s dismal Q3 earnings report bore that out with a decline of nearly 24% YoY in AUM, advisory fees down 20.5%, revenue down 18.5%, EPS down 43%, and an uncharacteristically large $24.6B in client outflows – roughly $10B more outflows that in the previous quarter alone. With business declining on multiple fronts and a possible recession looming, some of TROW’s historical advantages are now being called into question.
TROW Q3 Earnings Summary (T. Rowe Price)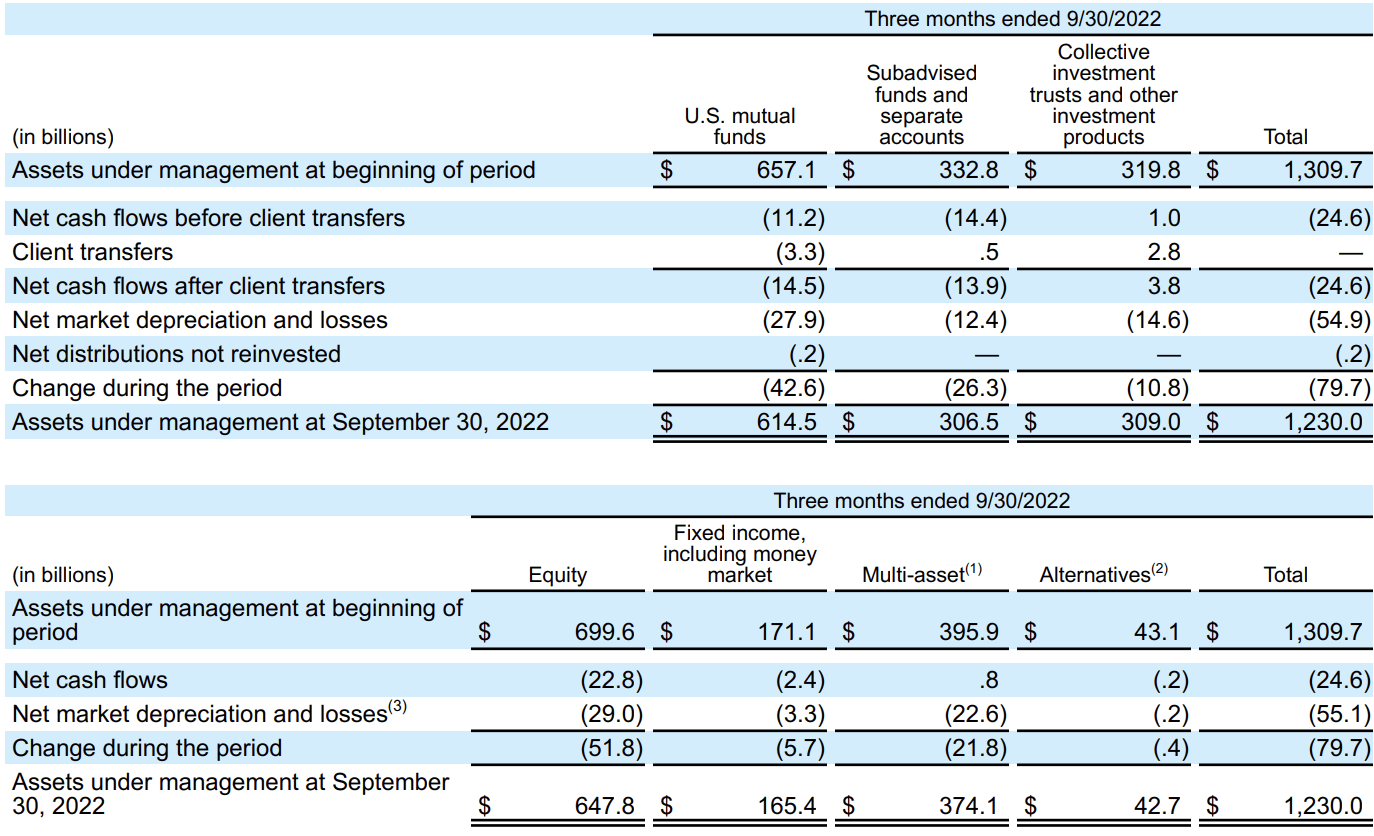
Reputational Risk
The most concerning aspect of all of this to me – mainly because TROW’s brand is so heavily defined by responsible stewardship and quality active management – is the recent underperformance of some of its flagship actively managed mutual funds. Two funds in particular illustrate this point: the T. Rowe Price Global Technology Fund (PRGTX) and Communications and Technology Fund (PRMTX).
TROW’s flagship technology fund PRGTX, once one of Morningstar’s top-rated 5-star mutual funds in its category, has performed terribly over the past year to the point of destroying both its long-term history of outperformance and its stellar reputation. Performance-wise, PRGTX has gone from being in the top 1% of all tech mutual funds to being in the bottom 6% YTD and has been demoted from a 5-star Morningstar rating to a 2-star rating. The YTD underperformance is particularly disturbing as the fund has nearly doubled the NASDAQ’s (QQQ) losses.
PRGTX Trailing Returns (Morningstar)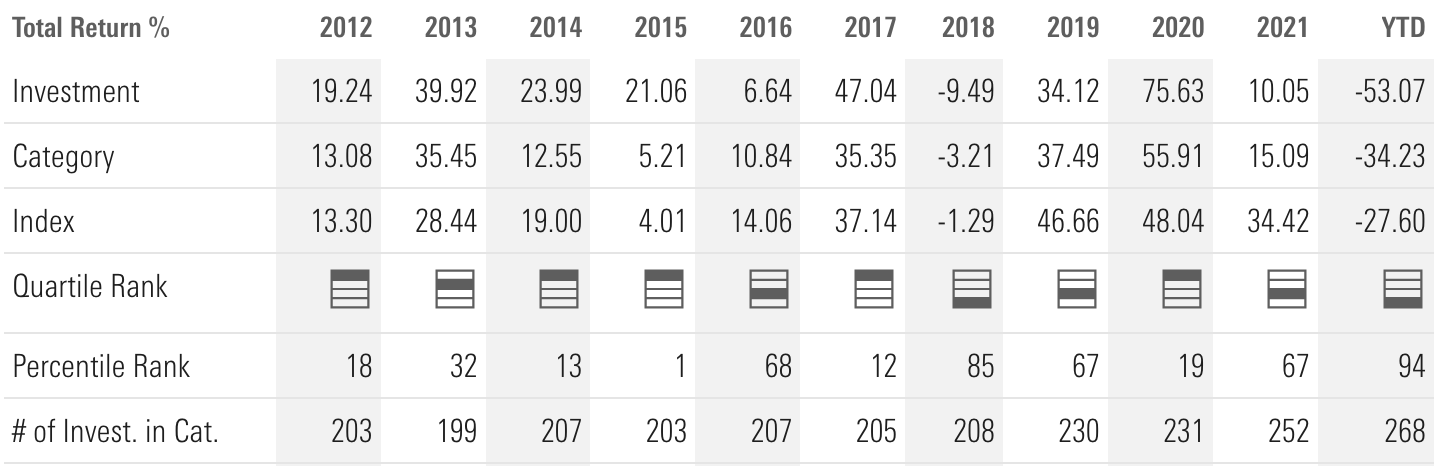
Likewise, PRMTX has gone from the top 1% in its category to the bottom 5% in one-year performance. It has maintained its 5-star rating but will very likely be demoted in the future because Morningstar’s star system is a purely quantitative, backward-looking measure of fund performance over time. We can see that while PRMTX’s 10- and 15-year returns are ranked in the 1st percentile of its category, its recent results get progressively and significantly worse. This will inevitably lead to far lower long-term trailing return calculations going forward.
PRMTX Trailing Returns (Morningstar)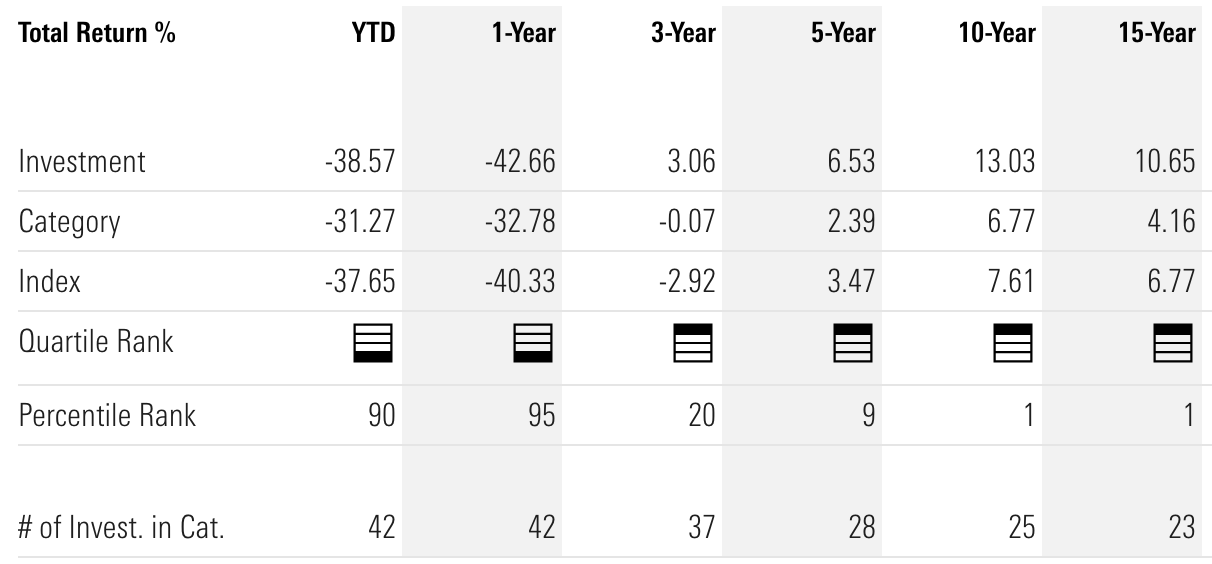
As a former mutual fund investor, I know from experience how much weight those Morningstar fund and stewardship ratings carry, both with individual and institutional investors. Similar to the recent extreme underperformance of the ARK funds that has (to many of us, at least) demystified and brought Cathie Wood’s reputation back down to earth, I consider these severe declines in relative performance a risk to TROW’s ability to attract new clients – especially younger people, employees, and employers choosing between growth funds – when its flagship actively managed funds have been downgraded to the bottom quartile of their respective categories and no longer can tout alpha from their managers.
Mutual Fund Performance Averages (T. Rowe Price)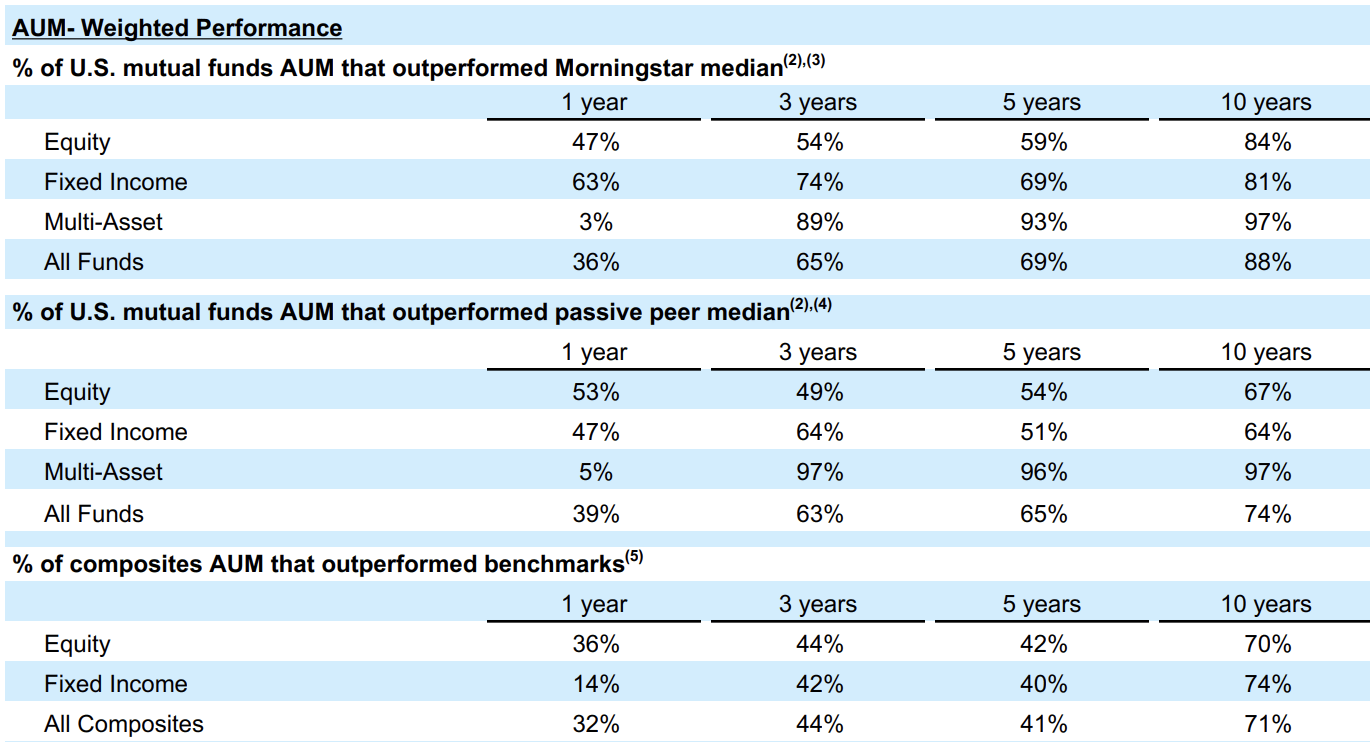
Whereas over a trailing 10-year period, 88% of all TROW mutual funds have outperformed the median mutual fund in their category and 74% have outperformed their respective passive peer index funds, the numbers get far worse as we get closer to the present. This past year saw less than 40% of TROW’s mutual funds outperform their actively managed peer funds, passive index funds, and combined benchmarks such as retirement date models that combine equity and fixed income holdings. Over a 3-year period most of the averages are still above 50%, but in the past year relative returns have plummeted.
Even more disappointing is the AUM-weighted performance table above, which shows that TROW’s most popular funds are underperforming their peers and indexes even more on average than the firm’s smaller funds (the unweighted table can be found in their Q3 report). Especially notable is the dismal one-year performance of the “Multi-Asset” category, which includes T. Rowe’s heavily-marketed target date retirement funds, many of which still rank first in their respective Morningstar categories for long-term performance. Despite being one of the only product groups that enjoyed inflows this year, it has been the worst performing segment by far with only 3-5% TROW’s multi-asset mutual funds outperforming their benchmark indexes.
For an older advisory firm whose current major marketing campaign targets younger investors with the long-term, value-based slogan “Invest In Your Future”, these performance metrics worry me as they will almost certainly lead to future ratings downgrades for many of TROW’s multi-asset retirement funds. As investors we usually accept some underperformance from actively managed growth funds during market weakness in exchange for potential outperformance during bull markets, but when seeking retirement-focused funds we ultimately hope for safe and predictable returns.
TROW’s target date funds primarily utilize actively managed funds for most of their asset class exposures, so it’s hard to imagine many investors choosing the risk/reward ratio of a mostly active fund blend that has just underperformed 95% of its passive benchmarks over a fully passive index portfolio.
Client Outflows & Fee Attrition
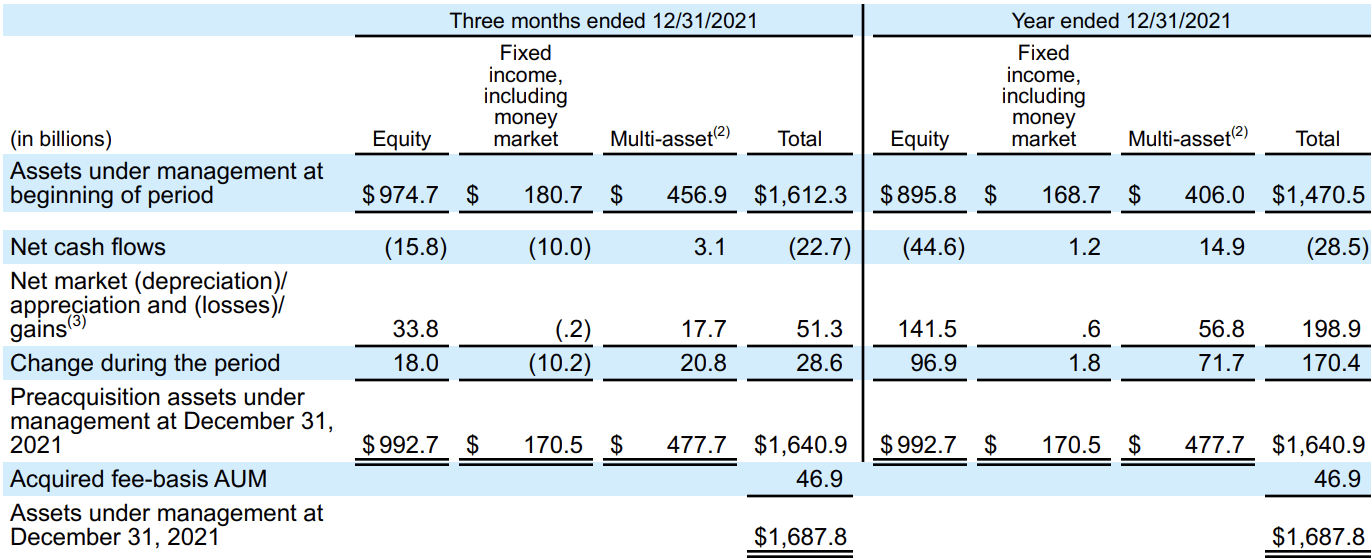
The second most concerning aspect of TROW’s latest report is evidence of increasing client outflows. Management revealed that the majority of Q3’s $24.6B in outflows came from growth equity funds as in previous quarters, but bond funds also experienced outflows for the first time in a few quarters, although at a much more muted level than their striking $10B outflow in Q4 2021, also shown below.
2022 YTD AUM Change (T. Rowe Price) 2021 AUM Change (T. Rowe Price)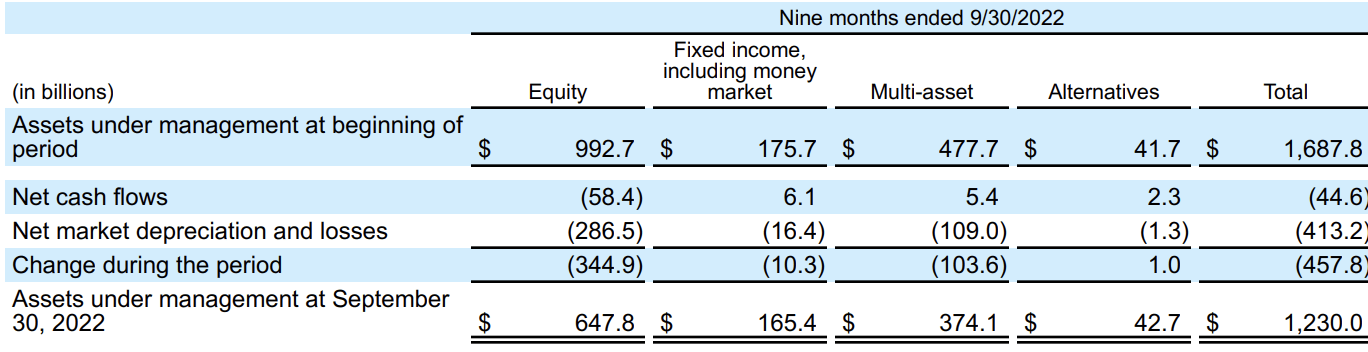
Since the greatest threats to T. Rowe Price’s return to AUM and corporate growth are a further market decline and continued outflows, perhaps the most discomforting part of the CEO’s recent comments came in a September analyst call where Sharps said that it could take years before outflows stop. This does not sound like someone who is very confident in either an economic rebound or their company’s ability to attract new customers, although he dismissed any concerns that the company is facing any existential danger despite a continued race-to-the-bottom in advisory fees, which reached a new low in the quarter.
Q3 2022 Advisory Fees (T. Rowe Price)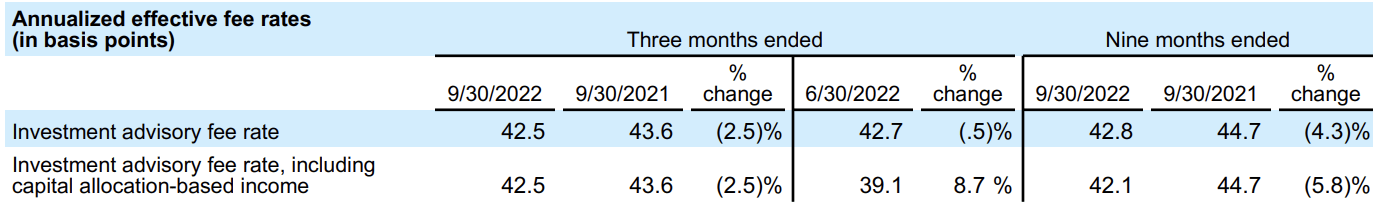
Worse than the Great Recession?
Note that in the Great Recession market crash from 2007-2009, TROW did not actually experience any net outflows despite a large market-related decline in AUM. Peak-to-trough, TROW’s AUM declined 32.8% from $400B at the end of 2007 to $269B at the end of Q1 2009 when the market had finally bottomed.
Even though TROW’s AUM has (and had in 2007) a relatively large 4:1 equity to fixed income ratio, it’s easy to see why the 2021-2022 period has actually been harder for it to navigate from a business standpoint, especially given today’s more difficult competitive landscape and lower advisory fees. The simple answer? Bonds.
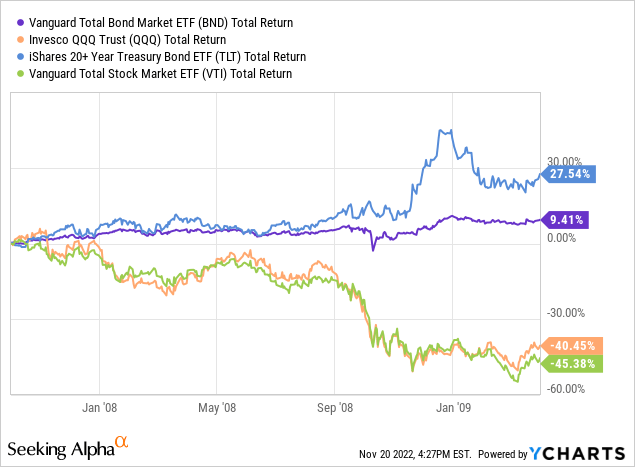
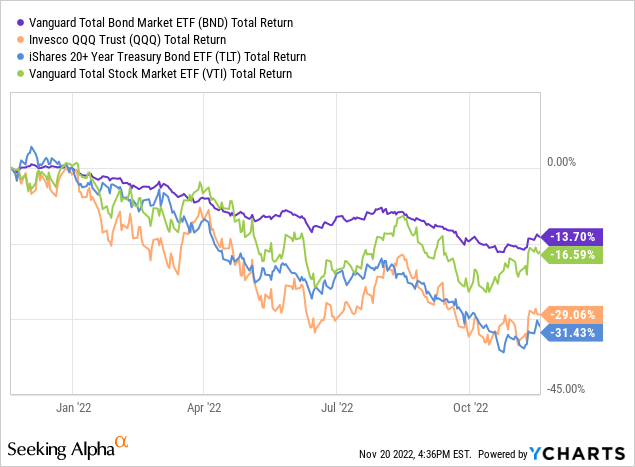
The bond market’s traditional market-hedging power vanished in the face of high inflation and rapid rate hikes, compounding TROW’s poor mixed asset fund performance and overall AUM losses instead of buoying them. Because of this, it turns out that the 2007-2009 period may not be of much use for those looking to extrapolate how TROW and other asset managers might be affected should the market experience another 20% or greater leg down due to additional rate hikes, since in that case bonds and stocks will likely move in tandem.
On the other hand, if stocks decline again due to confirmation of a recession, the Fed will likely pause or even reverse its rate hike campaign, in which event bond prices will rise and they will return to being the equity hedge they once were. In that case, the Great Recession may well become an appropriate model for asset managers’ eventual path to recovery. And in today’s “bad news is good news” market, we also need to be mindful of the possibility that the equity market may actually rally — at least initially — if a recession is indeed confirmed, since euphoria at the prospect of rate cuts may win out over economic fear, much of which has already been priced into economically-sensitive stocks like TROW.
To get a sense of how the current bear market has affected T. Rowe Price’s business relative to both the Great Recession and its own stock price, I’ve compiled the below chart comparing two six-quarter periods: the first marking the beginning and end of the 2007-2009 crash, and the second marking TROW’s current period of sustained outflows that began in Q2 2021. I’ve included stock (VTI) and bond (AGG) market returns along with an 80/20 VTI/AGG portfolio return to serve as a rough benchmark for TROW’s estimated AUM returns based on its ~4:1 stock-to-fixed-income asset mix. Finally, I’ve calculated AUM and inflow/outflow change percentages to see if and how they might correlate to TROW’s stock performance over each period.
TROW Comparison Table (Author)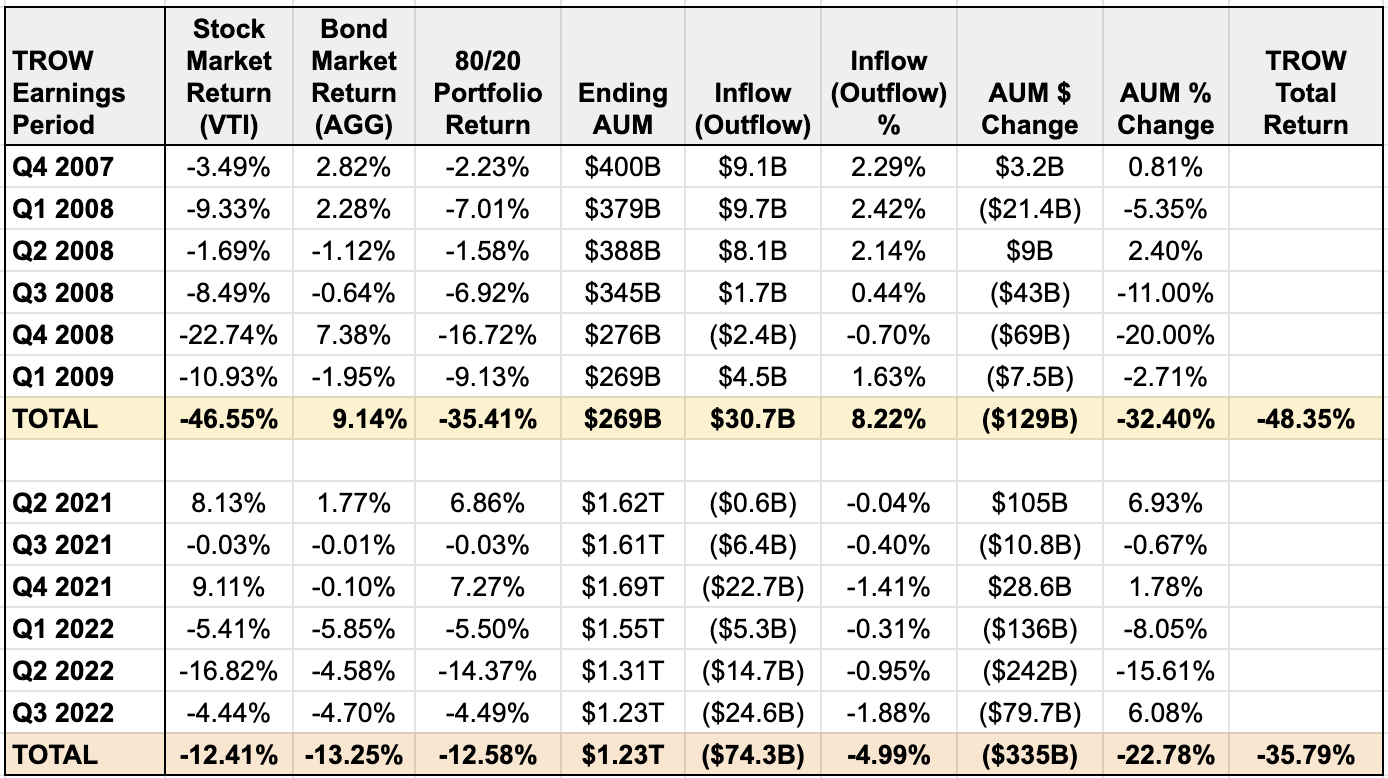
The data confirms a few things for me and confounds a few others. First, while 2021-22 has been far worse than 2007-2009 for TROW’s underlying business in terms of outflows and overall AUM declines, on a percentage basis the numbers don’t look too dire… yet. The company certainly cannot be complacent and must work to attract new customers to stem growing outflows, but, viewing outflows as an “extra penalty” that could (and should) be imposed by the market, the stock’s 36% decline over this period is still greater than TROW’s combined overall losses in AUM and client outflows, even considering the market’s 10% gain over the past month (TROW also reported updated AUM of $1.28T as of Oct. 31st).
Of course this is all fairly speculative, most importantly because this bear market might be far from over, but my basic takeaway is that TROW’s troubles are adequately priced in at this level and that its stock was indeed oversold a month ago post-Q3 earnings when it was trading over 20% lower.
Second, the chart shows how strong TROW’s growth remained during one of the worst bear markets of all time from Q4 2007 through Q1 2009, with only one quarter of a sub-1% outflow versus five quarters of inflows for a cumulative net inflow gain of 8.2%. Its overall AUM decline of 32.4% actually outperformed the 80/20 portfolio benchmark, which is quite impressive but not entirely surprising given the firm’s long-term record of outperformance with its actively managed funds. This figure, however, stands in stark contrast to the -22.78% AUM change in the 2021-22 period, which underperformed the passive 80/20 benchmark by over 10% — 5% more than the outflow decline alone would account for.
This begs the ultimate question that each investor will need to confront for themselves when considering a position in TROW: can the firm’s current iteration return to the resilient growth, excellent stewardship, and actively managed fund outperformance that its outsized reputation was built upon? If the answer is yes, I think its a great time to add shares. And you’re uncertain, it may be wiser to wait until management outlines a clearer plan to return to growth and inflows, whether by expanding and modernizing its clunky ETF lineup, seeking bold acquisition targets, or revamping the management and/or methodologies of its underperforming funds with an eye to providing better risk-adjusted returns going forward and getting out in front of their inevitable trailing-return-based downgrades.
Conclusion
I’m not going to sugarcoat it – T. Rowe Price is in a difficult position right now, and, to be honest, after writing this analysis I am less bullish on their future prospects than when I began. Management seems to be navigating this year’s bond, equity, and interest-rate storms well, but the same can’t be said of TROW’s active fund managers. The firm needs to reverse its significant equity fund outflows and re-calibrate its target date funds (and its multi-asset category in general) to at least bring their performance more in line with their passive index benchmarks.
Still, if it turns out that October 2022 marked the final equity and bond market bottoms for this cycle, both T. Rowe’s AUM and asset management stocks in general will almost certainly rise with the tide and recover even if outflows remain persistent for longer. History teaches us that the market is won by cool heads holding quality companies over long periods of time, and I know that the strength of TROW’s balance sheet, its attractive yield and dividend growth potential, and its time-tested, shareholder-friendly management can and most likely will right the ship when the economy eventually rebounds.
I will examine BlackRock next in this series, as I suspect it may offer more promising long-term growth and returns. However, based on the expectation of an eventual market recovery that lifts all AUM-based boats, an already-severe price drawdown, and an attractive valuation, I still rate TROW a tentative buy at current levels near $120, and a strong buy below $105.
Be the first to comment