

Antonio_Diaz/iStock via Getty Images
An Impressive Rally
The 1-Minute Market Report is tailored for those who want a quick recap of what’s going on, without the usual fluff and filler. I try to focus on the main drivers of the current market action and offer some brief commentary along the way.
A Quick Summary
- The S&P 500 has rallied 6.9% over the past four days.
- The rally is impressive, but we’re still not out of the woods.
- The dip-buyers must now follow through and make a new high.
- We are in a rolling bear market, with 42% of all stocks down 20% or more.
- A stingy Fed, boiling inflation, slowing economic growth, and an escalating war in Europe are formidable headwinds.
- If this rally doesn’t hold, the dip-buyers will have squandered a golden opportunity to regain control from the aggressive rally-sellers.
S&P 1500 Composite Sectors
Chart 1. Drawdowns from 52-week highs
We begin with the widest lens – drawdowns from the most recent 52-week high price – and zoom in closer from there.
The Consumer Discretionary sector is the worst performer in terms of how it has fallen from its 52-week high. This sector includes automobiles and auto components, consumer durables and apparel (household durables, leisure products, textiles, apparel and luxury goods), consumer services (hotels, restaurants, and leisure), and retailing – including malls and online stores.
Why is this sector down so much? Partly because the reopening surge in traffic and spending stretched the valuations, which created more room to fall. And the sector is overly concentrated in internet retail and automobiles. Semiconductor shortages are weighing heavily on auto and consumer electronics producers. Furthermore, runaway inflation and higher interest rates are weighing on consumer demand.
The best (or least bad) performer is Utilities, down only 7.8% from its high-water mark. Utilities are considered a safe haven from volatility, and they are doing a decent job of protecting investors from the worst that this market has dished out.
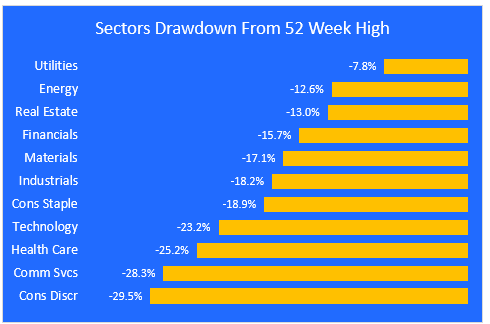
Chart 2. Sectors Year-to-Date % Change
The Energy sector is the clear winner on a YTD basis, driven by heavy demand during the reopening of the economy. With sanctions on oil & gas, this trend looks like it will continue for at least the next few months.
Construction businesses are facing several challenges, such as a shortage of supplies and drivers to deliver them. Many of these companies were bid up to unrealistic levels based on some kind of agreement on an infrastructure spending bill. Now that looks like it won’t happen this year, and prices are falling as a result.
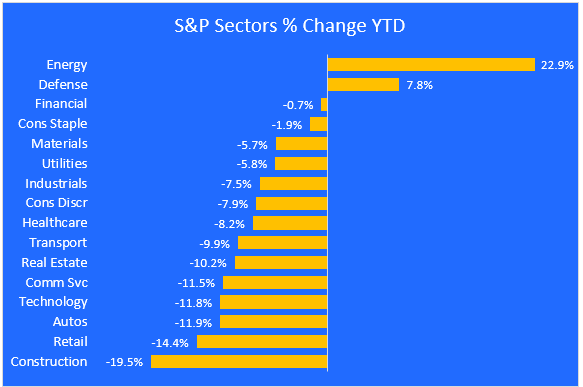
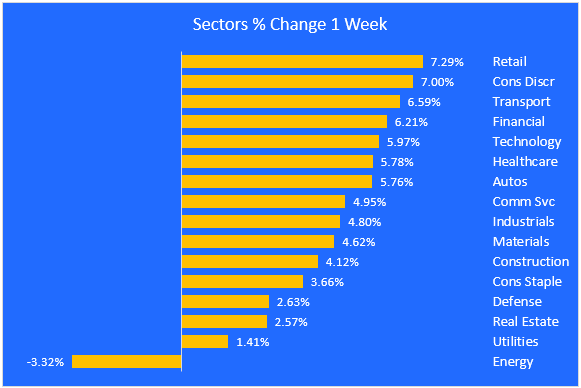
Chart 3. Sectors 1-Week % Change
Consumer Discretionary, the worst performing sector year-to-date, had a great week – up 7%. Retailers did even better. The only sector that was down for the week is Energy, which has been leading the market higher this year. It’s probably just a pause, and I expect Energy to pick up again as oil flirts with $125/barrel.
Equity Groups
Chart 4. Equity Groups YTD % Change
The next two charts show the performance of stocks that share certain characteristics, like value vs. growth, large vs. small cap, and cyclical vs. defensive. I created these groups to offer a way of visualizing the flow of investor money – where it’s going and where it’s coming from.
The S&P Top 7 (AAPL, MSFT, GOOGL, AMZN, TSLA, NVDA, FB) drove the market higher last year, and now they are out of favor with investors. They had a good week, but there’s still a long way to go for these giants.
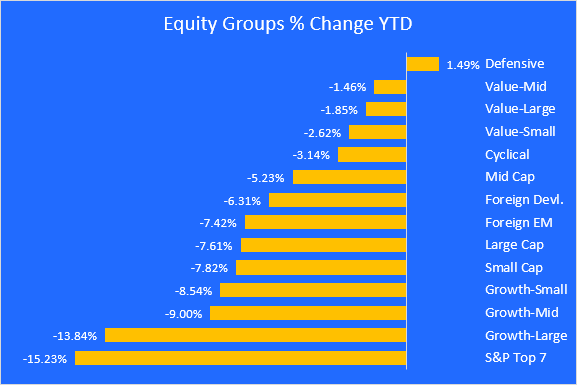
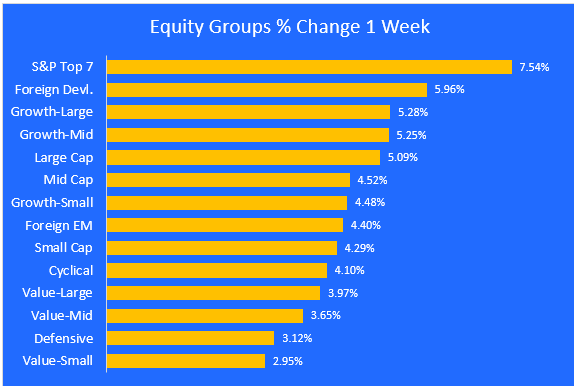
Chart 5. Equity Groups 1-Week % Change
The Top 7 had a strong week, but it’s too soon to call this a durable trend reversal.
Growth made a comeback vs. value, but I don’t think it will hold up. Europe had a rebound after getting slammed the last couple of weeks.
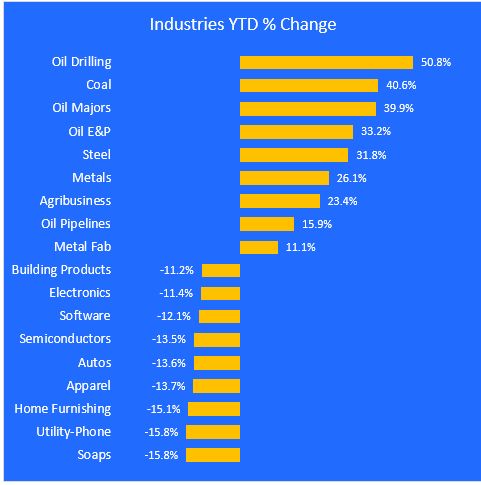
Industries
Chart 6. Industries
Here are the biggest winners and losers among the 60 industries I track. It’s no surprise that energy industries dominate the leader board. With sanctions, short supplies, and heavy demand, this looks like a durable trend. Steel and other industrial metal producers are doing well, as are agricultural businesses.
Home furnishings like tile, carpets, paint, furniture, appliances and bedding are struggling this year, and consumer basics like autos, soaps, cosmetics, apparel and phones are all being sold.
Software and semiconductors – the former market leaders – are now leading the way down.
Stock Winners & Losers YTD
Charts 7 & 8. Best and worst performing stocks
The final two charts drill down into the specific stocks that have gained and lost the most year-to-date. 8 of the 10 top performers are involved in the oil business. This looks like a durable trend, and not just an oversold bounce or a reaction to the Russia sanctions.
Producers of steel and other metals are also doing well this year.
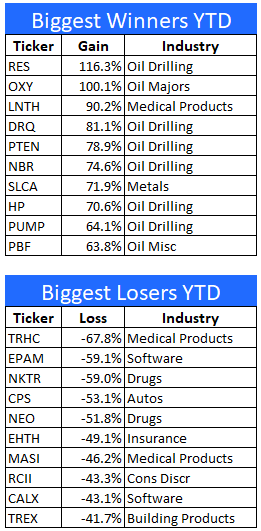
Of the 10 biggest losers YTD, 4 are from the healthcare sector. Software producers are especially hurting due to their high starting valuations, and because you can’t sell what you don’t have.
EPAM has been hit especially hard due to its large footprint in Ukraine.
Final Thoughts
After a rough start this week, the market reversed course in a big way. Does this mean the dip-buyers are back? I wouldn’t bet the ranch on it. They succeeded this week, but will they show up again next week? The situation in Ukraine is very fluid, and anything can happen. Expect more bouts of volatility (a euphemism for big down days) and more failed rallies.
It’s an absolute certainty that the dip-buyers will eventually take the market to a new high, but I don’t think we’ve seen the bottom yet. I’m betting that the 10% level will be breached again, and they will have to draw the next line at -15%.
The great rotation out of tech and into energy and other commodities continues and will probably keep going for the first half of the year, if not longer. And the rise of value over growth should remain intact. The same is true for foreign vs. domestic markets, once the picture on sanctions becomes more clear.
Regarding tech, I think the future belongs to AI, robotics, and cybersecurity. These companies are under the same price pressure that the big tech names are experiencing, but once they stabilize, I think they will become the new leaders in the tech space.
Are you looking for more high quality ideas? Consider joining The ZenInvestor Top 7, my Marketplace service. The Top 7 is a factor-based trading strategy. Its screening algorithm prioritizes reasonable price first, then the momentum, and finally projected earnings growth. The strategy produces 5-7 names, and rebalances every 4 weeks (13 times per year). The goal is to catch healthy companies that have gone through a rough period, and are now showing signs of making a strong comeback. Join now with a two-week free trial.
Editor’s Note: The summary bullets for this article were chosen by Seeking Alpha editors.
Be the first to comment