

cemagraphics/iStock via Getty Images
The 1-Minute Market Report is tailored for those who want a quick recap of what’s going on, without the usual fluff and filler. I try to focus on the main drivers of the current market action and offer some brief commentary along the way.
A Quick Summary
- The S&P 500 took a 1.9% hit for its first week out of the gate.
- At the end of week 2, it was down 2.2%.
- At the end of week 3, it was down 7.7%.
- As of today, it’s down 8.6%.
- The proximate causes are the hawkish tone of the Fed, surging inflation, omicron, and now a potential shooting war with Russia.
- There are pockets of resistance amongst the broader carnage.
- I expect to see an oversold bounce, followed by lower lows.
Markets were down, but some pockets bucked the trend.
Chart 1. Major Indices
Volatility and precious metals are the only major indices to gain ground year-to-date. Hardest hit are the tech-heavy NASDAQ and the small-cap Russell 2000.
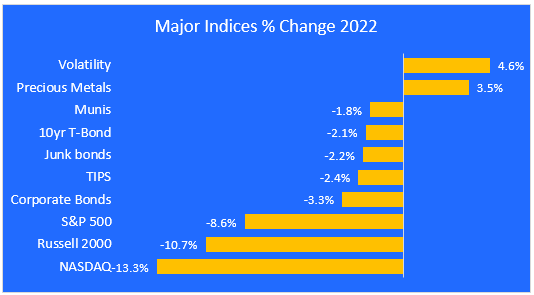
Chart 2. S&P 500 Sectors
Energy continued its strong performance from last year, gaining 16.3% YTD. Defense stocks are getting a boost from the threat of a new shooting war.
Financials are benefitting from higher Treasury bond rates and the soon-to-be-implemented short-term rate increases. This allows banks to charge more for loans. Their commercial lending activity is benefitting from an increase in capital expenditures for supply chain improvements.
Construction and tech are in the basement, thanks to fears of a Fed-induced recession.
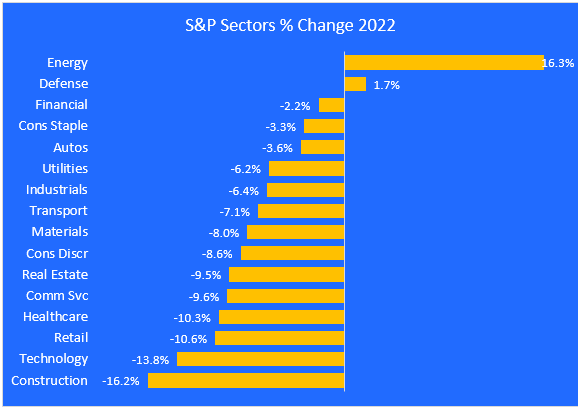
Chart 3. Equity Groups
This chart shows the performance of stocks that share certain characteristics, like value vs. growth, large vs. small cap, and cyclical vs. defensive. I created these groups to offer a way of visualizing the flow of investor money – where it’s going and where it’s coming from.
Following the money removes much of the subjectivity embedded in forecasting what may happen in the future. I want to see what’s happening now. and whether a trend is being established.
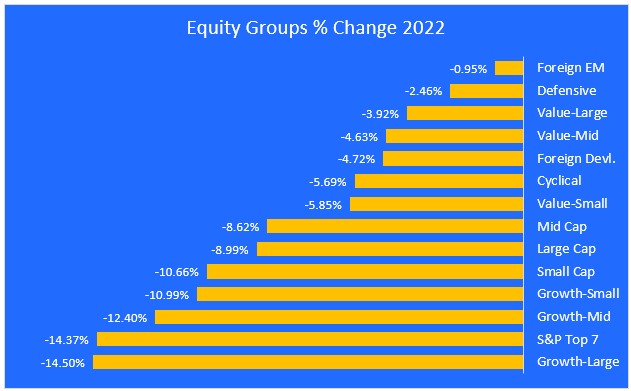
Chart 4. Industry Winners
Zacks Investment Research tracks 60 different industry groups, and that is where the next chart comes from. I won’t bore you with the entire chart of all 60 groups, but instead, show the top and bottom 10 from last week. It’s no surprise that the energy complex took 6 out of the 10 top spots on this leader board.
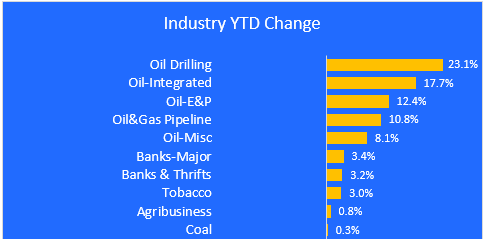
Chart 5. Industry Losers
Here are the ten industries that got hit hardest last week. I was a little surprised to see medical care as the biggest loser since it’s supposed to be a defensive group. I did a little digging and found that it was primarily the drug companies that dragged this group down.
Technology groups took 4 of the 10 bottom spots, owing largely to their high valuations and the theory that higher rates make their future earnings projections vulnerable to downward revisions.
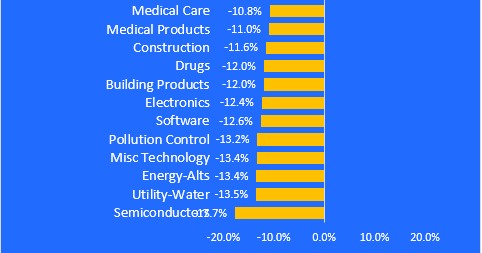
Chart 6. Stock Winners
The final two charts drill down into the specific stocks that gained and lost the most last week. 9 of the 10 top performers are involved in the oil business. And Kohls, the biggest non-oil winner in the S&P 1500, is rumored to be taken over.
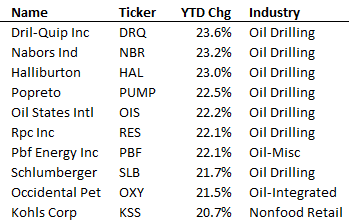
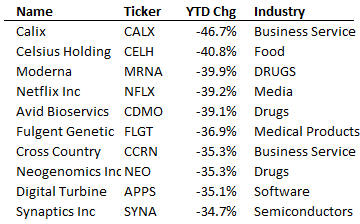
Chart 7. Stock Losers
Four out of ten losers are from the healthcare sector.
.
Final Thoughts
After mounting perhaps their biggest comeback of all on Monday, the dip-buyers are again being challenged by the rally-sellers.
They have lost the fight to defend the 5% pullback marker, and now must make a stand to defend the 10% correction line. They succeeded on Monday, but will they hold the line the next time? If they remain true to form, they should step in and take the market to a new high.
I’m betting that the 10% level will be breached, and they will have to start the march to a new high from a lower low.
Are you looking for more high-quality ideas? Consider joining The ZenInvestor Top 7, my Marketplace service. The Top 7 is a factor-based trading strategy. Its screening algorithm prioritizes reasonable price first, then the momentum, and finally projected earnings growth. The strategy produces 5-7 names and rebalances every 4 weeks (13 times per year). The goal is to catch healthy companies that have gone through a rough period and are now showing signs of making a strong comeback. Join now with a two-week free trial.
Editor’s Note: The summary bullets for this article were chosen by Seeking Alpha editors.
Be the first to comment