

Pgiam/iStock via Getty Images
Investment Thesis
21st Century paces of change in technology and rational behavior (not of emotional reactions) seriously disrupts the commonly accepted productive investment strategy of the 20th century.
One required change is the shortening of forecast horizons, with a shift from the multi-year passive approach of buy and hold to the active strategy of specific price-change target achievement or time-limit actions, with reinvestment set to new nearer-term targets.
The Consulting-Engineering industry has had serious disruptions during the Covid-19 pandemic, and few corporate participants have been able to keep profits under control. Tetra Tech, Inc. (NASDAQ:TTEK) a production manager, has more dimensions under its control than do many.
Description of Equity Subject Company
“Tetra Tech, Inc. provides consulting and engineering services worldwide. The company operates through two segments Government Services Group (GSG) and Commercial/International Services Group (CIG). The GSG segment serves federal, state, and local governments, and development agencies in water resources analysis and water management, environmental monitoring, data analytics, government consulting, waste management, and a range of civil infrastructure master planning and engineering design markets. The CIG segment provides early data collection and monitoring, data analysis and information management, feasibility studies and assessments, science and engineering applied research, engineering design, project management, and operations and maintenance services. Tetra Tech, Inc. was founded in 1966 and is headquartered in Pasadena, California.”
Source: Yahoo Finance
Yahoo Finance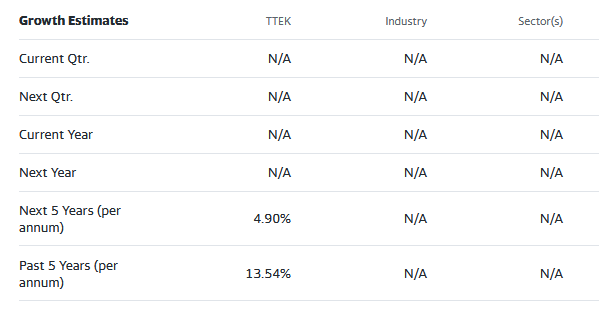
These growth estimates have been made by and are collected from Wall Street analysts to suggest what conventional methodology currently produces. The typical variations across forecast horizons of different time periods illustrate the difficulty of making value comparisons when the forecast horizon is not clearly defined.
Risk and Reward Balances Among Consulting Engineer Industry Participants
Figure 1
blockdesk.com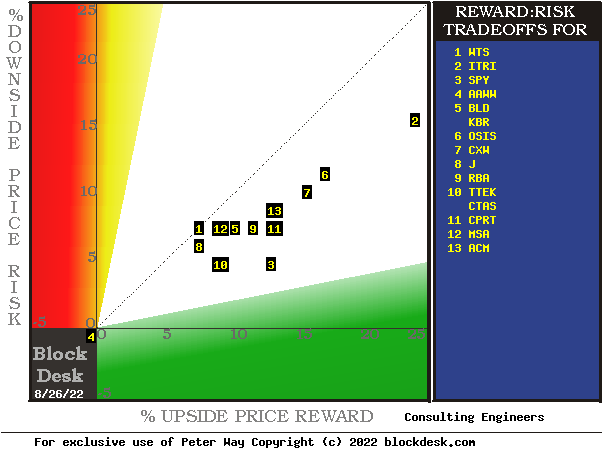
(Used with permission.)
The risk dimension is of actual price drawdowns at their most extreme point while being held in previous pursuit of upside rewards similar to the ones currently being seen. They are measured on the red vertical scale. Reward expectations are measured on the green horizontal scale.
Both scales are of percent change from zero to 25%. Any stock or ETF whose present risk exposure exceeds its reward prospect will be above the dotted diagonal line. Capital-gain-attractive to-buy issues are in the directions down and to the right.
Our principal interest is in TTEK at location [10]. A “market index” norm of reward~risk tradeoffs is offered by SPY at [3], to the right of 10. Most appealing by this Figure 1 view for wealth-building investors may appear to be SPY but Figure 2 should reveal why this may not be so.
Comparing competitive features of Consulting Engineers
The Figure 1 map provides a good visual comparison of the two most important aspects of every equity investment in the short term. There are other aspects of comparison which this map sometimes does not communicate well, particularly when general market perspectives like those of SPY are involved. Where questions of “how likely’ are present other comparative tables, like Figure 2, may be useful.
Yellow highlighting of the table’s cells emphasize factors important to securities valuations and the security TTEK of most promising of near capital gain as ranked in column [R].
blockdesk.com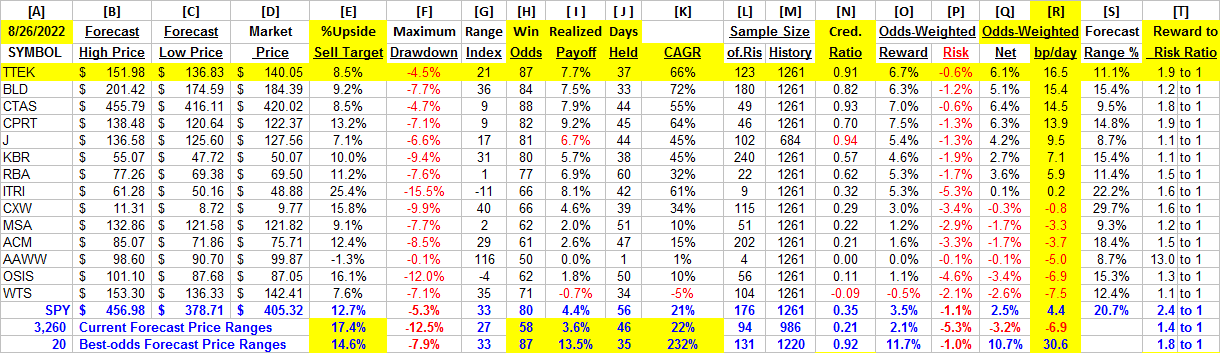
Figure 2
(Used with permission.)
Why do all this math?
Figure 2’s purpose is to attempt universally comparable answers, stock by stock, of: a) How BIG the prospective price gain payoff may be; b) how LIKELY the payoff will be a profitable experience; c) how SOON it may happen; and d) what price drawdown RISK may be encountered during its active holding period.
Readers familiar with our analysis methods after quick examination of Figure 2 may wish to skip to the next section viewing price range forecast trends for TTEK.
Column headers for Figure 2 define investment-choice preference elements for each row stock whose symbol appears at the left in column [A]. The elements are derived or calculated separately for each stock, based on the specifics of its situation and current-day MM price-range forecasts. Data in red numerals are negative, usually undesirable to “long” holding positions. Table cells with yellow fills are of data for the stocks of principal interest and of all issues at the ranking column, [R].
The price-range forecast limits of columns [B] and [C] get defined by MM hedging actions to protect firm capital required to be put at risk of price changes from volume trade orders placed by big-$ “institutional” clients.
[E] measures potential upside risks for MM short positions created to fill such orders, and reward potentials for the buy-side positions so created. Prior forecasts like the present provide a history of relevant price draw-down risks for buyers. The most severe ones actually encountered are in [F], during holding periods in effort to reach [E] gains. Those are where buyers are emotionally most likely to accept losses.
The Range Index [G] tells where today’s price lies relative to the MM community’s forecast of upper and lower limits of coming prices. Its numeric is the percentage proportion of the full low to high forecast seen below the current market price.
[H] tells what proportion of the [L] sample of prior like-balance forecasts have earned gains by either having price reach its [B] target or be above its [D] entry cost at the end of a 3-month max-patience holding period limit. [ I ] gives the net gains-losses of those [L] experiences.
What makes TTEK most attractive in the group at this point in time is its ability to produce capital gains most consistently at its present operating balance between share price risk and reward at the Range Index [G]. Credibility of the [E] upside prospect as evidenced in the [I] payoff at +7.7% is shown in [N]. For TTEK it is .91 or 9+ out of 10.
Further Reward~Risk tradeoffs involve using the [H] odds for gains with the 100 – H loss odds as weights for N-conditioned [E] and for [F], for a combined-return score [Q]. The typical position holding period [J] on [Q] provides a figure of merit [fom] ranking measure [R] useful in portfolio position preferencing. Figure 2 is row-ranked on [R] among alternative candidate securities, with TTEK in top rank.
Along with the candidate-specific stocks these selection considerations are provided for the averages of some 3,000 stocks for which MM price-range forecasts are available today, and 20 of the best-ranked (by fom) of those forecasts, as well as the forecast for S&P 500 Index ETF as an equity-market proxy.
Current-market index SPY is not competitive as an investment alternative. Its Range Index of 34 indicates 2/3rds of its forecast range is to the upside, but only about 8 out of every 10 of previous SPY forecasts at this range index produced profitable outcomes.
As shown in column [T] of figure 2, those levels vary significantly between stocks. What matters is the net gain between investment gains and losses actually achieved following the forecasts, shown in column [I]. The Win Odds of [H] tells what proportion of the Sample RIs of each stock were profitable. Odds below 80% often have proven to lack reliability.
Recent Forecast Trends of the Primary Subject
Figure 3
blockdesk.com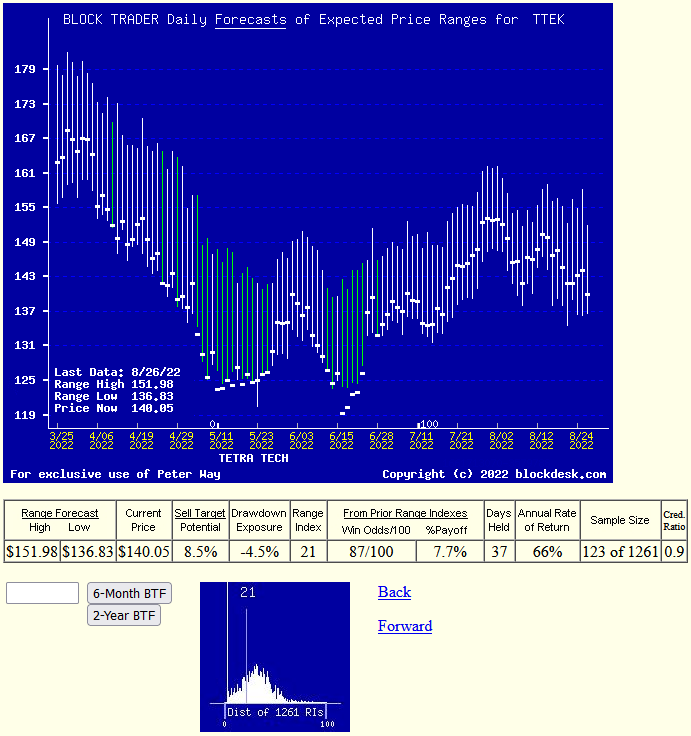
(Used with permission.)
Many investors confuse any time-repeating picture of stock prices with typical “technical analysis charts” of past stock price history. These are quite different in their content. Instead, here Figures 3 and 4’s vertical lines are a daily-updated visual record of price range forecast limits expected in the coming few weeks and months. The heavy dot in each vertical is the stock’s closing price on the day the forecast was made.
That market price point makes an explicit definition of the price reward and risk exposure expectations which were held by market participants at the time, with a visual display of their vertical balance between risk and reward.
The measure of that balance is the Range Index (RI).
With today’s RI there is 8.5% upside price change in prospect. Of the prior 123 forecasts like today’s RI, 107 have been profitable. The market’s actions of prior forecasts became accomplishments of +7.7% gains in 37 market days.. So history’s advantage could be repeated six+ times or more in a 252 market-day year, which compounds into a CAGR of +66%.
Also please note the smaller low picture in Figure 3. It shows the past 5 year distribution of Range Indexes with the current level visually marked. For TTEK, by far the largest proportion of recent past forecasts have been of higher prices and Range Indexes than today’s.
Conclusion
Based on direct comparisons with other Construction competitors, there are several clear reasons to prefer a capital-gain seeking buy in Tetra Tech, Inc. over other examined investment alternatives.
Be the first to comment