

Paperkites/iStock via Getty Images
Introduction
Let’s talk about my trading “toolbox”. Like any good carpenter or mechanic, I believe that people who engage in short- and mid-term trading should have a few tools they are familiar with for different scenarios. In this article, I will discuss one of my all-time favorites. The Terex Corporation (NYSE:TEX) is a straightforward company, which builds and sells cranes and related. Roughly one year ago, I wrote that investors should take profits and sell Terex. Since then, the stock has fallen roughly 24%. I’m not saying that to take a victory lap, but because it means my system still works. Back then, I became bearish because I expected “peak growth”. It did happen. And while economic growth is still far from levels that we can consider to be technically “weak”, investors have used TEX to price in lower growth. That’s what TEX is all about. Hence, in this article, I will explain what I expect going forward and where I would be comfortable buying this stock. So, if you do some trading, this might be interesting for you.
Trading Cycles
First of all, I don’t trade a lot. 95% of my money is invested in long-term dividend investments that I frequently cover on this website. However, on the side, I do like to trade certain stocks. When I trade, I only trade stocks that I am familiar with and only when I witness a fundamental trend. I base all of my decisions on macro/geopolitical developments, I never go off on technicals alone. That’s not my style, it doesn’t give me confidence, and it doesn’t make sense given my daily macro coverage on Intelligence Quarterly.
So, that’s where TEX comes in.
Terex is a Connecticut-based producer of construction equipment. Founded in 1986, the company has grown into a leader with a market cap of $2.5 billion.
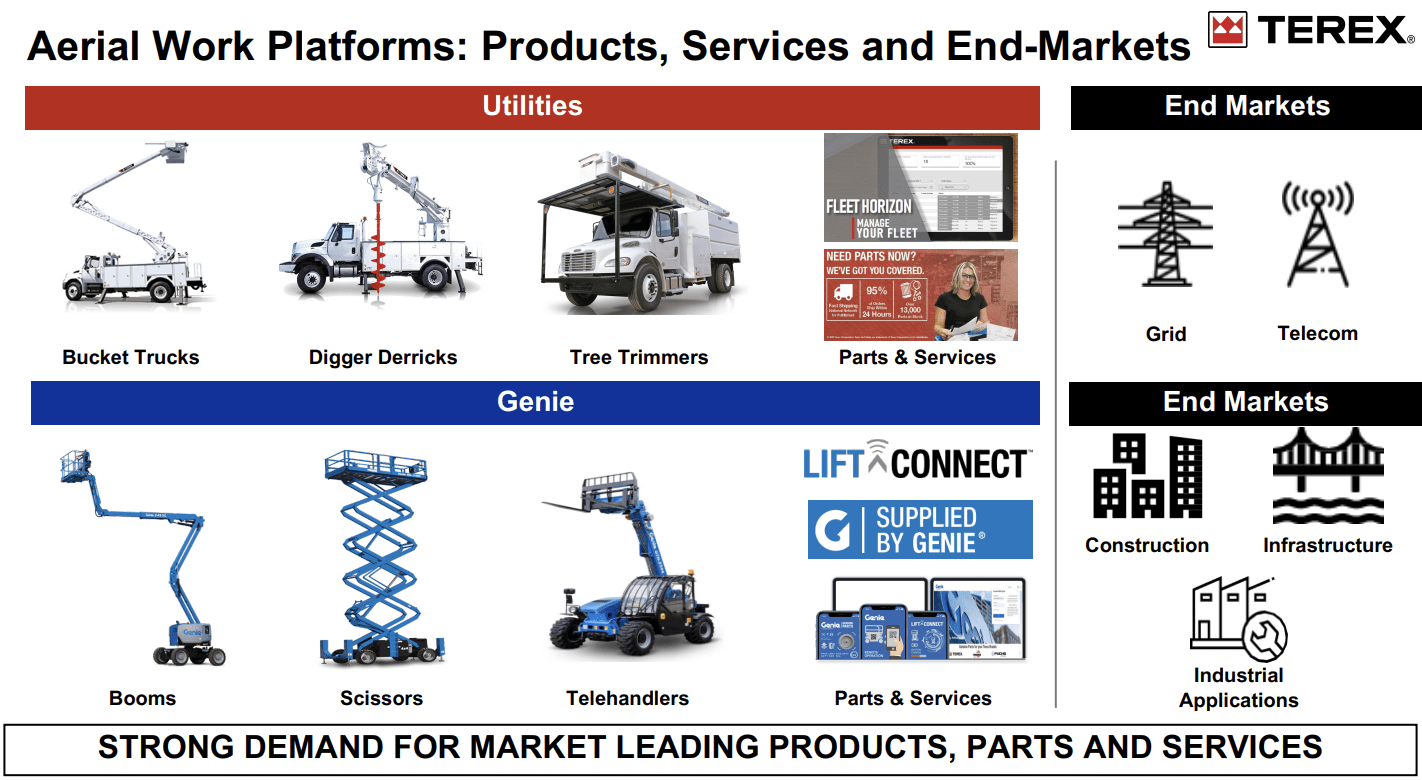
The company builds aerial work platforms like bucket trucks, digger derricks, and tree trimmers as well as booms, scissors, and telehandlers.

MarketScreener
Its end markets in this segment are grid and telecom companies (mainly utility and support companies) as well as any company engaged in construction and infrastructure.
Terex Corporation
Its materials processing segment includes concrete mixers, material handling cranes, lifting equipment as well as machines that can separate materials for i.e., mining operations. Hence, in this segment, the company targets basic material companies, recycling companies, as well as operators in construction and infrastructure.
It’s an incredibly straightforward business as I already said. The company’s products have a solid footprint in the markets they service, it’s a well-known brand, and investors’ biggest risk is macro, not mismanagement.
Hence, the company is highly correlated to economic growth indicators. The graph below is the cornerstone of this entire article. What you are looking at below is the ISM manufacturing index (orange) and the stock price of Terex. Note that the ISM index is at 57.1, which is not yet displayed in the chart below (so, slightly below the levels that are shown).

TradingView
The ISM index is a survey-based index that tells us what (in this case manufacturing) purchasing managers expect in terms of growth – to put it bluntly. A value above 50 indicates growth. A value below 50 does the opposite.
The reason why I became bearish when growth expectations were at multi-year highs is that the risk/reward was bad. This is what I wrote last year:
The company will more than likely report great results in FY2021, but most of it – maybe all of it – has been priced in. The stock went almost vertical last year as investors went from defensive to cyclical in preparation for what should be a great year for machinery earnings in 2021.
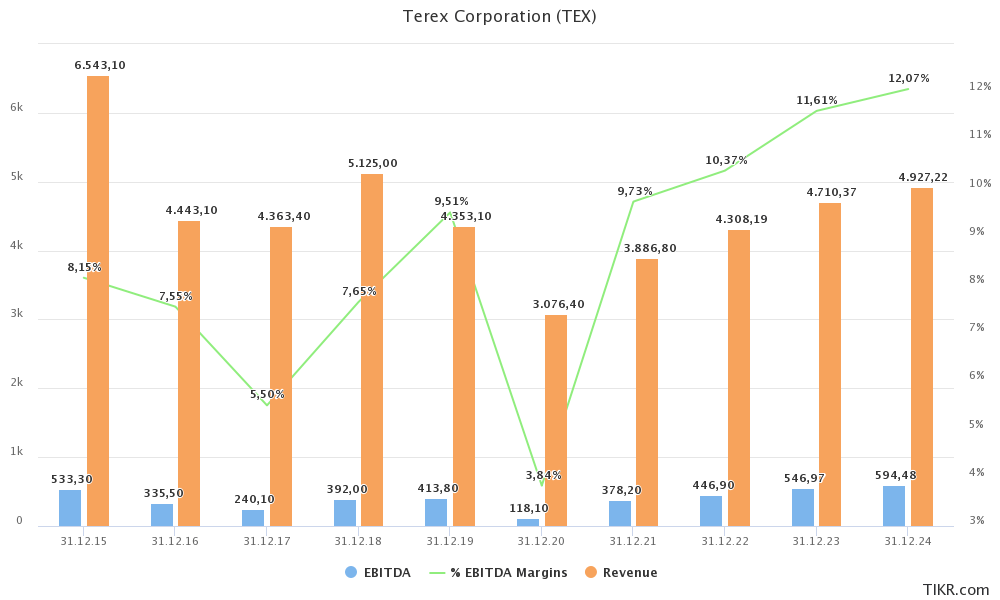
A great performance is exactly what happened. The company did $3.9 billion in revenue in 2021 after seeing a decline to $3.1 billion in 2020 when global construction took a hit during the first lockdowns. Thanks to multi-year-high adjusted EBITDA margins, the company did $380 million in EBITDA.
TIKR.com
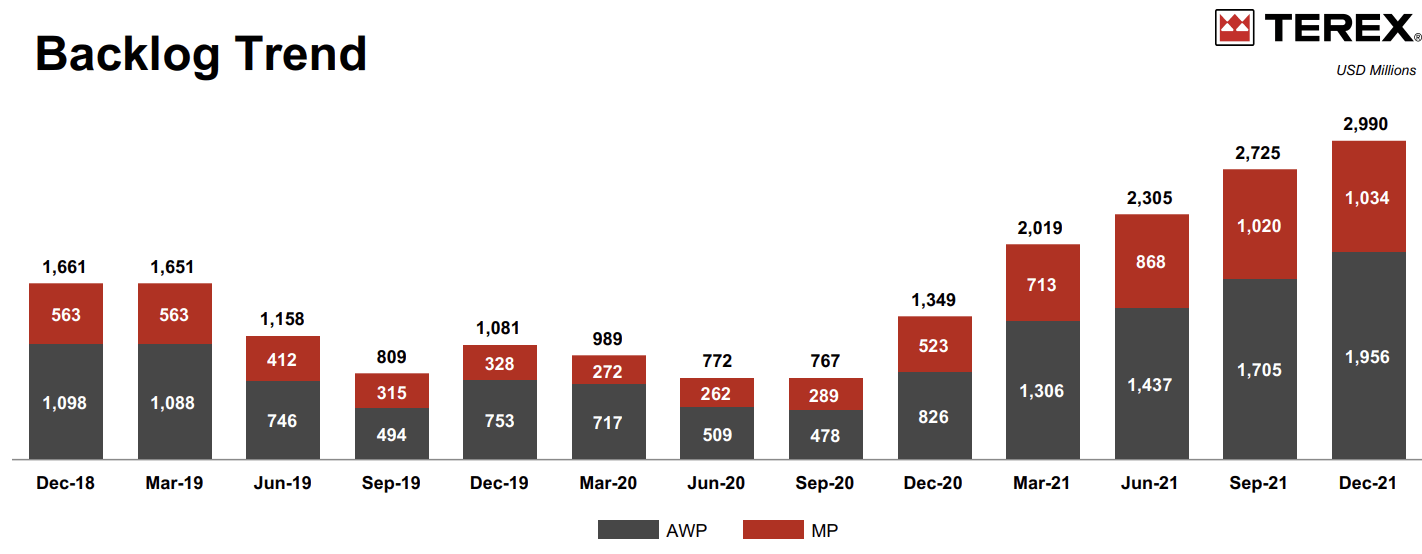
2022 is expected to be better with sales exceeding $4.3 billion and close to $450 million in EBITDA. One reason that supports this thesis is the massive increase in the company’s backlog. At the end of 2021, the company had close to $3.0 billion in the backlog. Roughly 2/3rd of this came from aerial work platforms. The company’s backlog is 122% higher compared to the end of 2020 with a value increase of $1.6 billion. That’s more or less twice the company’s total backlog in June of 2020.
Terex Corporation
The next slide shows the related book-to-bill ratios for both segments. Essentially, a book/bill ratio of more than 1.0 indicates that orders are coming in at a higher rate than the company can turn orders into sales (building and delivering the product that has been ordered). AWP ended the year with a book/bill ratio of 1.73, which has been consistently high since the end of 2020. MP ended the year below 1.0x after peaking in 4Q20.

Terex Corporation
So, now comes the hard part, making the case for more downside.
Valuation & Timing
Terex is cheap. The company has a $2.5 billion market cap and a long-term downtrend in net debt. In 2013, the company had $1.6 billion in net debt. That declined to roughly $410 million in 2021. Net year, it could be negative. The reason is high free cash flow. This year, the company could do $225 million in free cash flow. That’s 9% of the company’s market cap. The dividend yield is 1.4%, so that leaves a lot of room to reduce debt. Hence, the expectation is that net debt will turn into net cash after 2022.
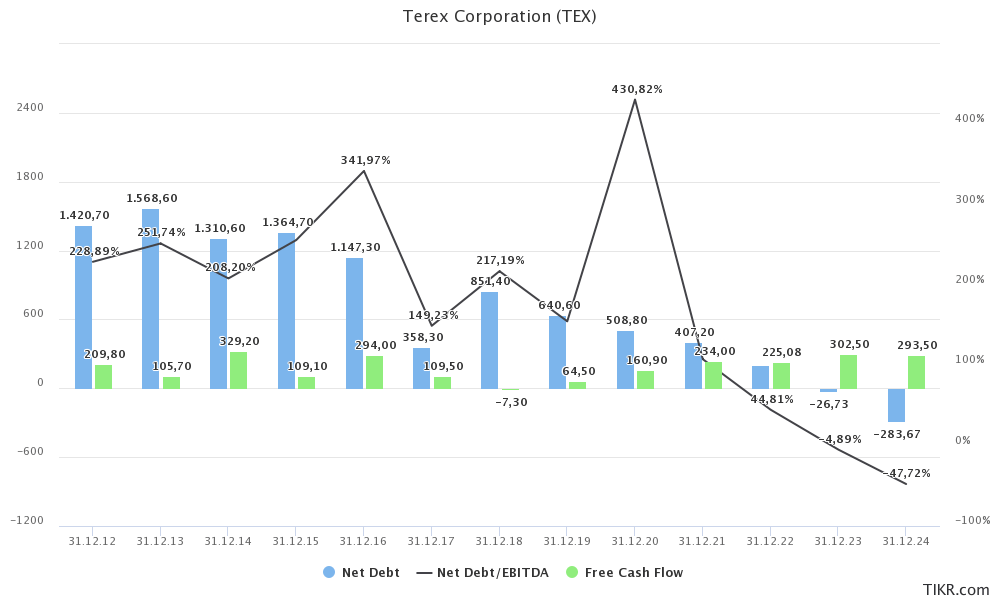
TIKR.com
As of December 31, 2021, the company also has $55 million in pension-related liabilities, which I will add to net debt.
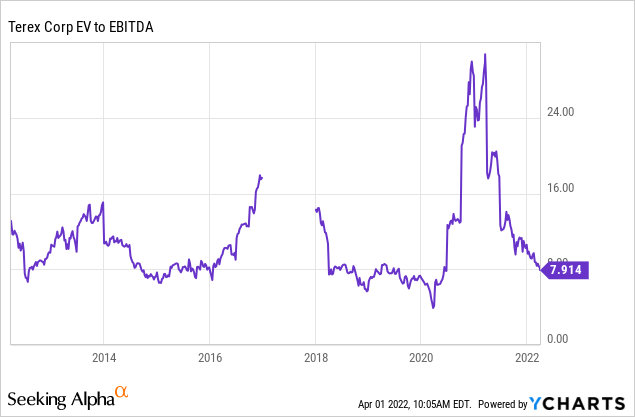
So, adding the $2.5 billion market cap to zero net debt (in 2023) and $55 million in pension-related liabilities (I could ignore these too, but I’m keeping them in), we get an enterprise value of $2.55 billion.
This gives us a 5.6x EBITDA multiple, using 2022E EBITDA of $446 million. That’s cheap, without a doubt.
With all of this said, there are reasons to believe that economic growth will decline further. Inflation is rapidly rising, the Federal Reserve will have to step in. This is causing the yield curve to invert. Basically, this means that 10-year yields are lower than 2-year yields. It means that the market is pricing in lower rates in the future. The market expects that the Fed will be making a mistake by tightening into weakness. Moreover, mortgage yields are rising, which could hurt housing demand and construction orders.
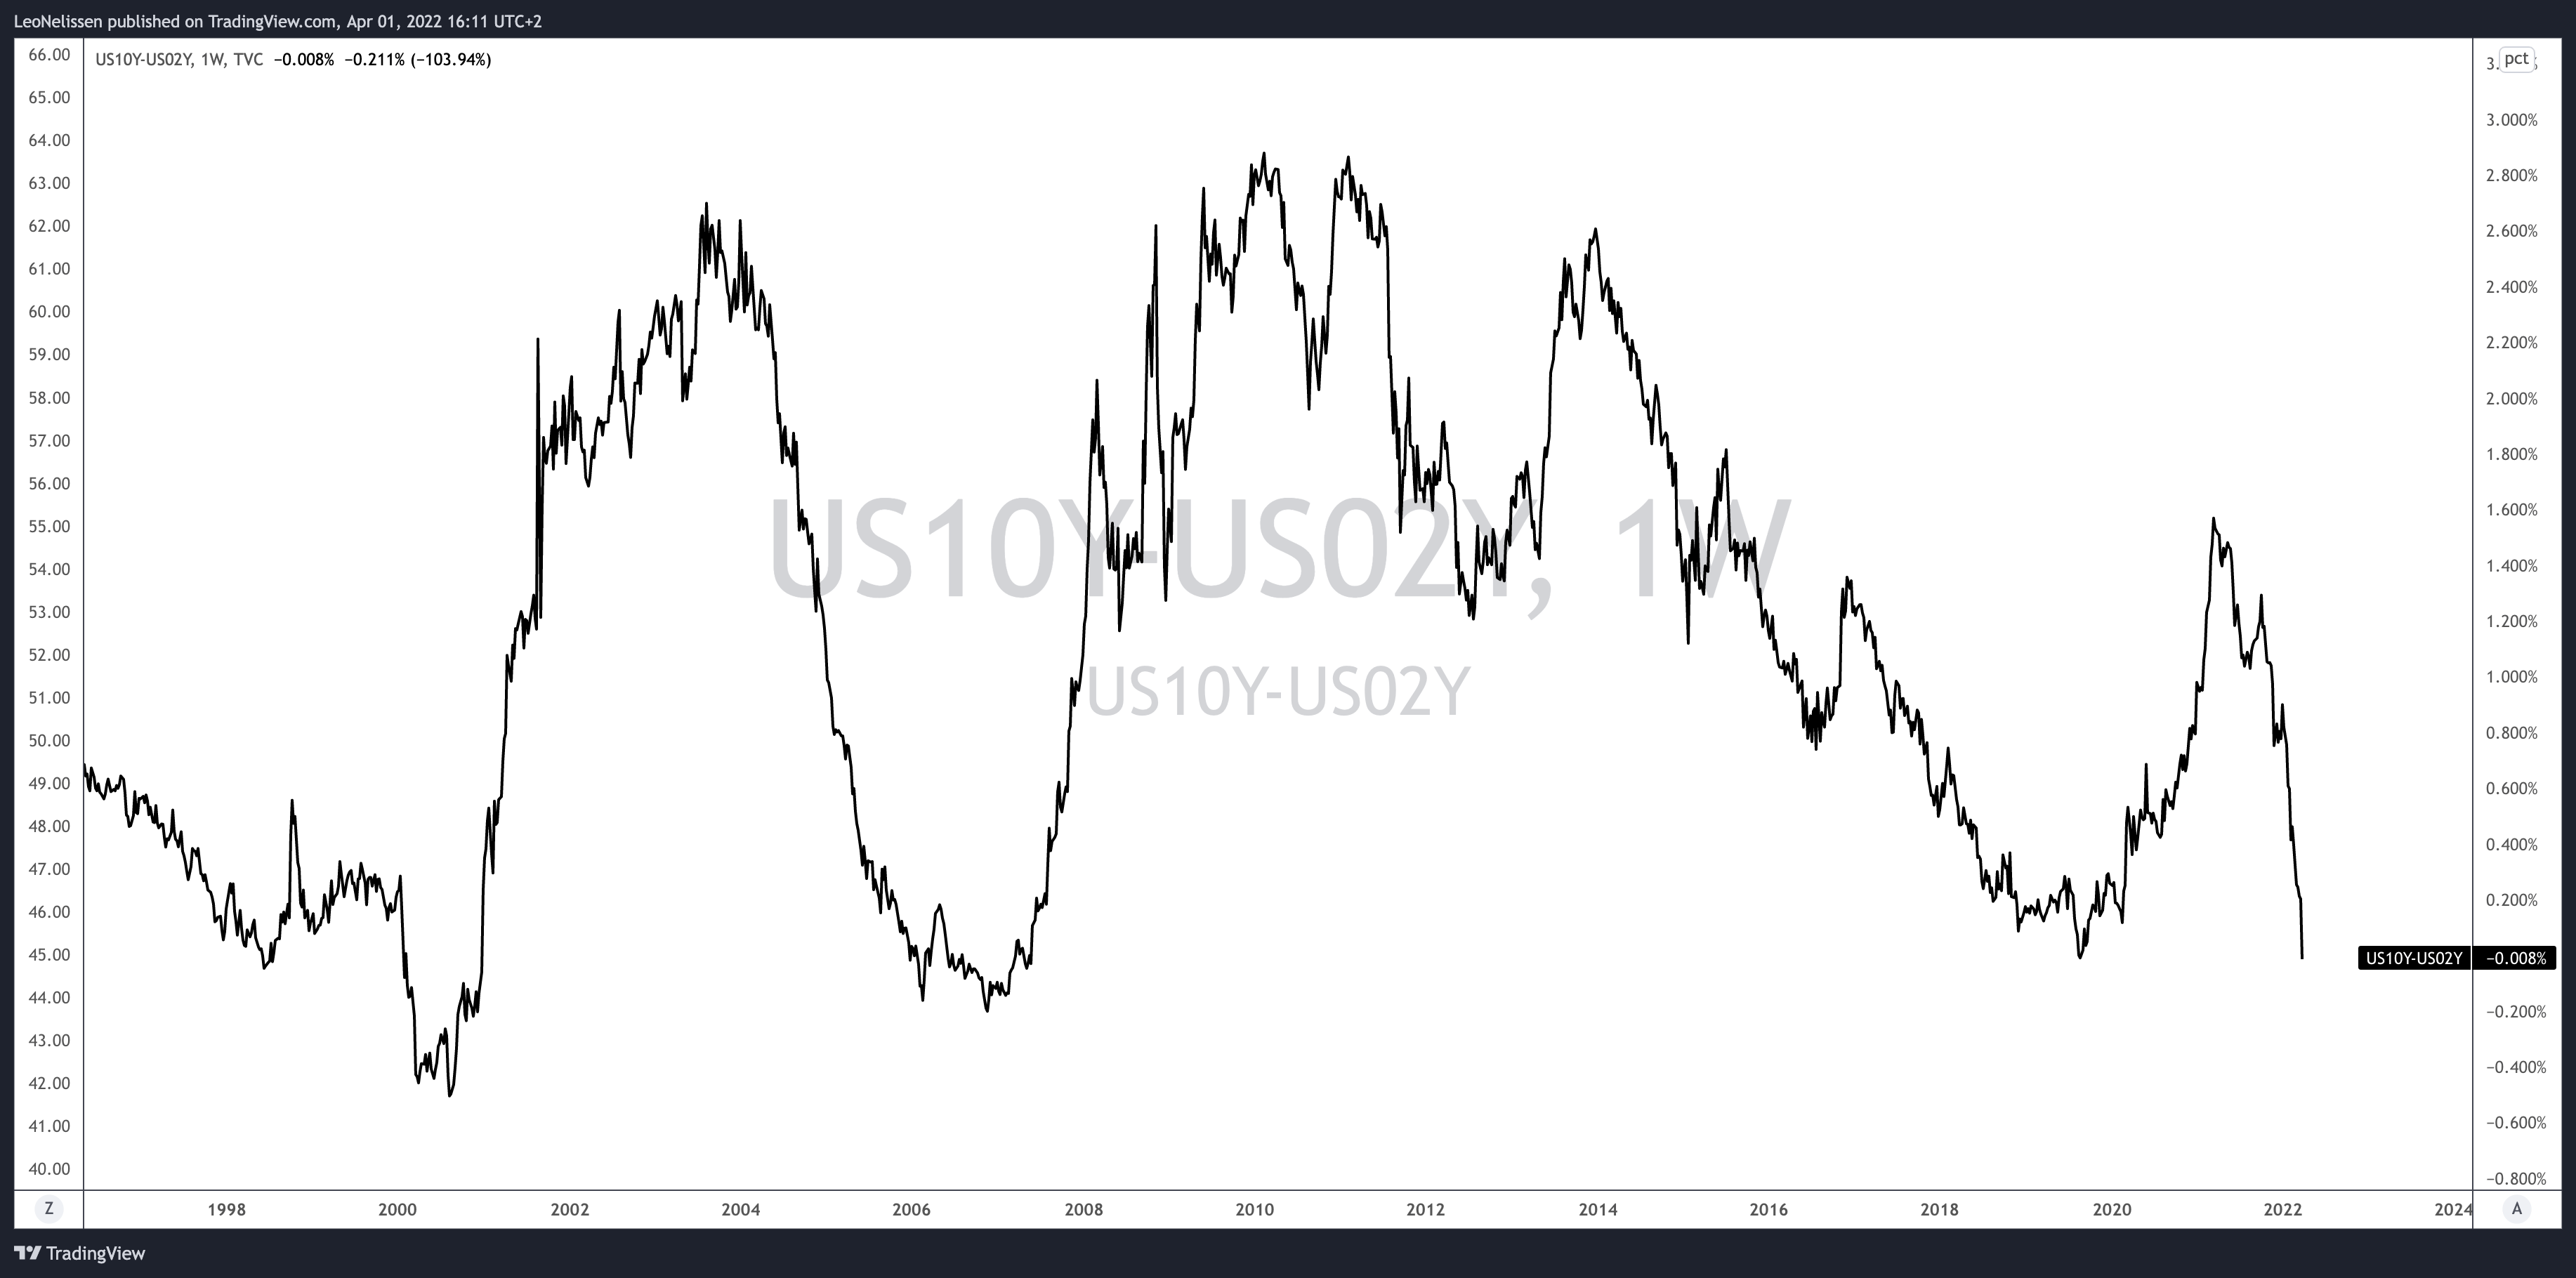
TradingView
It’s a very tough call to say that TEX will decline for one big reason: there is no guarantee that it will fall below $16 again, just because it happened frequently in the past. Reason one is that 2020 saw lockdowns. It was really bad, real fast. The current growth slowing trend does not have to be this bad. Also, the company has an extremely healthy balance sheet. It’s in much better shape than it was just 1-2 years ago.
TradingView
So, here’s what I’m going to do:
Takeaway
Terex is a fantastic company. Management has turned it into a provider of high-quality supplies in competitive industries. The debt load has come down significantly and the company started the year with a full backlog.
Unfortunately, the stock price is falling. The reason is lower economic growth expectations. We’re witnessing similar behavior compared to prior cycles when the stock peaked way before economic weakness hit newspaper headlines.
I believe that we’re in a similar growth slowing trend. This time because inflation and supply chains are too much of a burden on the economy. The Fed is expected to tighten into weakness. The yield curve is displaying these concerns, and so are leading economic indicators.
People will ask me where TEX will bottom. To that I say, I don’t know. What I do know is that the company is in better shape than it was just 1-2 years ago. If this is not a massive recession, we won’t likely see prices fall below $16 again.
However, I’m kind of hoping that the stock drops to less than $20. That will likely be the case if economic sentiment drops further, which I believe will happen. If that happens, I’m waiting to buy until the ISM index bottoms. That could happen in the second half of this year or early next year.
It’s a tough call. Patience is key here. Put TEX on your watchlist if you’re a trader. If economic growth falls, we will buy as soon as we get to a turning point. If the economy improves without more downside, we do not do anything. It’s what I call a wild-card that’s nice to have on a watchlist.
So, keep a close eye on this one. If history is any indication, we could be looking at a trade that will provide a great risk/reward for us this year. For now, I will maintain a bearish outlook.
(Dis)agree? Let me know in the comments!
Be the first to comment