

lcva2/iStock Editorial via Getty Images
Investment Thesis
Teleperformance SE (OTCPK:TLPFF) runs a generally profitable business where the top and bottom line has been increasing consistently for the last 10 years. This is in spite of the current macroeconomic headwinds of rising interest rates that have battered the profits of many companies, including American Big Techs, which are traditionally perceived to be high-growth investments.
The company’s balance sheet is just as pristine. In spite of a visibly rising debt profile, its accumulation of assets is still able to comfortably offset its debt to provide a favorable working capital.
TLPFF is very efficient in generating free cash flow (“FCF”) for the benefit of shareholders. The FCF is even rising faster than the generation of net income.
The stock is currently overvalued but price action shows that it is likely to retrace and become fairly valued soon, presenting a good investment opportunity for investors who are willing to hold and wait for this possible retracement.
Company Overview
TLPFF is a company that provides outsourced customer experience management services and other services. These outsourced services from Teleperformance SE include customer care, technical support, customer acquisition, digital solutions, analytics, management of visa applications, debt collection, interpreting and translation, and back-office services.
The clientele of Teleperformance’s services come from a variety of sectors, including the public and retail sectors, as well as telecom and technology companies.
Core Services & D.I.B.S (Digital Integrated Business Services) and Specialized Services make up the company’s two operating segments. The Core Services & D.I.B.S division accounts for a significant portion of the business’s revenue.
The company’s business is global and headquartered in Paris. It maintains its presence in 88 countries and serves 170 markets. This suggests the business is matured and has reached a sustainable scale. Hence, we expect its future growth to be incremental and stable.
Income Statement Analysis
Let’s look at how the company fares in terms of generating top and bottom-line profits.
Income Statement (Seeking Alpha)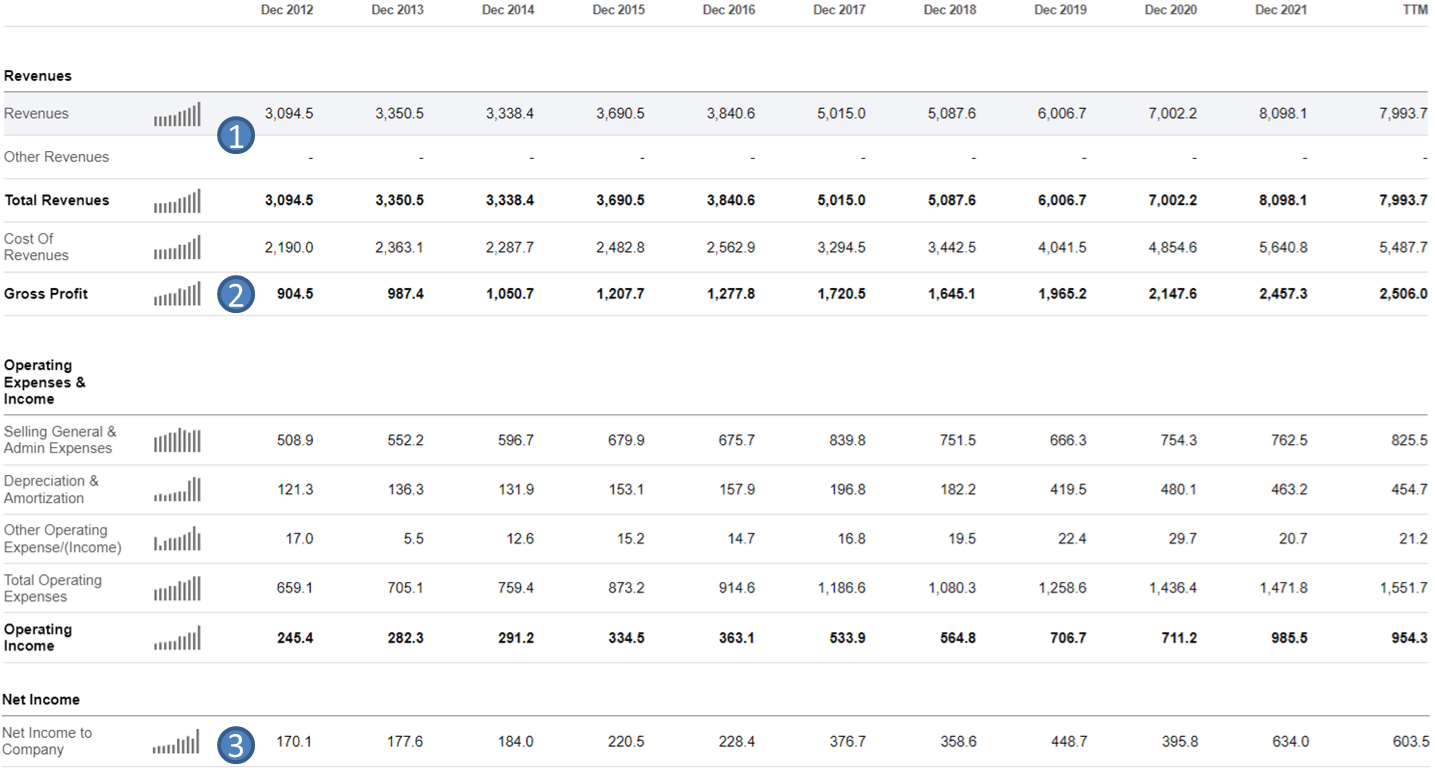
From Seeking Alpha’s Income Statement, we can infer that:
- TLPFF has enjoyed a very remarkable financial top-line for the last 10 years. Revenue has been increasing almost every single year since 2012, except for 2014. Even in 2014, the dip is just a minuscule 0.36% from 2013.
- The cost of revenue has been stable allowing the increasing revenue trend to trickle down to the gross margins.
- There was a significant increase in Depreciation & Amortization costs reported from 2019 to 2021. But this amount is relatively low compared to its overall revenue growth. Overall, the company’s bottom-line net income still reported the highest amount of $634M in the last financial year of 2021.
In my opinion, at one glance, the company’s Income Statement is pristine and there is really nothing negative to pick on.
Balance Sheet Analysis
Let’s take a look at the company’s balance sheet.
balance sheet (Seeking Alpha)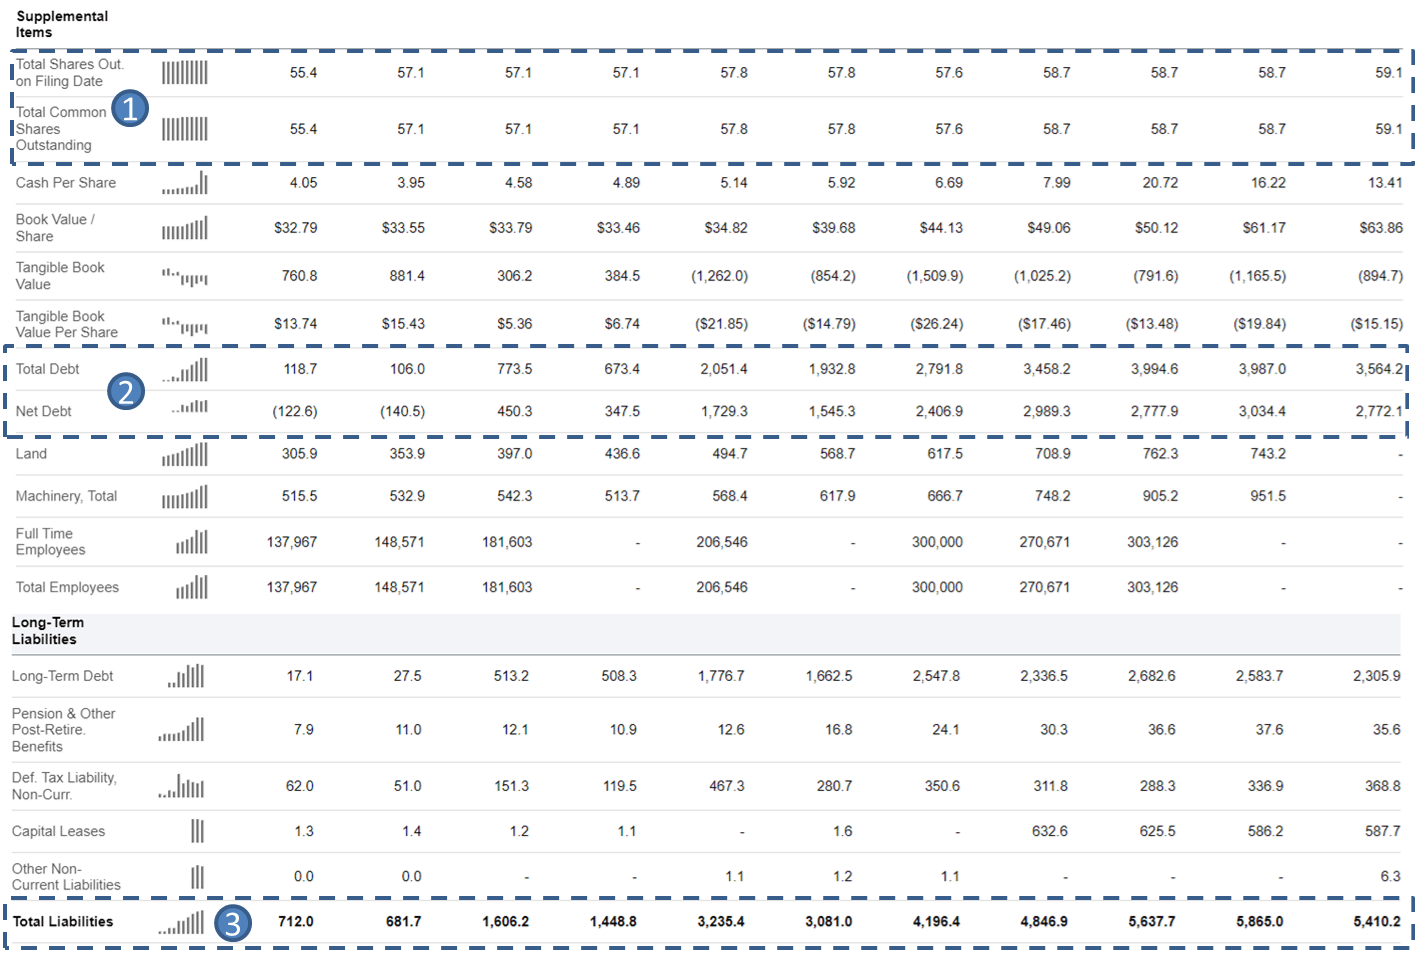
From Seeking Alpha’s balance sheet, we can infer that:
- Since the last ten years, the number of shares outstanding for the business has stayed constant, indicating that the stock’s value for shareholders has not decreased. The company has the resources to fund its growth plans without having to issue more equities that dilute the value of shareholders’ holdings.
- The amount of debt has been increasing steadily.
- The total amount of liabilities has been increasing consistently which is largely attributed to the increasing debt volume mentioned in the previous point. This could be a concern if it is not sufficiently offset by the company’s assets.
In the following table, we look at some financial ratios to find out more.
Compiled by User (Seeking Alpha)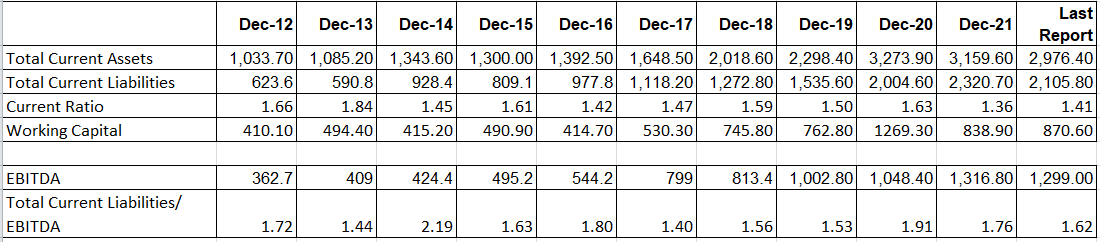
When compared to the company’s assets, the liabilities are still relatively low:
- The current ratio is still comfortably above 1 for the last 10 years
- This implies the company is still operating with a comfortably positive working capital.
- The current liabilities are still comfortably below 3 times its EBITDA. In my opinion, this is considered low.
Overall, the company maintains a very healthy balance sheet.
Cash Flow Analysis
TLPFF might have a profitable bottom line in accounting terms but at the end of the day, ‘Cash Flow’ pays the bills. Let’s check out how the company fares in terms of managing its cash flow.
Author’s Calculation (Seeking Alpha)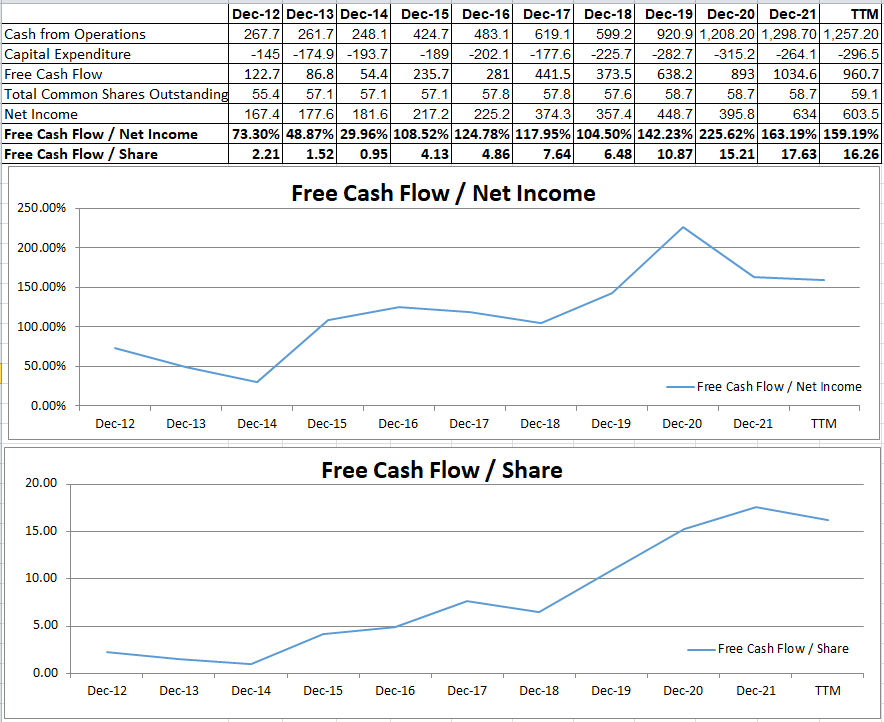
From the above table and chart, we can observe the following:
- TLPFF has been very efficient in converting accounting profits (net income) into FCF. The ratio of FCF compared to net income has been generally increasing for the last 10 years. Since 2015, it has even generated more FCF than its accounting profits (more than 100% of Net Income).
- The greatest surge in FCF occurs from 2019 onwards. As explained in an earlier section on Income Statement Analysis, there was a ‘significant increase in Depreciation & Amortization costs reported from 2019 to 2021‘. These costs are non-cash line items and hence, they are added back to the overall cash flow profile, resulting in this notable surge.
- FCF per share has been increasing as well further suggesting that the company has not been diluting shareholders’ value by issuing more shares.
Overall, the company maintains a very healthy cash flow profile.
Valuation
TLPFF is a profitable and cash-rich company generating positive FCF which appears to be sustainably increasing in the long run. This allows us to use a Discounted Free Cash Flow (“DCF”) model over the next 10 years to value the business.
Olivier Rigaudy, Deputy CEO & Group CFO of TLPFF explicitly stated his opinion on the company’s forwarding looking growth in the latest earnings call:
I’m sure that all of you have noticed that we had some — a global environment which was not simple, but we have been able to deliver sales that are growing by 15% on a reported basis
This growth figure of 15% appears achievable based on historical performance. As such, we will use this figure in the calculation of our intrinsic value (“IV”).
Collectively, we made the following assumptions for our inputs:
- FCF of $960.7M during the TTM period will be used in our calculation.
- The company will grow its FCF by 15% for the first 5 years.
- The company will grow its FCF by 7.5% (half of 15%) for the next 5 years.
- The last reported ‘Total Common Shares Outstanding‘ is $59.1M.
- The last reported ‘Total Cash & ST Investments’ is $792.0M.
- The last reported ‘Total Debt’ is $3,564.2M.
- The discount rate is estimated to be 7.14%, taken from the WACC value.
IV Calculation (Different Sources)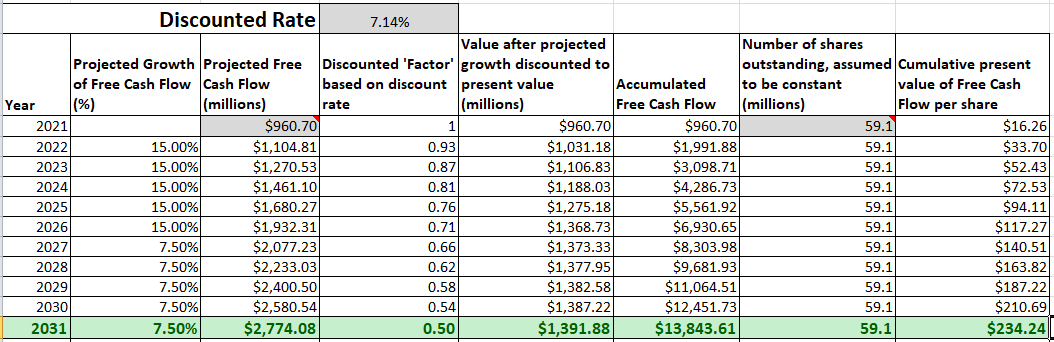
Based on the above inputs, the present value (“PV”) of the projected FCF per share for TLPFF is $234.24.
IV Calculation (Different Sources)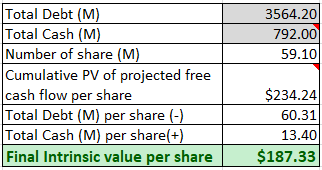
Taking into account the total debt and cash that the company is holding, the final intrinsic value is about $187.33.
At the current price of about $227, DPSI’s share price is currently 21.17% overvalued ( 227/187.33 -1).
Investment Risks
Right now, we observed and discussed that the company’s debt is on an uptrend. But this is mitigated by the fact that it is still small compared to its assets and EBITDA.
There is no absolute guarantee that the company will continue to generate profits and cash flow that consistently outstrip the rising debt incurred. Investors need to be aware of and monitor the debt profile in the long run.
Conclusion
TLPFF may look like a fundamentally good stock based on the analysis of its financial statements as we have done earlier.
However, a stock that is fundamentally good is only a good investment when it is undervalued.
Price Action (Yahoo Finance)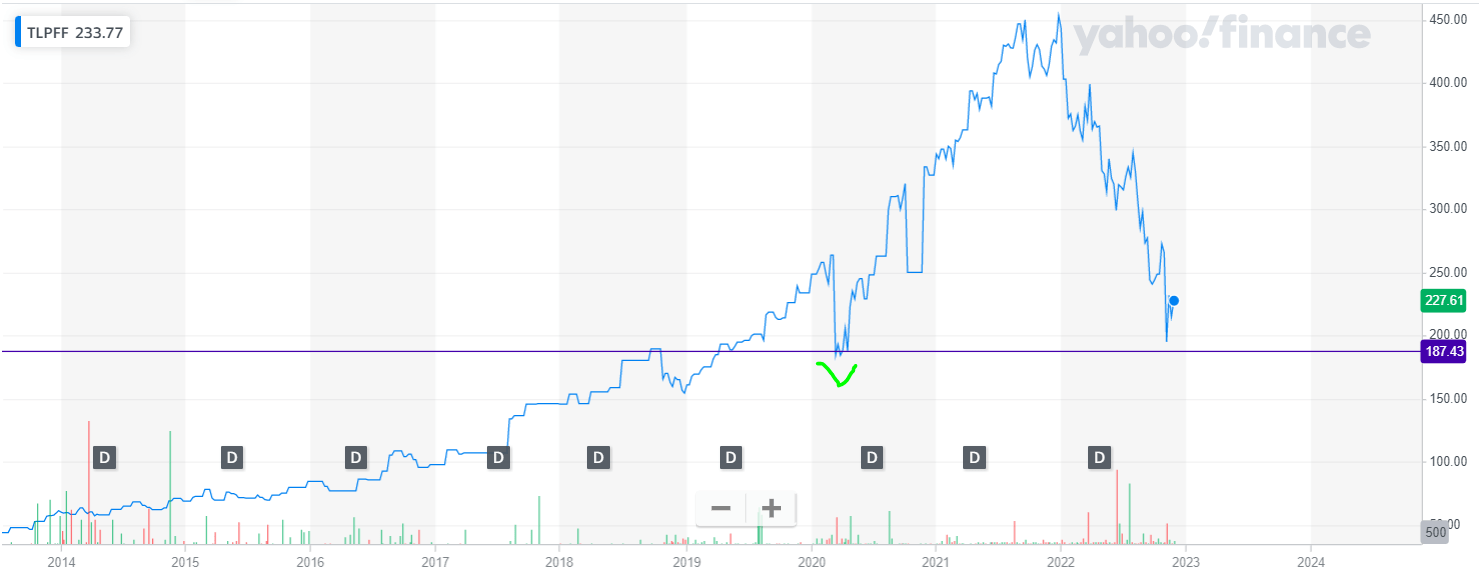
Right now the stock is overvalued. We calculated the IV to be about $187. On the technical chart, this coincides with horizontal support that is tested once in Apr 2021.
The price is currently on a downtrend and is getting very close to this horizontal support. Hence, with this confluence of fundamental IV and technical support at the price of $187, we think it is likely that the price action will test this support once again.
Investors should only enter a position when the price retrace to $187.
Be the first to comment