

Key Talking Points:
- IBEX remains unable to break above the 61.8% Fibonacci
- Another round of lower highs show bearish pattern repetition
- Covid-19 deaths remain high but new infections bring some hope in Spain

Recommended by Daniela Sabin Hathorn
Get Your Free Equities Forecast
If I’m honest, I haven’t looked at the IBEX 35 chart in a while, and I’m not surprised to find current price where it is. I have been mentioning for a while that the Spanish stock market was going to be one of the hardest to recover from the pandemic, mostly in part to the big reliance of its economy on tourism. Judging by what we’ve seen since the summer, the IBEX remains highly sensitive to corrective pressure in the market, whilst it lacks the potential to fully exploit bullish sentiment and therefore is likely to remain behind its European peers for some time.
IBEX 35 Daily chart
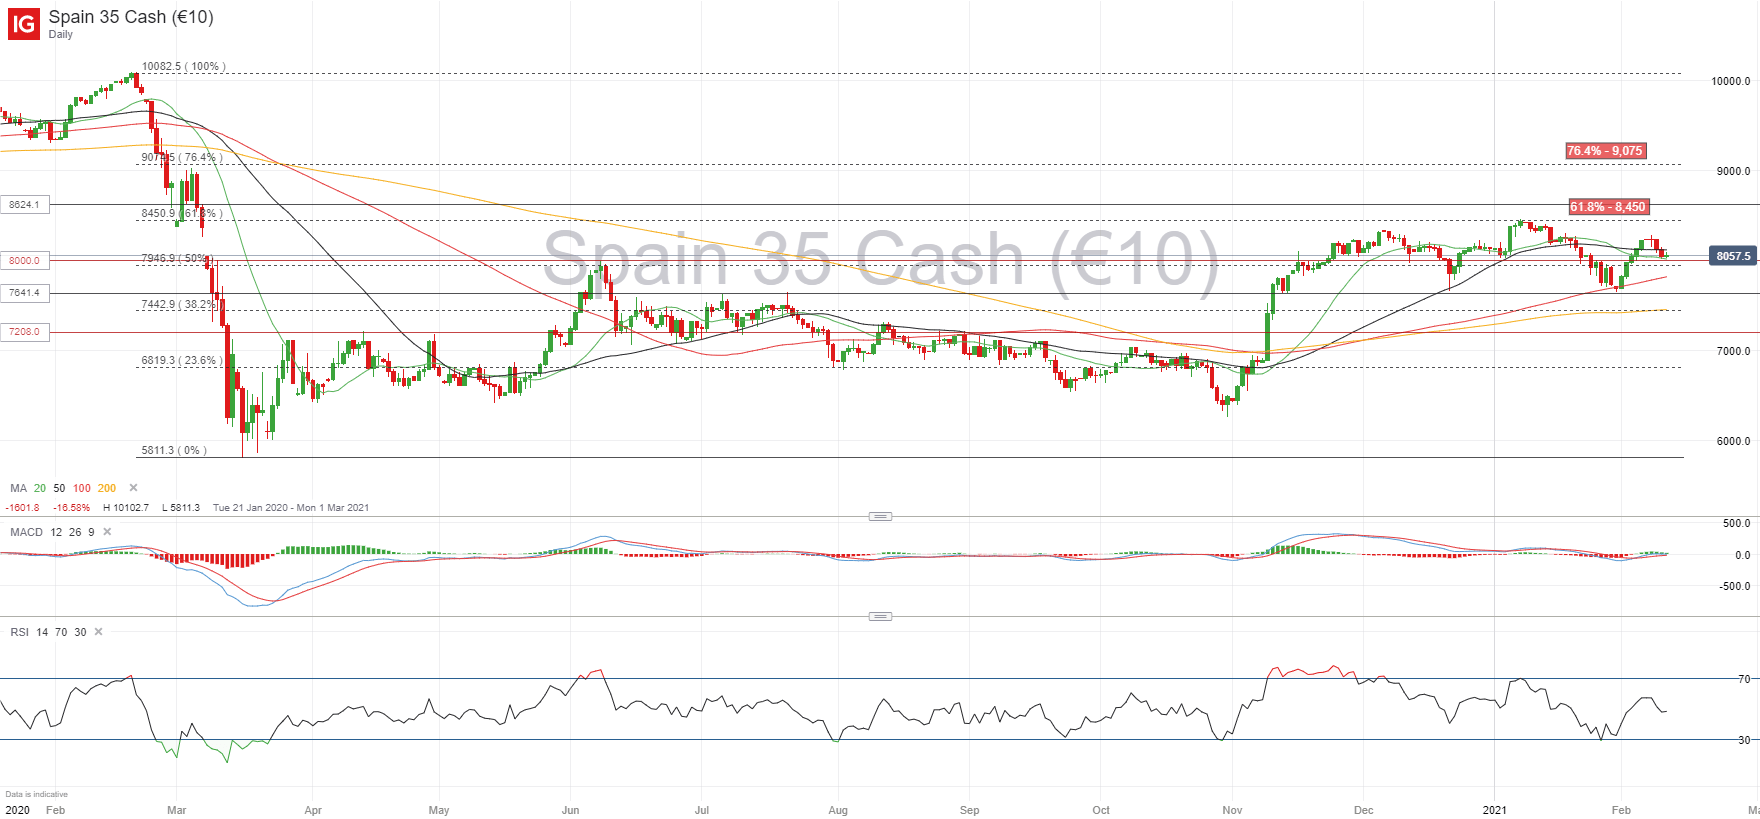
Looking at the daily chart, the one moment that stands out since the stock market meltdown in March is the bullish run seen at the beginning of November on the back of positive vaccine trial results, which saw the IBEX surge 30% in just over two weeks. Realistically, I doubt we’ll see another move like that unless we get a sudden improvement in the virus situation and people are able to move semi-freely again.
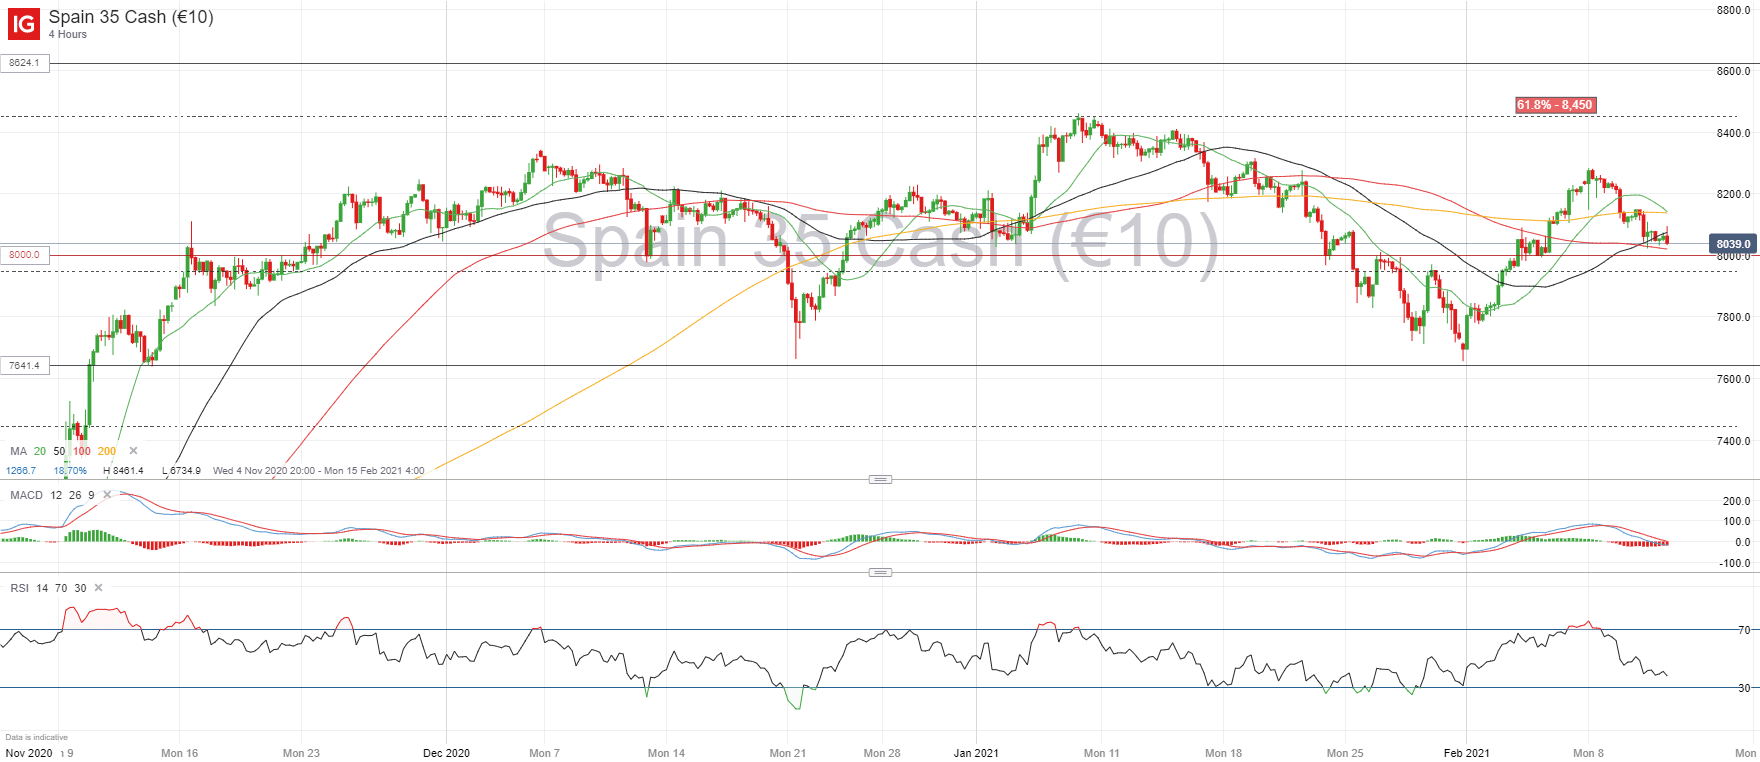
I’ve mentioned many times before how important Fibonacci levels are to gauge how an asset is performing relative to its peers, so the fact that the IBEX is continuously consolidating between two Fibonacci levels is no surprise. Looking at the four-hour chart, the drop seen at the end of January fell in line with the strong support I had previously mentioned at 7,641, but I now think we may be about to see the same pattern unfold in the next few weeks. The drop in the month of January saw a rebound in the first week of February with an inflection point at 8,280, at which point we are seeing lower highs happening again. If this pattern continues, a break below the 8,000 mark is probably a good sign that further bearish pressure may arise, heading below the previous support towards the 38.2% Fibonacci at 7,443.
IBEX 35 4-hour chart
With regards to Covid-19, Spain continues to see high numbers of daily deaths as many of its districts remain under lockdown conditions that limit social interactions and reduce the number of hours, if any, that bars and restaurants are able to operate. The one data point that provides some hope is the rate of new infections, which has declined significantly in the last two weeks, pointing to a possible relaxation of social distancing measures in the next few weeks. That said, people are still conflicted about the possibility of a summer season, with many small business owners having already been pushed into bankruptcy, with many others claiming they’ll have no choice but to close their businesses if the situation doesn’t improve in the next few months, given the lack of financial support from the Spanish government.
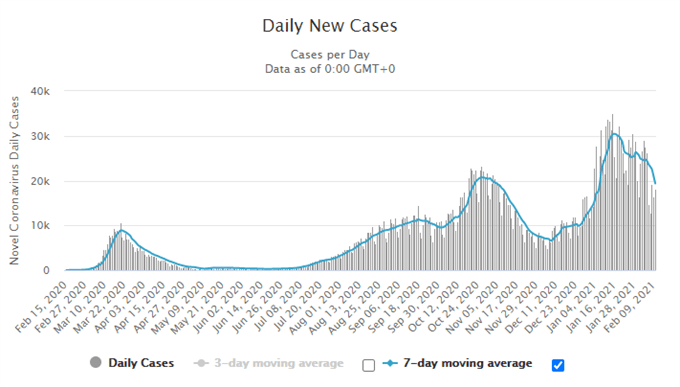
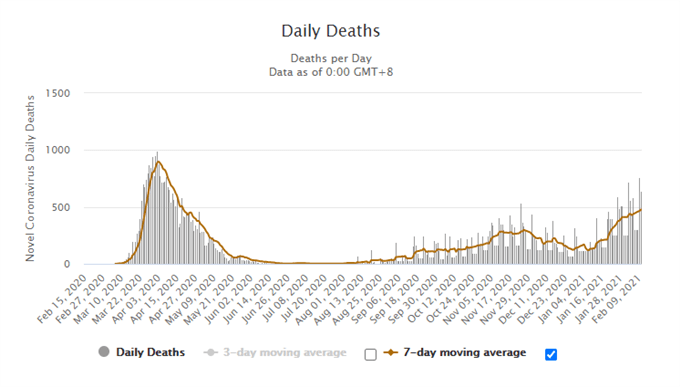
Source: worldometers.info

Recommended by Daniela Sabin Hathorn
Top Trading Lessons
Learn more about the stock market basics here or download our free trading guides.
— Written by Daniela Sabin Hathorn, Market Analyst
Follow Daniela on Twitter @HathornSabin
Be the first to comment