

The Fed’s job is not done given the elevated level of inflation today. Khanchit Khirisutchalual
Inverse bond ETFs, funds which essentially short Treasury bonds, are having a phenomenal year. The ProShares Short 7-10 Year Treasury ETF (TBX) has risen 13.43% year-to-date and the ProShares Short 20+ Year Treasury ETF (NYSEARCA:NYSEARCA:TBF) has risen 29.20% while the S&P 500 (SPY) is down 17.34%. Both funds initially rose yesterday on the announcement that inflation was 8.3% in August, against expectations that it would fall slightly, although TBF closed the day down. Both funds ended the day at a larger than normal 0.07% premium to their net asset value, possibly indicating there could be a correction. Nevertheless, given that inflation is embedded in the economy, further gains on these ETFs are highly likely.
Inverse bond funds are doing well because of the Federal Reserve’s fight against inflation. To bring inflation under control, the Fed has been increasing interest rates since March and is expected to further increase its target range for the federal funds rate by at least 0.75% at its Federal Open Market Committee (OTCPK:FOMC) meeting next week. Fed funds are the FOMC’s main policy rate and set the interest rate at which banks lend their excess reserves held at the Fed to each other overnight. Simultaneously, the Fed is selling some of its assets, such as Treasury bonds, which is reducing the supply of money in the economy. There has been little growth in the money supply (as measured by M2) since April.
Seven Inverse Treasury ETFs
There are only seven ETFs available today that essentially short Treasury bonds. Because inverse bond funds short bonds, they use leverage, which is a multiple of how much the fund is short relative to the initial capital it holds. Five of the inverse bond ETFs include leverage multiples of two (-2x) or three times (-3x) (the minus sign indicates they are short). The more leverage the fund has, the riskier it is. Note that inverse bond ETFs do not actually short bonds; rather, fund managers achieve their short objectives predominantly via swap agreements and a little bit of short selling of interest rate futures contracts. It is cheaper to replicate a short bond position in this manner rather than directly shorting them.
In Table I, I summarize the seven inverse bond funds. All the 20+ Year Maturity ETFs have higher assets under management (AUM) than the 7-10 Year Maturity ETFs. Given that we are in a rising interest rate environment, this makes sense because the 20+ Year maturity bond funds have a modified duration of 18.29 years and the 7-10 year 7.97 years.
Modified duration measures by how much a bond’s price will change given a change in interest rates. Higher duration means a larger price change. When rates rise, bond prices fall – not a good thing for long bond portfolios, but perfect for short portfolios, given the inverse relationship between interest rates and bond prices. Therefore, for short bond funds, as interest rates rise, their prices rise. Furthermore, since the longer a bond portfolio’s duration, the more sensitive it is to interest rate changes, for short bond funds with high durations, prices will rise more than those of lower duration bond funds. Hence, the popularity of the 20+ year bond ETFs over the 7-10-year funds.
Seeking Alpha, Bloomberg, Morningstar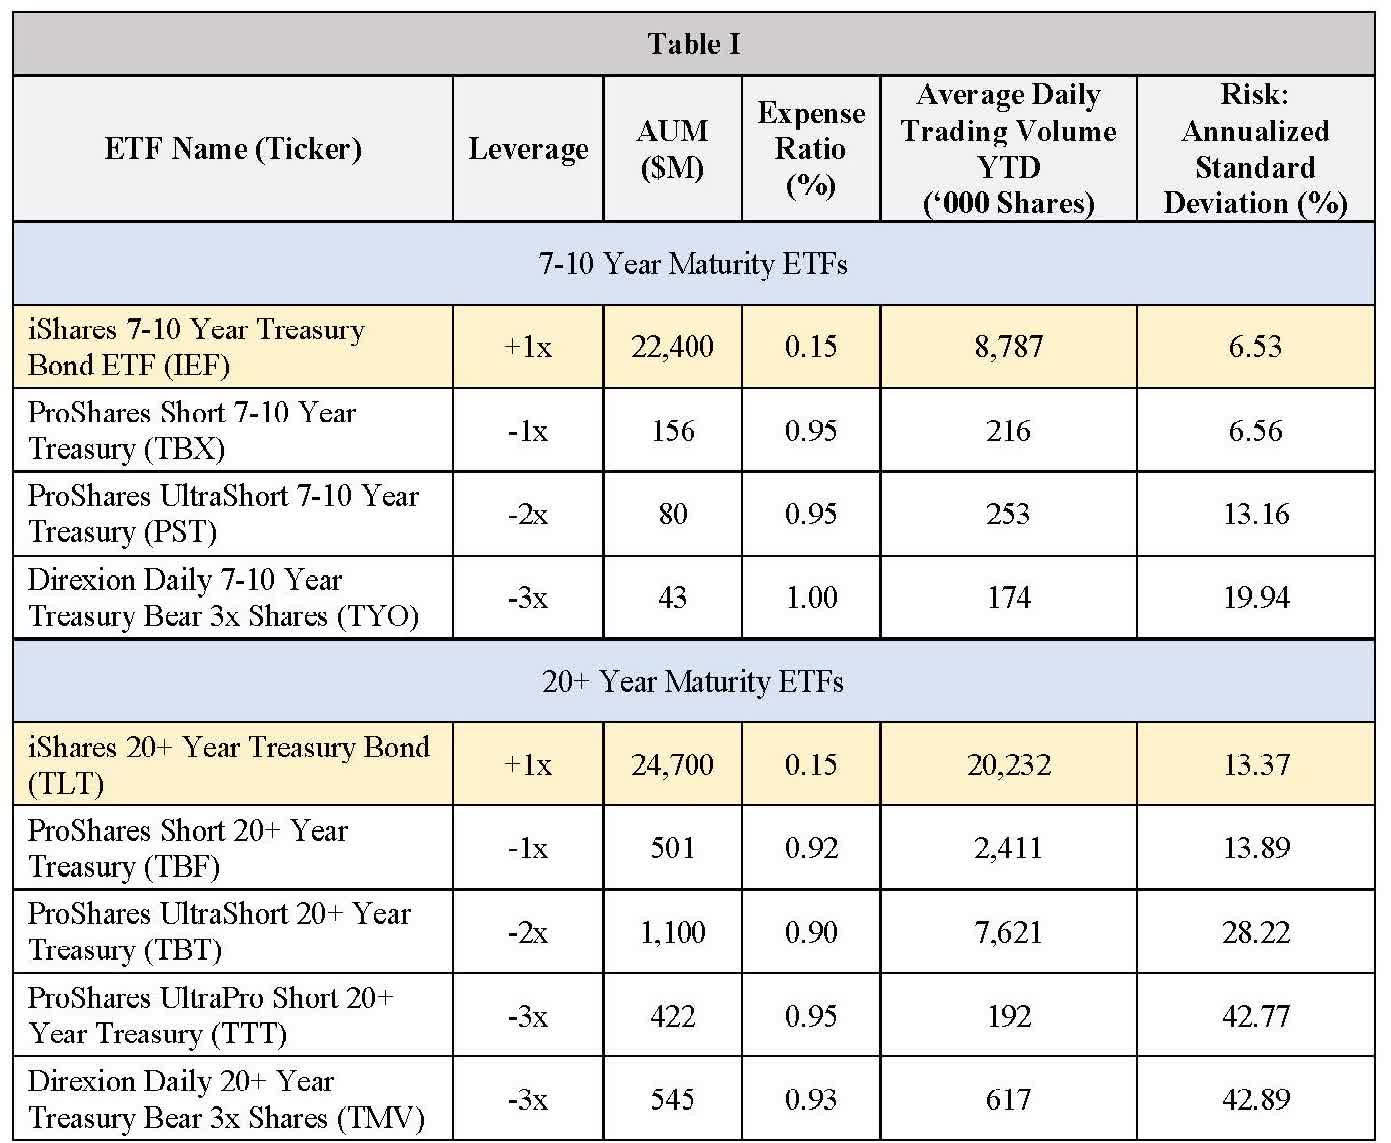
Notice that all these inverse funds have high expense ratios in comparison to the iShares long Treasury ETFs shown in Table I. It is important to remember that these reflect the costs of directly managing the fund and do not include the cost associated with their leverage. The costs due to leverage reduce the returns of the funds, on top of the expense ratios.
The most popular inverse bond fund by assets under management (AUM) and trading volume is the ProShares UltraShort 20+ Year Treasury ETF (NYSEARCA:NYSEARCA:TBT) with $1.1 billion in AUM. Direxion Daily 20+ Year Treasury Bear 3x Shares (TMV) is second in terms of AUM, with $545 million under management while TBF is second with regard to daily trading volume. A critical measure for investors to stay conscious of is the risk of these ETFs, presented in the last column of Table I. The levered -2x and -3x funds have enormous amounts of risk, with the -3x funds having standard deviations above 42%.
In Table II, I summarize the cumulative returns on these inverse funds. In this table, you can see the exceptional performance of these funds over the last year. The ProShares UltraShort 20+ Year Treasury Fund TBT is up 63.23%, and the ProShares UltraPro Short 20+ Year ETF (NYSEARCA:NYSEARCA:TTT) has gained 100.78%. All these inverse bond funds have had upward momentum since early August, with TBX up 5.21% and TBF up 7.16% just in the last month.
Seeking Alpha, Bloomberg, Author’s calculations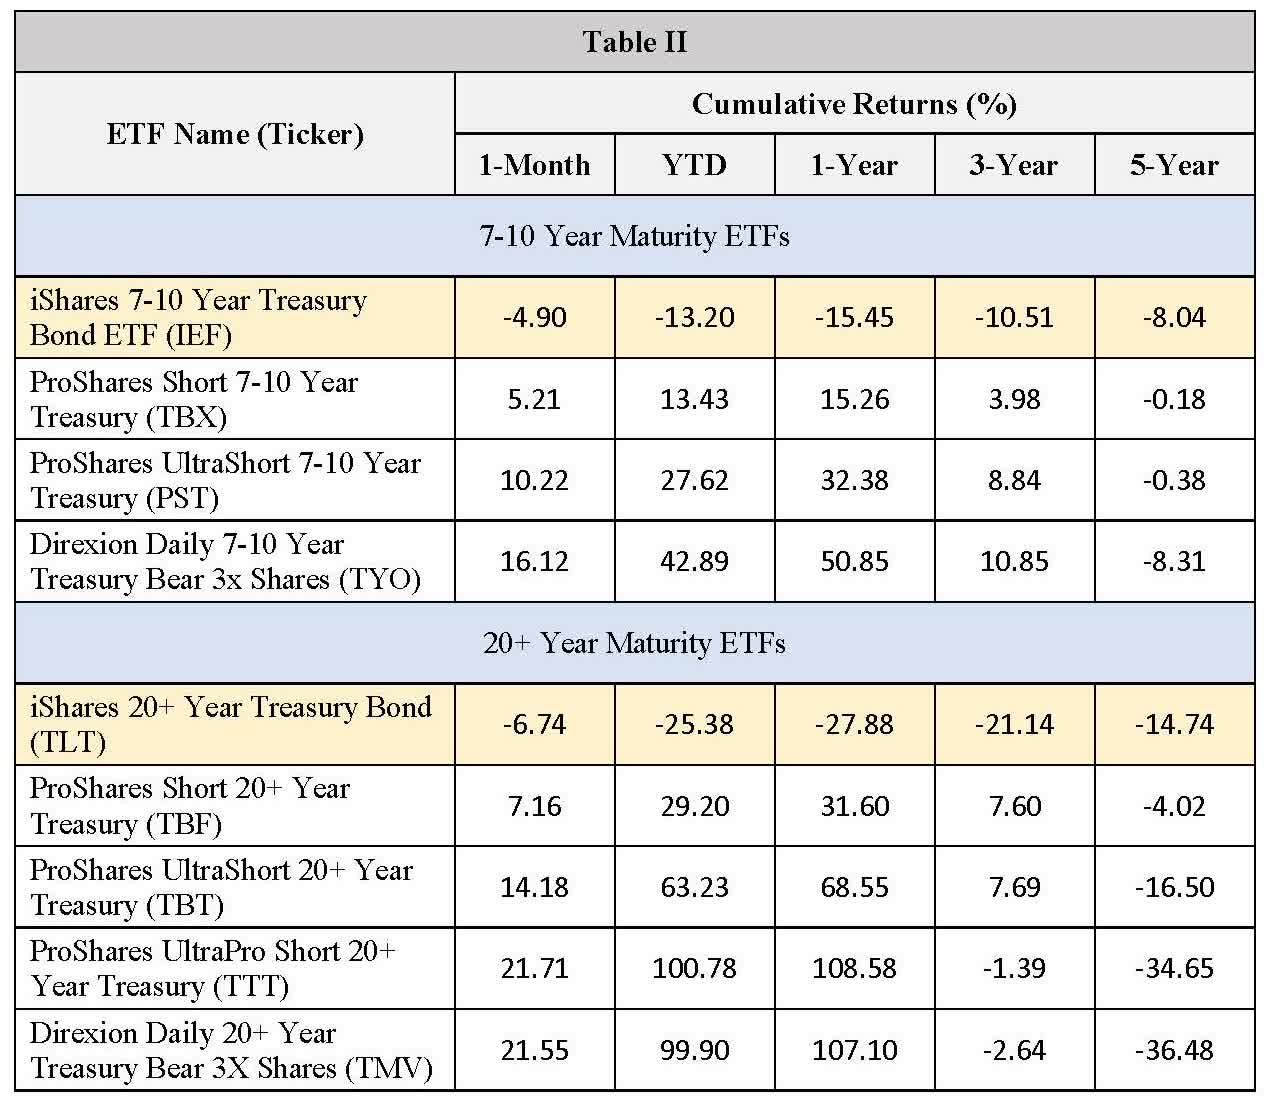
As can be seen in Chart I below, the AUM of TBF has fallen since February, along with its number of shares outstanding, a pattern that also holds for the other short bond ETFs. Given that TBF’s price has not fallen during this period, this reduction in shares outstanding indicates this fund’s authorized participants have been redeeming their ETF shares back to ProShares. An authorized participant is a financial institution that usually acts as a market maker in the funds for which they are authorized, and they can create or reduce the number of shares an ETF has outstanding. They do this via ETF baskets that contain all an ETF’s holdings. To reduce the number of ETF shares outstanding, they redeem their shares to the sponsor, and in return, they receive back ETF baskets; to create new ETF shares, they do the opposite: giving the sponsor ETF baskets, and in return, receive new ETF shares.
ProShares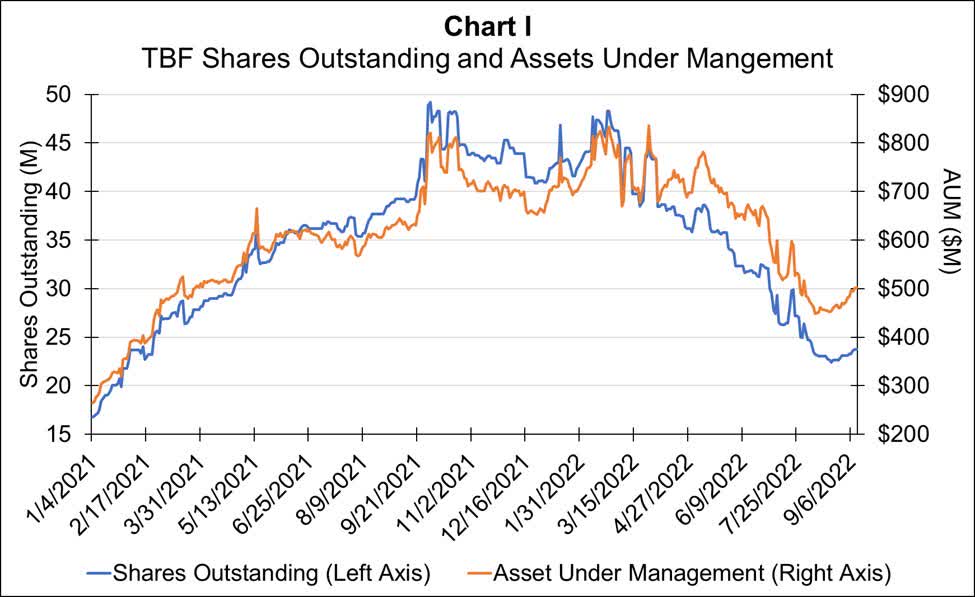
The Fed Funds Rate is Driving the Returns to These Funds
As stated earlier, the rising fed funds rate is one of the major determinants of inverse bond funds’ prices. In Chart II, you can see the relationship between the fed funds rate, 5-year inflation expectations, and TBF’s share price. TBF’s contemporaneous correlation with the fed funds rate since the beginning of last year is 0.78. The other major determinant is inflation expectations. The 5-year inflation expectations as calculated by the Cleveland Federal Reserve have a correlation with TBF’s share price of 0.72. I checked different measures of inflation expectations and found that this 5-year measure from the Cleveland Fed had the highest correlation with TBF’s share price.
Bloomberg, Federal Reserve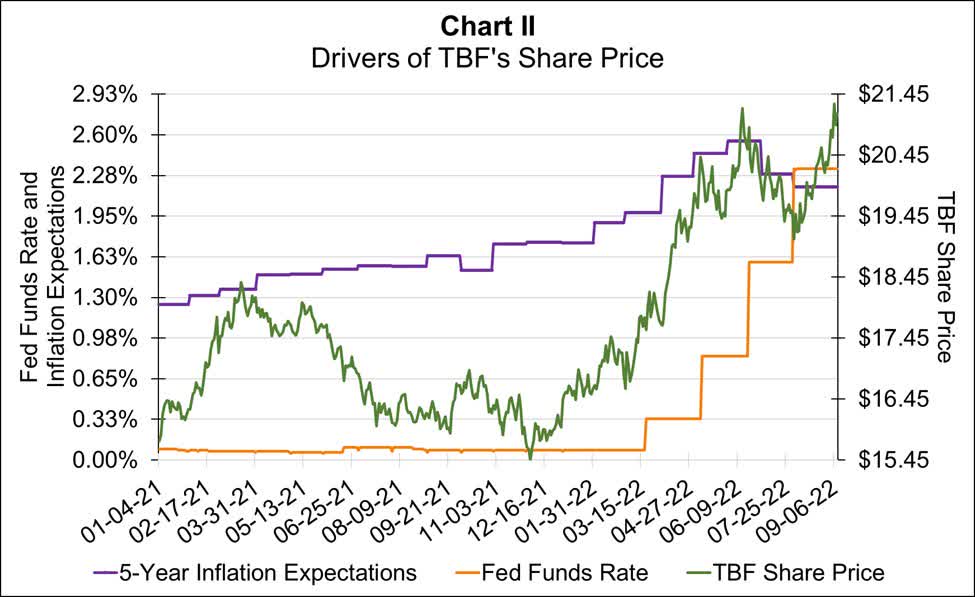
Not Too Late to Capture the Momentum
With the inflation rate staying elevated, we can assume inflation expectations will rise again, and we can expect the Fed to continue to increase the fed funds rate and to sell assets off of its balance sheet. As stated, the prices of these funds have been rising since early August out of expectation of the Fed rate hike next week and since the fed funds rate will continue to rise into next year, there will continue to be upward pressure on the prices of these funds.
The question remaining is whether the inverse bond funds will continue their upward path, or is it too late to get in on this action? Given yesterday’s inflation numbers, I conjecture to say it is not too late, although, the effect of yesterday’s inflation announcement will be incorporated into their prices very rapidly. Inflation now is embedded in certain aspects of the economy, such as rental costs and food prices. Given the history of inflation and interest rates that was experienced in the 1970s and early 1980s, it is quite possible the Fed will have to move the fed funds rate to 8% to bring inflation down. This is substantially higher than the market is expecting, leaving room for upward movements in inverse bond funds’ prices.
Be the first to comment