

djmilic/iStock via Getty Images
Although Costco (NASDAQ:COST) and Target (NYSE:TGT) share many similarities, there are glaring differences between the two firms, and the diverging share price action between COST and TGT over the last month attests to those disparities.
Costco’s shares were up over 4% in June. Meanwhile, Target’s stock underperformed the S&P 500 by a wide margin last month. This is despite the fact that Target’s trailing twelve month P/E is below 12x while Costco’s P/E is 37x.
The two companies’ most recent quarterly results provide insights into why the stocks are headed in opposite directions; however, dissecting the business models shows that despite being categorized as retailers, these are two very different firms.
What Recent Results Reveal
With a plunge of nearly 25%, TGT suffered the second-largest drop in share price of any S&P 500 company during the latest earnings season.
The results for Target were truly dismal. Operating income plummeted 43.3% to $1.3 billion while adjusted EPS also swooned, falling to $2.19, a drop of 40.7%. The retailer’s cost of sales also increased, from $16.7 billion in the comparable quarter to $18.5 billion in Q1 2022.
The following commentary by CEO Brian Cornell during the last earnings call works well to summarize the problems Target faced during the quarter.
Our first quarter gross margin rate was well below our expectations, reflecting a combination of factors that proved to be very different than expected, driven by a rapidly shifting macro backdrop and changing consumer behavior. More specifically, we saw much higher-than-expected rate and transportation costs, and a more dramatic change in our sales mix than we anticipated.
Management’s strategy to meet surging customer demand amid supply chain disruptions was to increase orders for certain categories of merchandise. However, customers responded to price inflation by purchasing essential items in lieu of discretionary products.
Consumers pared back on purchases of apparel, home, electronics, and sporting goods products, leaving Target with swollen inventories. Management opted to cut prices and to lease additional warehouses to deal with the excess inventory. Despite those efforts, Target ended its Q1 with $15.1 billion in inventory, setting a record for the company’s highest-ever quarterly inventory level.
The poor quarterly results were followed by an announcement on June 7th in which management issued a revised forecast. The company revealed plans to cancel orders and invest in additional warehouse space near ports to handle its supply chain issues. At the same time, plans were revealed to make additional markdowns in overstocked merchandise while taking pricing actions to counter rising fuel prices and transportation costs.
Consequently, management lowered its guidance. Operating margins are expected to hit about 2.0% in Q2, well below the 6.5% consensus.
Analyst John Zolidis responded with a scathing diatribe:
Frankly, as of this morning we were still trying to process how the company misplanned its inventory composition so badly against the stimulus-check comparison.
Costco’s most recent results stand in stark contrast to Target’s. Issued a bit over a week later, Costco’s earnings call revealed a beat on the top and bottom line. Diluted EPS of $3.04 was up from $2.75 in Q3 of last year. Net sales of $51.6 billion were up 16.3% year-over-year.
Sales were driven by a 5.6% increase in shopping frequency in the US, and a 6.8% increase worldwide. This accompanied a 10.4% increase in the average transactions in the US with a 7.6% growth in the average transaction worldwide.
Costco’s membership numbers were up 6% over last year, to 64.4 million households. Membership renewal rates notched an all-time high at 92.3%, a 0.3% increase from the prior quarter. Worldwide renewal rates were also strong, hitting 90% for the first time in company history.
Like Target, Costco’s inventory levels were up, albeit for different reasons and with different results. I’ll turn to management’s comments on the topic during the earnings call to provide context.
Our total inventory in Q3 was up 26% year-over-year versus up 19% in Q2, a couple of high-level comments regarding inventory. A material component of the increase year-over-year is inflation rather than unit growth. We continue to expand and open new locations, 20 new in the last 12 months. We are lapping some low stocks in certain departments as a result of last year’s high demand. And we are purposely building inventory in our e-comm business, primarily in big and bulky categories as mentioned earlier in the call.
…we feel good about our current inventory levels. The additional inventory we’re carrying is in the right departments, and they feel good about our ability to move it.
How Are Costco And Target Different?
The average consumer may view Costco and Target as similar businesses. They are retailers that were defined as essential businesses during the pandemic. Both companies cater to customers seeking quality at a low price, and both sell groceries, clothing, electronics, and pharmaceuticals, to name but a few product categories that each offers. However, viewed from the perspective of an investor, there are important differences in the two that should be considered.
For example, in FY 2021, 54% of Costco’s sales were derived from food and sundries. In contrast, only around 19% of Target’s sales are derived from food products.
Groceries drive foot traffic, even during recessions and periods of high inflation. You can speak of consumers switching food brands to combat inflation, but I am willing to wager that when we emerge from this period, the average American will still be obese or overweight.
In other words, food sales will only suffer marginally.
More specifically, in the first quarter, we continued to see strong growth and market share gains in food and beverage and essential categories.
Brian Cornell, CEO, Target
However, during that same earnings call, Target’s management emphasized that inflation is taking a heavy toll on spending for discretionary items.
As Brian and Christina mentioned, this quarter, we ended up carrying too much inventory in several categories where the slowdown in sales was more pronounced than expected, including home, electronics, sporting goods and apparel.
Not only did the two management teams respond to their customer bases in a different fashion, but the two companies appeal to differing demographics. The following chart provides an overview of the income profiles of each retailers’ customers.
Business insider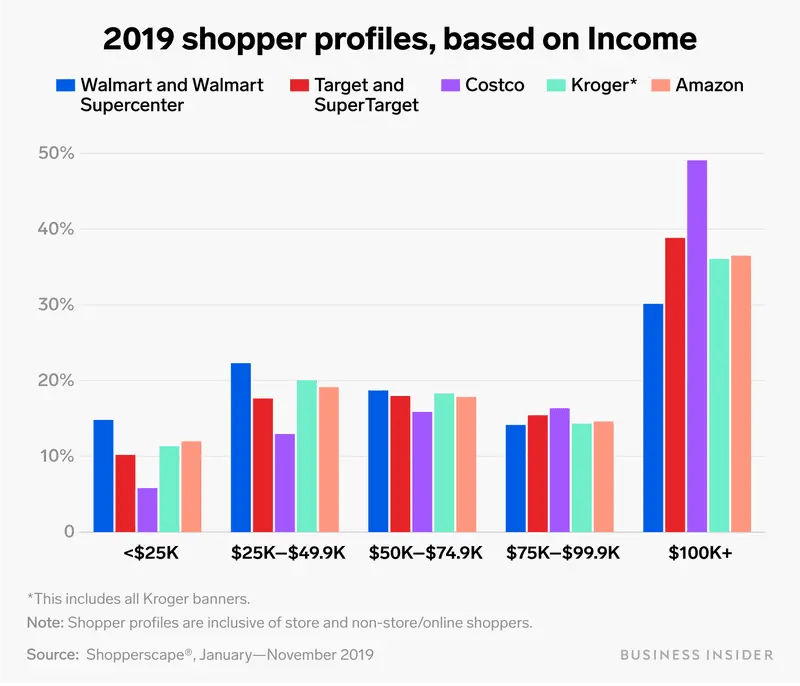
Note nearly half of Costco members have an income level of $100,000 plus, while over 60% of Target’s customers have annual incomes below $100,000. While consumers across all socio-economic groups are affected by macroeconomic factors, those with higher incomes will fare better, as will the businesses they frequent.
While conducting my due diligence survey of the two companies, I was stunned by the following fact: analysts place a great deal of weight on Costco’s cash conversion cycle. For the uninitiated, a cash conversion cycle refers to the number of days needed to convert cash invested in goods into sales. A shorter time between the purchase of stock and the sales of goods means less money is tied up in inventory.
Costco’s cash conversion cycle number is currently negative, an impressive but somewhat baffling metric. How can a company sell merchandise before it arrives on the shelves? The answer to that riddle lies in the fact that most of Costco’s profits stem from membership fees. While membership fees constitute 2% of total sales, they provide 77% of the company’s bottom line.
Now recall that Target is grappling with excess inventory to the extent that management is resorting to price markdowns while acquiring additional warehouse space.
Another area of stark contrast between the two retailers lies in the number of items each stocks. Costco has less than 4,000 SKUs, while Target carries at least 75,000 SKUs. This provides Costco with a great deal of leverage with vendors. In turn, Costco passes savings along to customers in the form of lower pricing. The average item sold at Costco is marked up by 11%.
In 2021, COST recorded over $1,600 in sales per square foot. By contrast, TGT posted approximately $430 per square foot of sales at the end of fiscal 2021. Of course, some of that difference can be attributed to the fact that Costco’s sales lean much more towards groceries.
This shows up in the gap in the two retailers operating margins: Costco’s is below 4% while Target’s operating margin was 8% in FY 2021.
In terms of private brand sales, the two retailers are fairly well matched. In FY 2021, Target’s private brands (management opts for the term “owned brand”) constituted nearly 29% of company sales. Kirkland, Costco’s private label, is the largest consumer packaged brand in the US. Kirkland brands are priced 15% to 20% below national brands and makeup 31% of Costco’s sales.
Where Target excels is in its ecommerce business. In FY 2022, 18.9% of the company’s total revenues were generated from digital purchases. Over the last two years, Target increased its revenues by $28 billion. Nearly half that sum, $13 billion, was the result of ecommerce sales. Additionally, over 95% of Target’s sales are fulfilled by stores, resulting in faster fulfillment times and reduced shipping costs.
TGT And COST Stock Key Metrics
TGT currently trades for $142.38 per share. The average twelve-month price target of the 24 analysts rating the company is $193.04. The average price target of the 22 analysts that rated the stock following the last earnings report is $185.50.
TGT owns roughly 80% of its stores. Another 8% of Target’s locations are owned buildings on leased ground. Target’s credit ratings are investment grade and in the single -A range.
Target’s forward P/E of 16.61X is near its 5-year average P/E of 16.95x. The company’s 5-year PEG ratio, provided by Seeking Alpha, is 1.04x. However, Yahoo calculates the 5-year PEG at 2.21X.
Target’s current yield is 3.06%. The payout ratio is a bit over 28%, and the 5-year dividend growth rate is 8.45%.
Costco currently trades for $485.76 per share. The average 12-month price target of the analysts rating the stock is $582.88. The average price target of the 12 analysts that rated the stock following the last earnings report is $611.75.
Costco’s 5-year PEG is 3.17x, just below the company’s average PEG ratio over the last five years. The forward P/E is 36.66x, a bit over three points higher than the stock’s average P/E ratio over the last five years.
At the end of FY21, COST owned the land and buildings for just over 80% of its warehouses. Most of the remaining stores were owned but were on leased land.
Costco has $12.3 billion in cash and investments as opposed to approximately $6.7 billion in long-term debt. The firm holds a solid investment grade rating from credit agencies.
Costco has a current yield of 0.75%. The payout ratio is 25.49%, and the 5-year dividend growth rate is a hair over 12%. During the last earnings call, the CFO stated that management is considering paying a special dividend.
Target Vs Costco: Where Your Investment Profile Might Steer You
I will opine that differing circumstances among investors often result in a rational preference for one investment over another. This can hold true for those considering TGT and COST.
For example, older investors, especially those seeking an income stream derived from dividends, often opt for tickers with higher yields. Costco has a meager yield (0.74%), and even with the current robust dividend growth rate, it will take over a decade for Costco’s yield on cost to match Target’s current yield. Consequently, a buy and hold DGI investor might steer clear of COST.
However, for investors with a time frame that extends over several decades, I see COST as an exceptional investment, provided the shares trade with a margin of safety.
With a yield a bit above 3%, and a 5-year dividend growth rate above 8%, Target meets the criteria of most investors seeking a stream of income from dividends. Even so, I question whether the company checks every box for those seeking top-notch investments.
Unlike Costco, I do not believe Target possesses a moat. While the company is very well managed at this juncture, TGT has no competitive advantage over top-tier rivals. To the contrary, Walmart (WMT) and Costco, for example, have leverage over vendors that TGT cannot equal.
Consequently, should poor management take the reins of the company for an extended time, I believe Target could transform into the next JCPenney or Sears.
I am by no means predicting Target will fail; however, for those that doubt that the company can falter, look no further than the stock’s share price history. There have been a number of periods over the last thirty years in which the stock experienced extended periods of poor performance.
So to sum this section up, Costco represents a much safer investment than Target. The only advantage TGT holds is that its current yield is substantially higher.
Even so, when the shares offer a reasonable margin of safety, and provided that an investor does not require an above-average yield, I consider COST the superior investment, especially for those with long-term time frames.
Costco And Target: Buy, Sell Or Hold?
Despite the recent pummeling the stock took, Target stands near the front of the pack among retailers. The development of the company’s ecommerce platform was a tour de force that will serve investors well. The missteps that led to the recent sell-off are transitory in nature.
Target also possesses a wide array of growing private brands, a firm financial foundation, and a safe dividend with an above-average yield. However, as outlined in this article, and despite its many strengths, I do not believe Target possesses a moat. Therefore, I cannot rate TGT as among the top tier of potential investments.
Costco, on the other hand, is a retailer with manifest strengths. The low-frills warehouses, a very limited number of SKUs that provide leverage with vendors, a strong financial foundation, and growth opportunities at home and abroad, all translate into an investment with great potential.
Unfortunately, I do not believe either stock is trading at a valuation that provides a margin of safety. Furthermore, with a recession on the horizon, and inflation hamstringing consumers, I predict a better share price for both stocks may be found in the not-too-distant future.
Consequently, I rate TGT and COST as HOLDS.
However, I think it is evident that Costco will navigate a period of extended inflation and/or a recession with greater ease than Target.
Be the first to comment