

Dilok Klaisataporn
By Levi at StockWaves, produced with Avi Gilburt.
We have a specific setup in Target Corporation (NYSE:TGT) with a few different positive catalysts present. Let’s talk about these catalysts and what effect they would have on the stock price. As well, once this setup begins to go our way, what system do we have in place to protect profits once garnered? Here we go…
Potential Catalyst With Crude Oil
The setup begins with one important data point from our lead fundamental analyst, Lyn Alden. In a discussion in our StockWaves trading room, she recently made this comment regarding TGT:
Seems plausible (an upswing in TGT stock) from a fundamentals perspective. It’s a bit of an anti-oil play (their profit margins would prefer low energy prices), so to the extent that I would go long TGT for the long run, I’d like to pair it with some energy names for diversification.
Here is the FastGraph chart that she shared with our membership at that time:
FastGraphs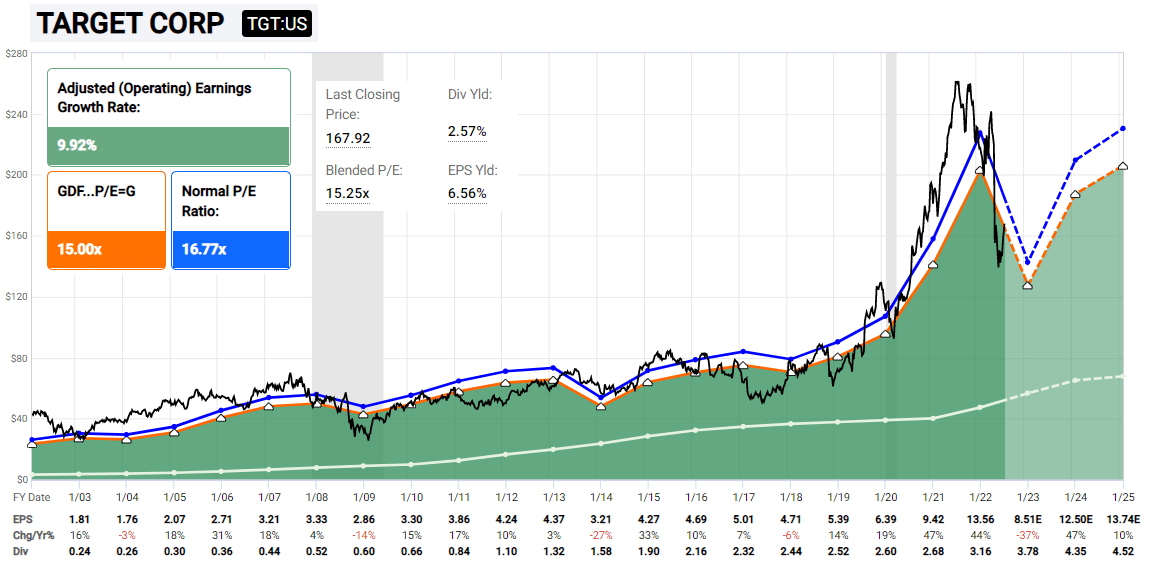
Next, let’s briefly discuss our current view on where crude oil and oil service stocks are headed in the near term. Please note that we will elaborate this point in much deeper analysis later this week with an article on Exxon Mobil (XOM). But suffice it to say that we are projecting both crude oil and oil service stocks lower into the November – December time frame. As well, we have key price levels that will help us maintain that perspective or remodel our expectations. However, much more on that later.
Profitability Advantage (catalyst)
Let’s briefly note how the Seeking Alpha profitability grade helps us shape expectations given this potential catalyst.
Seeking Alpha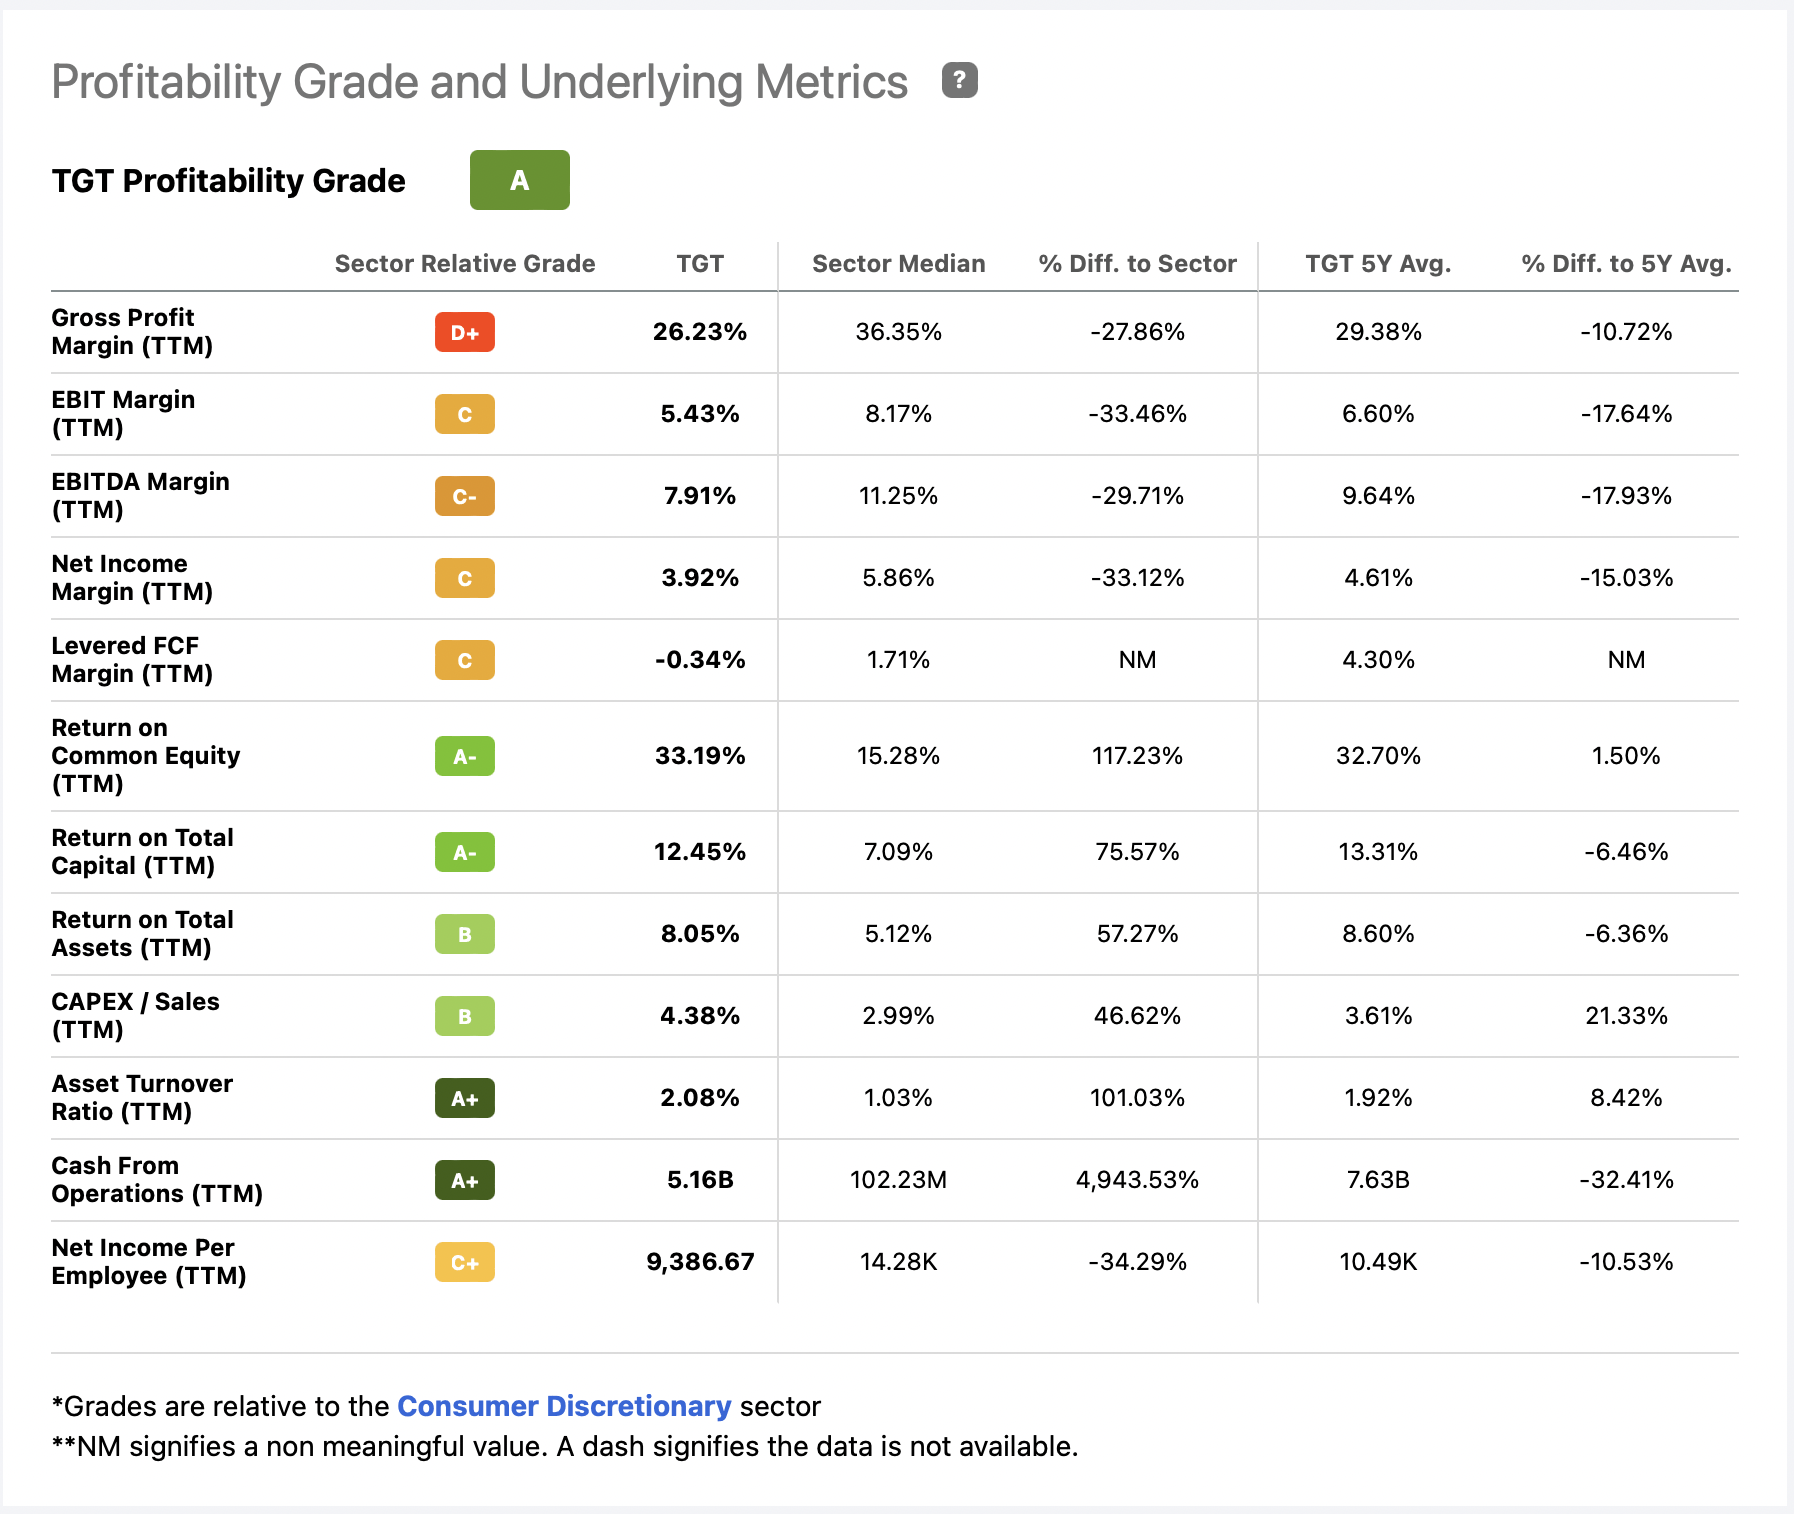
Simply stated, with lower oil prices comes even greater profitability for TGT and gives them an advantage over their peers.
The Technical Setup
It is with these points in mind that we now align our structure of price with what may light the fuse for a path to a higher high in the near term. We are viewing TGT as coming into an important swing low this week.
TradingView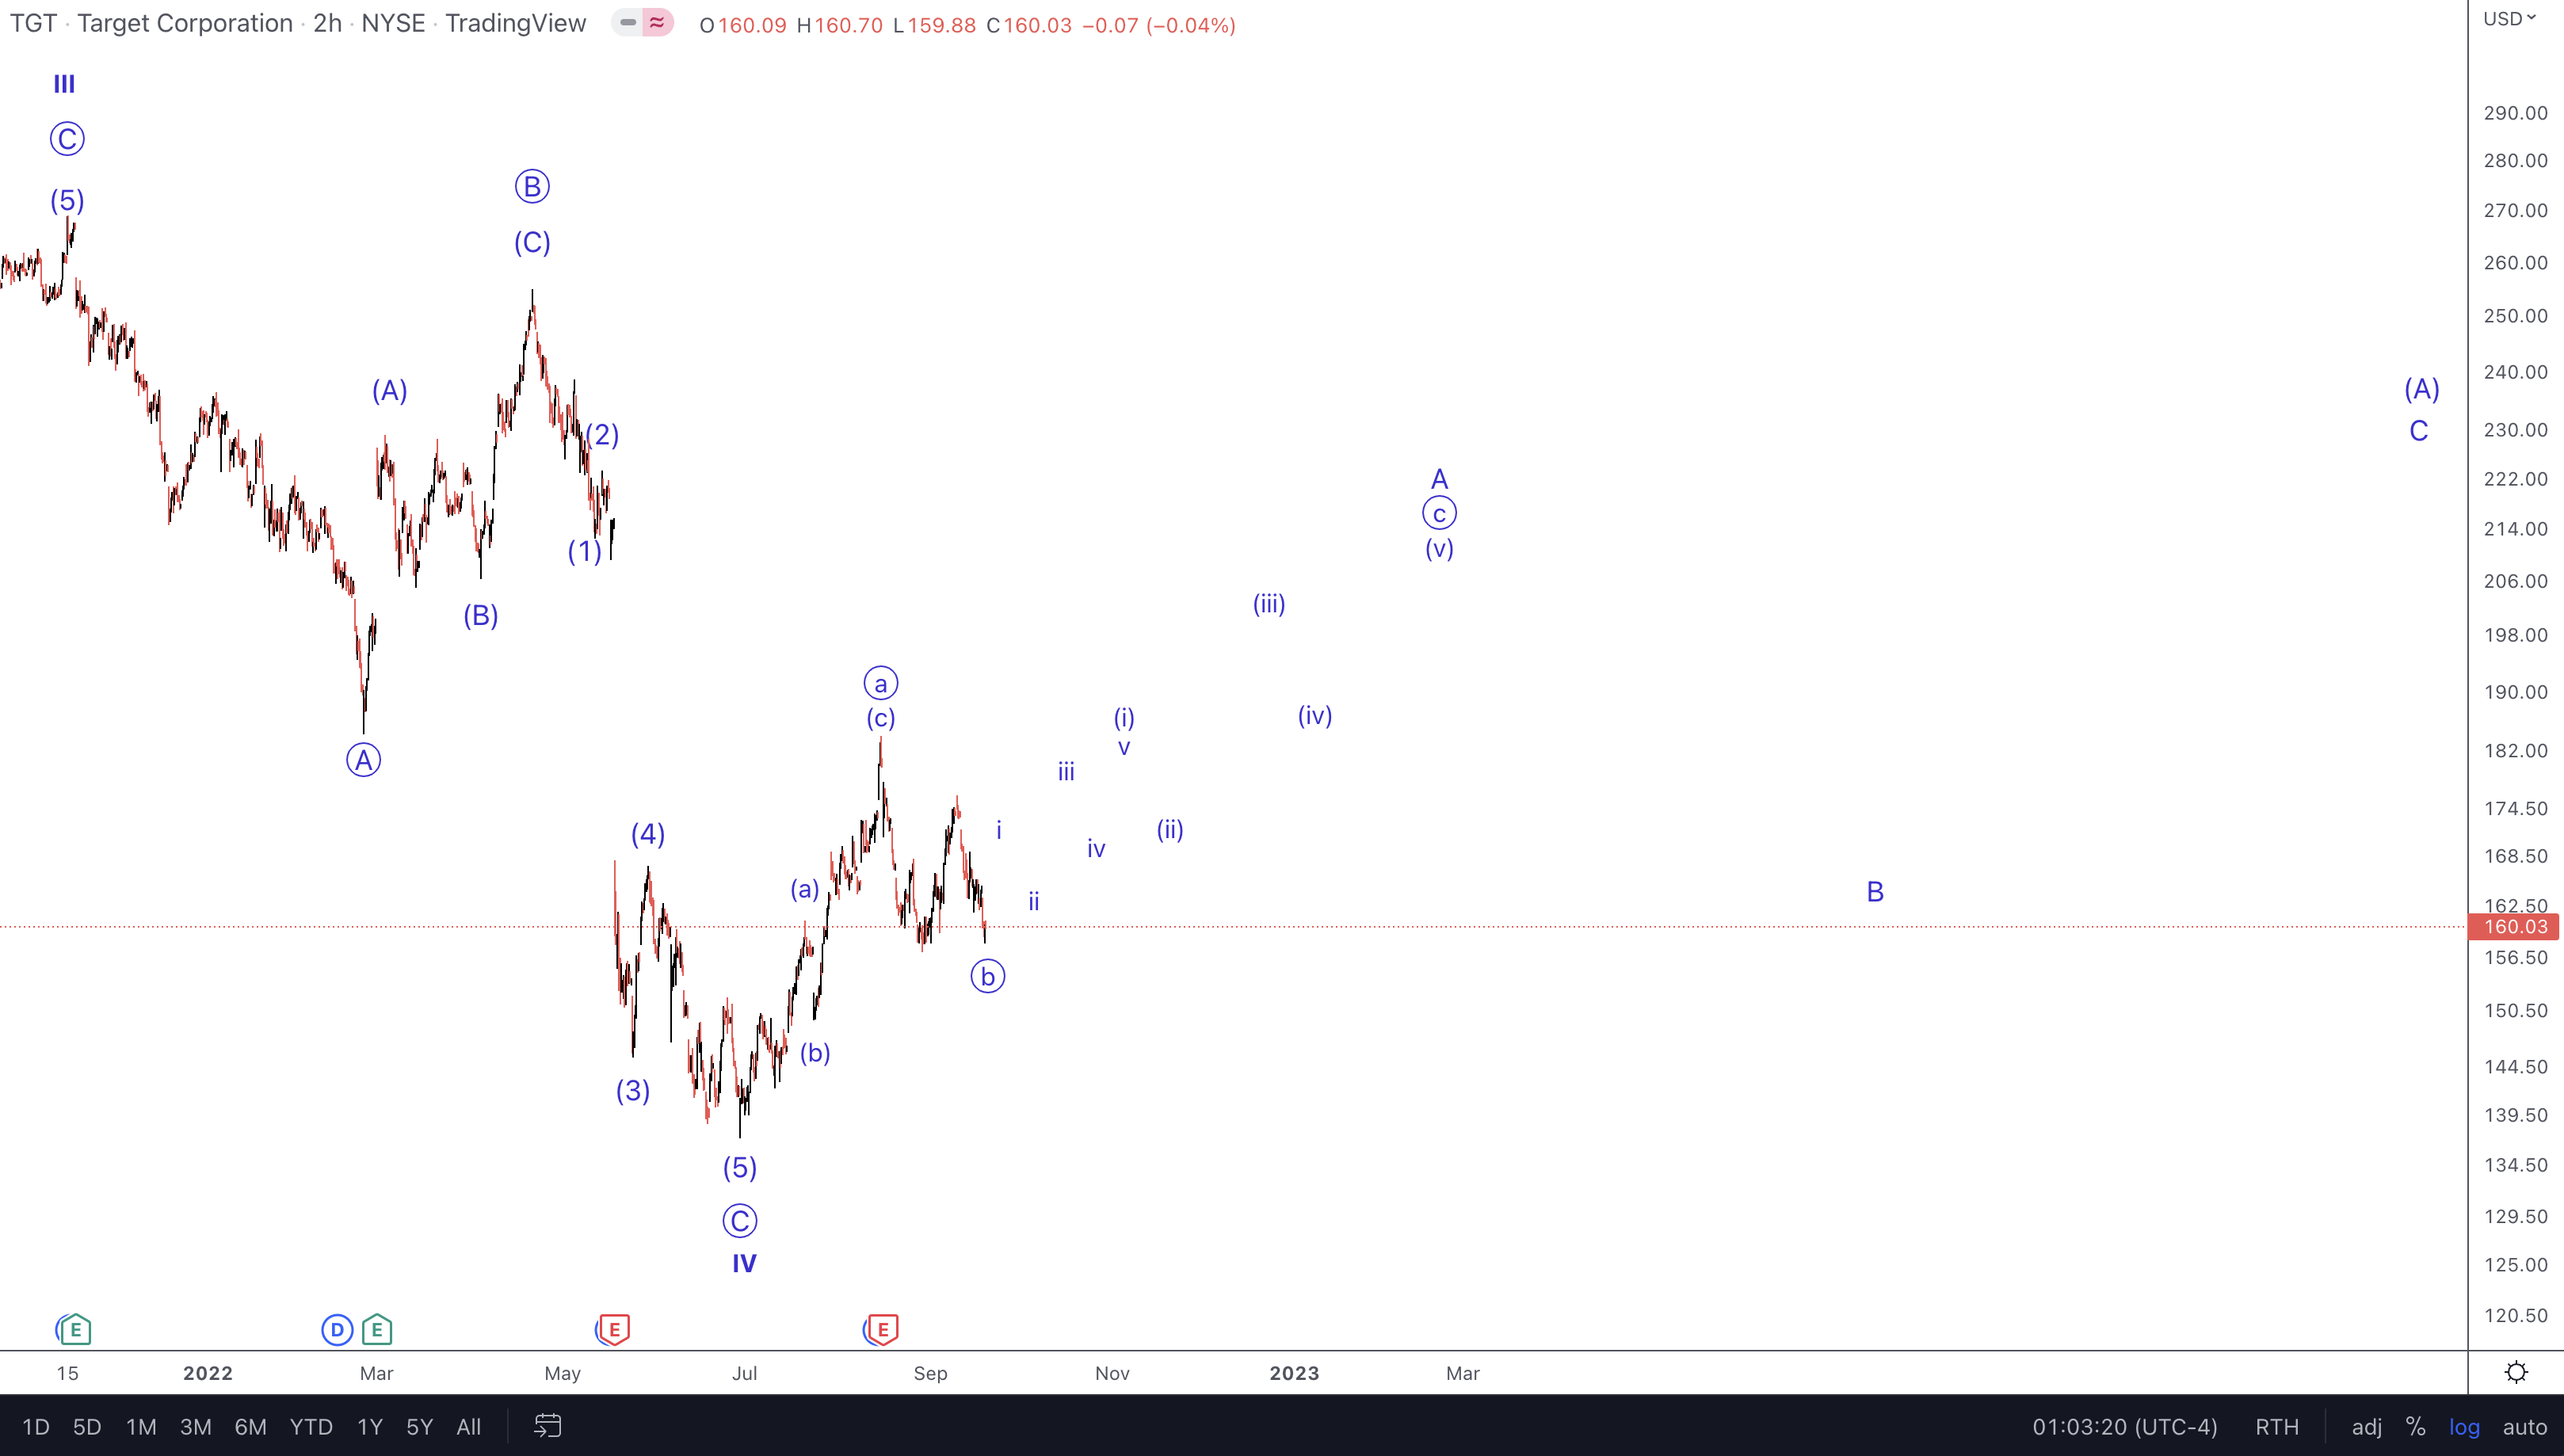
Here is one of the keys to success inside of our methodology, Elliott Wave with Fibonacci Pinball. The most straightforward structure to track and trade is an impulse, whether that be a rally or a decline matters not. Those familiar with our work know that this means a 5 wave structure.
As well, since markets are fractal in nature, they express their structures with self-similarity at all degrees. That means that the 5 wave structure we are anticipating next in TGT will start with a smaller 5 wave advance from the low we are counting as a circle ‘b’ wave of a larger A wave rally.
In plain English, this assumes that we will see a swing low in price followed by a rally that forms 5 waves. You can see this illustrated on the attached chart. That initial 5 waves should be followed by a 3 wave correction. It is at that point that we can properly project the ultimate target (no pun intended) for this larger 5 waves inside the circle ‘c’ of A.
Where might this setup be wrong?
In the near term, a move below $147 would be a warning flag that this may have even lower to go. And, a move below $137 would reset our bullish expectations until a new structure forms with specific risk vs reward as we have now.
Conclusion
Using our comprehensive methodology of the macroeconomic environment paired with stock-specific fundamental analysis, this is a favorable setup with substantial upside. Our technical analysis is providing us with a structure to track and trade going forward.
I would like to take this opportunity to remind you that we provide our perspective by ranking probabilistic market movements based upon the structure of the market price action. And if we maintain a certain primary perspective as to how the market will move next, and the market breaks that pattern, it clearly tells us that we were wrong in our initial assessment. But here’s the most important part of the analysis: We also provide you with an alternative perspective at the same time we provide you with our primary expectation, and let you know when to adopt that alternative perspective before it happens.
There are many ways to analyze and track stocks and the market they form. Some are more consistent than others. For us, this method has proved the most reliable and keeps us on the right side of the trade much more often than not. Nothing is perfect in this world, but for those looking to open their eyes to a new universe of trading and investing, why not consider studying this further? It may just be one of the most illuminating projects you undertake.
STOCK WAVES: Where fundamental analysis meets technical analysis for highest-probability investment opportunities!
“Thus far, the best stock-picking service I’ve seen–and I’ve been doing this for 35+ years! (Gunfighter)
“Stock Waves has produced more gains in the past month(+) than many sites do in years or decades.” (Keto)
“The amount of trades I’ve been able to take resulting in 100%+ returns is nothing short of amazing. If you do not have Stockwaves, you are only doing yourself a disservice.” (dgriff617)
Click here for a FREE TRIAL.
Be the first to comment