

kynny/iStock via Getty Images
Taiwan Semiconductor Manufacturing Corporation (TSMC) (NYSE:TSM) stock (-9.5% 1-yr) has underperformed peers such as United Microelectronics (UMC) (+5.6%), as well as its key customers, including Apple (AAPL) (+43.9%), which is its largest customer, as well as Advanced Micro Devices (AMD) (+53.5%), Nvidia (NVDA) (+116.2%), and Marvell Technology (MRVL) (+55.4%).
TSMC is the dominant foundry in the world, which held a 57% market share of a $92 billion industry in 2021, but that is down from a 59% share in 2020. Samsung Electronics (OTC:SSNLF) is a distant second with a 7% share, along with UMC and GlobalFoundries, according to The Information Network’s report entitled “Hot ICs: A Market Analysis of Artificial Intelligence (“AI”), 5G, Automotive, and Memory Chips.”
TSMC vs Samsung vs Intel in Next 5 Years
Capex
Table 1 shows Capex spend by leading foundries between 2019 and 2023. Capex spend should increase 44% in 2022, which follows double-digit YoY growth since 2019.
Capex spend is a combination of building and fab equipment in roughly a 50:50 ratio. Samsung’s capex is for foundry only, and does not include DRAM or NAND capex. I include Intel (INTC), which is starting its foundry business and touts Qualcomm (QCOM) and Amazon (AMZN) as its customers.
The Information Network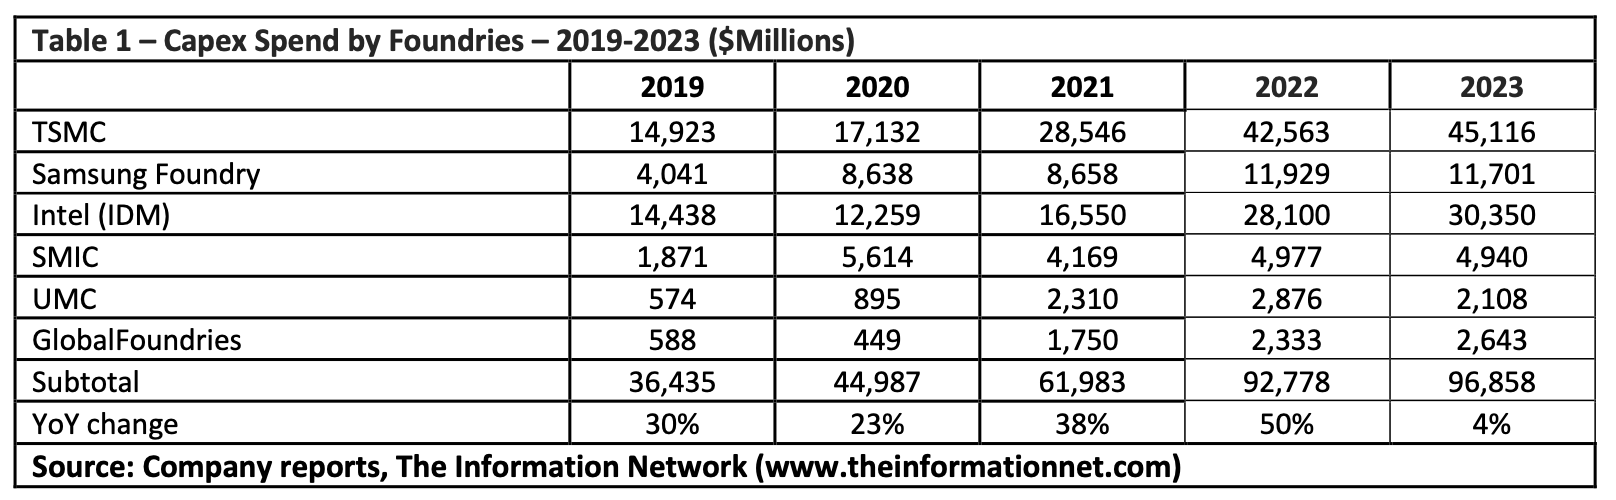
In 2021, TSMC was the biggest spender, with capex at $28.5 billion, an increase of 91.3% from 2020. Samsung capex increased 114.3% in 2021. In 2021, Intel increased capex just 14.6%.
Nevertheless, between 2020 and 2023, TSMC’s capex spend is higher than competitors Intel and Samsung. This increased spend will result in increased fab capacity and increased chip output.
Fab Construction
Much of the strong growth in 2022 will be from fabs that started construction in 2021-2022, largely because of the “Facilitating American-Built Semiconductors (FABS) Act” aims to provide tax-based incentives towards the construction, expansion, or modernization of semiconductor fabrication plants (or ‘fabs’) and processing equipment in the United States.
FABS offers private firms a 25% tax credit towards the purchase, construction, manufacture, or utilization of a semiconductor manufacturing facility or related equipment that will be used for the design or processing of chips. Before the facility or equipment is placed into service, firms or organizations can elect to receive the tax credit as a direct payment.
The Information Network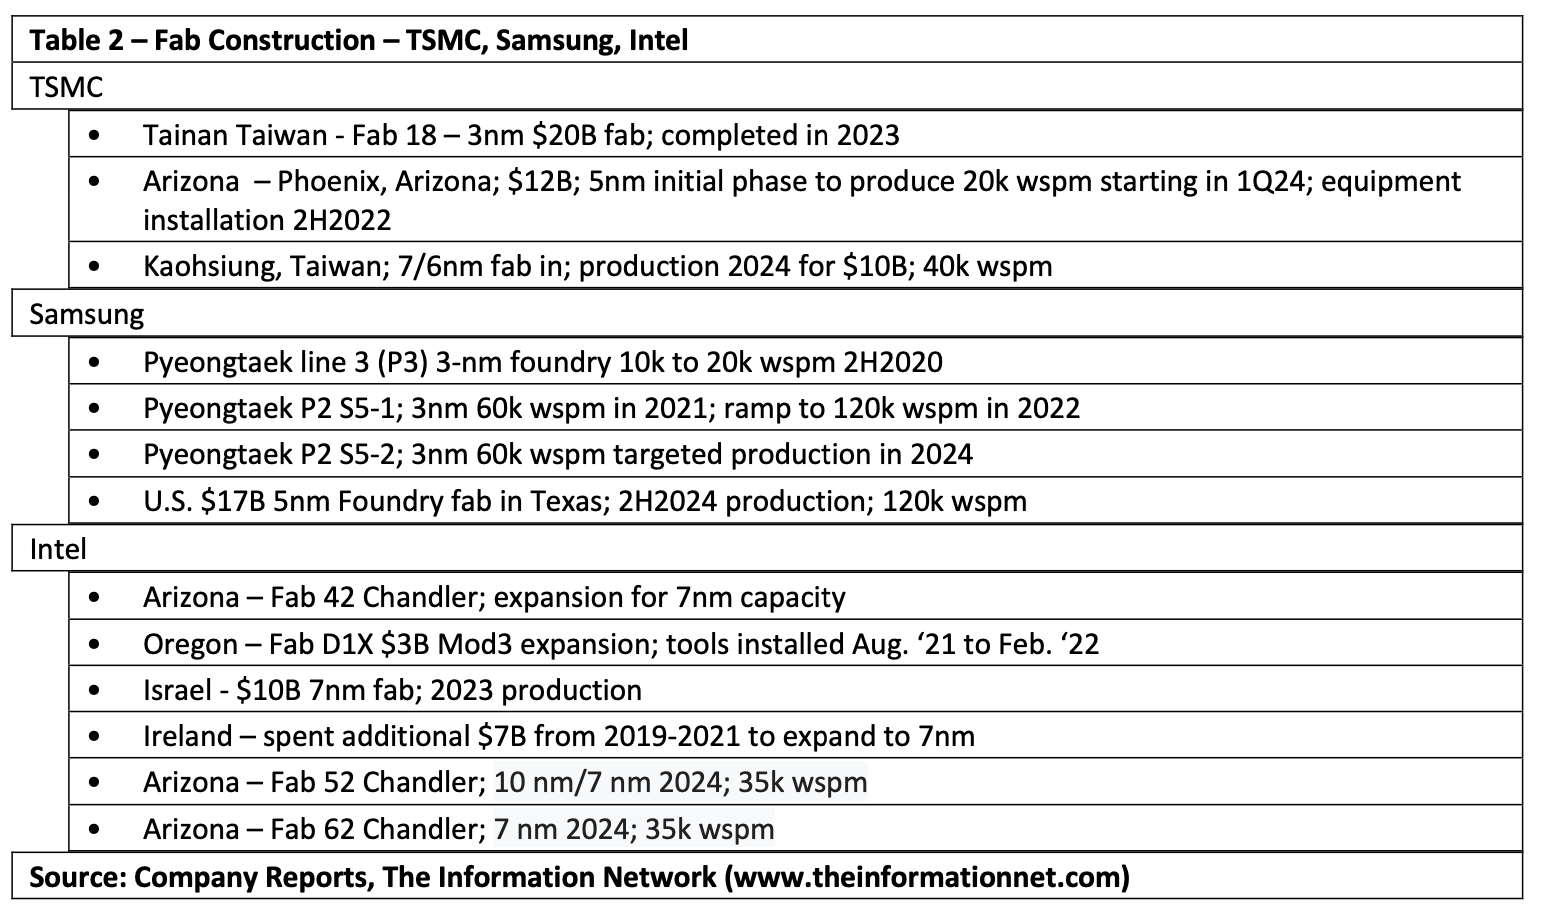
Node Transitions
Table 3 shows the process roadmaps for the three foundries.
First introduced by the major foundries around the 2020 timeframe, the 5-nm process technology is characterized by extensive use of EUV for the critical dimensions, along with quad patterning for the fins and double patterning for the rest of the metal stack. The Intel 7 nm process is comparable to the foundry 5-nanometer node.
TSMC will mass-produce 3nm process in the fourth quarter of 2022, and plans to introduce GAA (Gate All Around) technology when it enters the 2nm process and start mass production of 2nm process chips in 2024.
The Information Network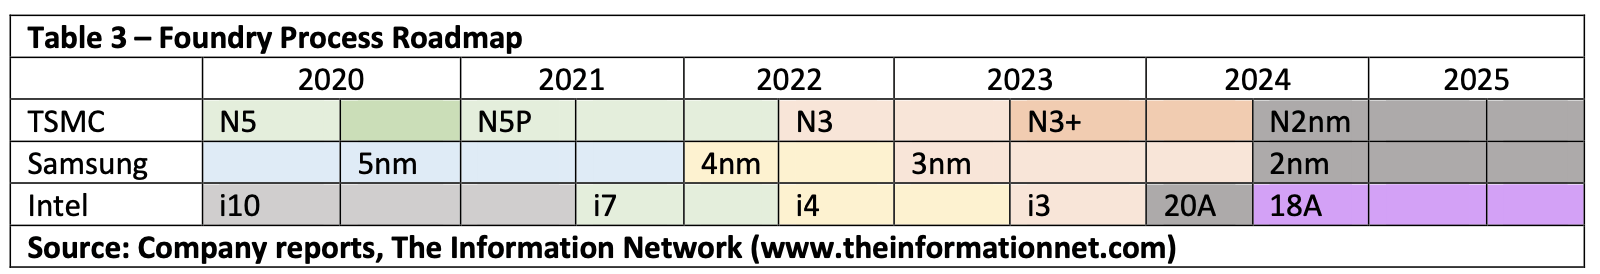
Samsung’s 3nm process uses GAA design with MBCFET (Multi-Bridge-Channel FET) for up to 35% decrease in package area, 30% higher performance, or 50% lower power consumption compared to its 5nm EUV process.
Samsung revealed earlier that in the first half of 2022 it will launch the first generation of 3nm 3GAE technology (3nm gate-all-around early).
Intel stayed in the 14nm process for seven years, and it was not until 2019 that they really mass-produced 10nm, which was equivalent to the number of transistors in TSMC 7nm process. To catch up to TSMC and Samsung, Intel plans an aggressive roadmap of 4 nodes in three years.
Investor Takeaway: TSM Stock Is a Strong Buy
TSMC and Samsung are leading the <7nm node production primarily because of the late start of Intel. In 5 years, that will change, and Intel will be a strong competitor, according to Table 5. TSMC will still be the leading supplier, providing it is not involved with any geopolitical issues with Mainland China.
The Information Network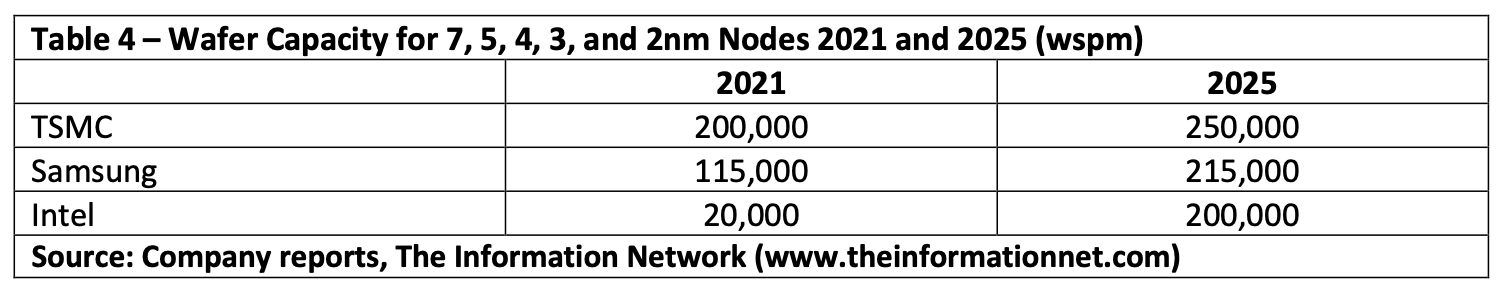
Chart 1 shows that TSMC’s stock has been below its 200-day moving average since the middle of Q1 2022.
YCharts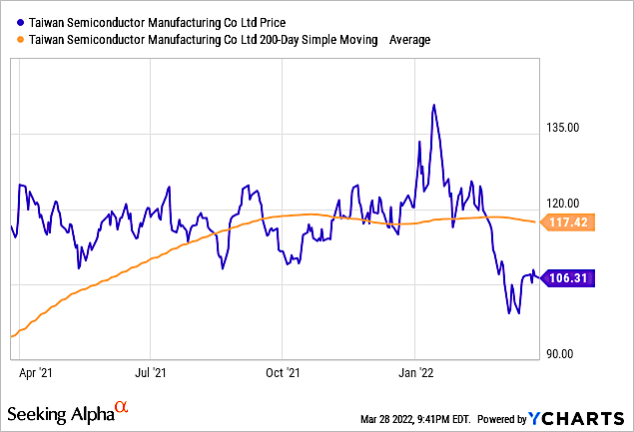
Chart 1
Chart 2 shows Gross Profit Margins for TSM, SSNLF, and INTC. Keep in mind that the TSM values are for its total business, with is a pure-play foundry. Intel’s GPM are currently for its internal business, as it’s foundry business is in its infancy. SSNLF’s GPM are for total business, but that business is not only foundry, but memory, displays, smartphones, and consumer products.
YCharts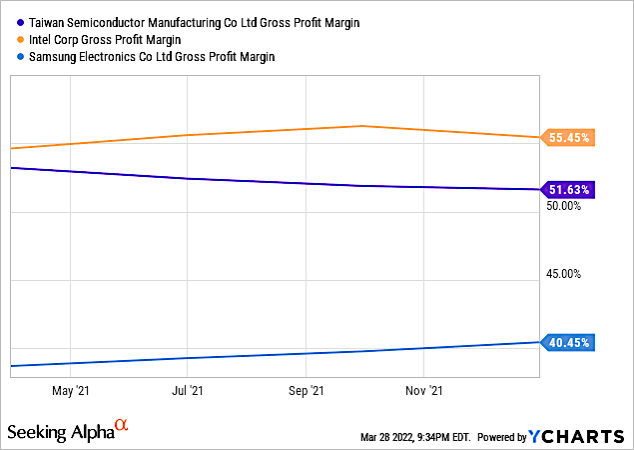
Chart 2
Chart 3 shows various ratings for the three companies. TSM has a Quant Rating of a Strong Buy vs a hold for INTC.
YCharts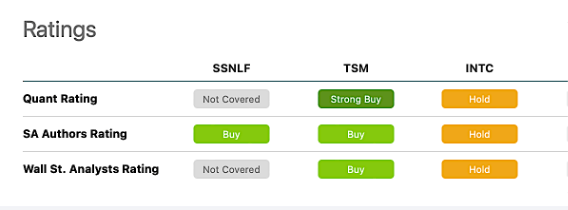
Chart 3
Chart 4 hones in on Seeking Alpha’s Quant Factor Grades, with TSMC the obvious choice versus Intel. Samsung is not covered.
YCharts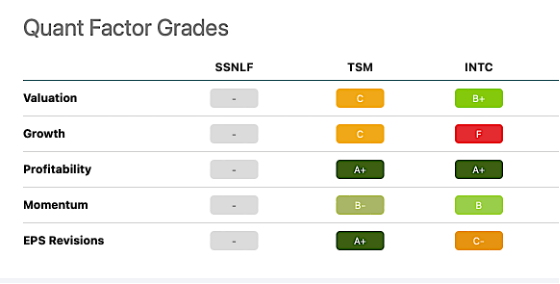
Chart 4
TSMC is a strong buy in my opinion. It is the dominant foundry with a market share historically above 50%, and also dominates wafer capacity at the <7nm node.
Be the first to comment