

Swiss Franc, CHF, CHF/JPY, EUR/CHF, GBP/CHF – Talking Points
- CHF/JPY continues to decline from fresh yearly high, previous 2021 high eyed
- EUR/CHF downtrend remains intact, key pivot zone eyed for potential reversal
- GBP/CHF has potentially carved a bottom, previous support now resistance?
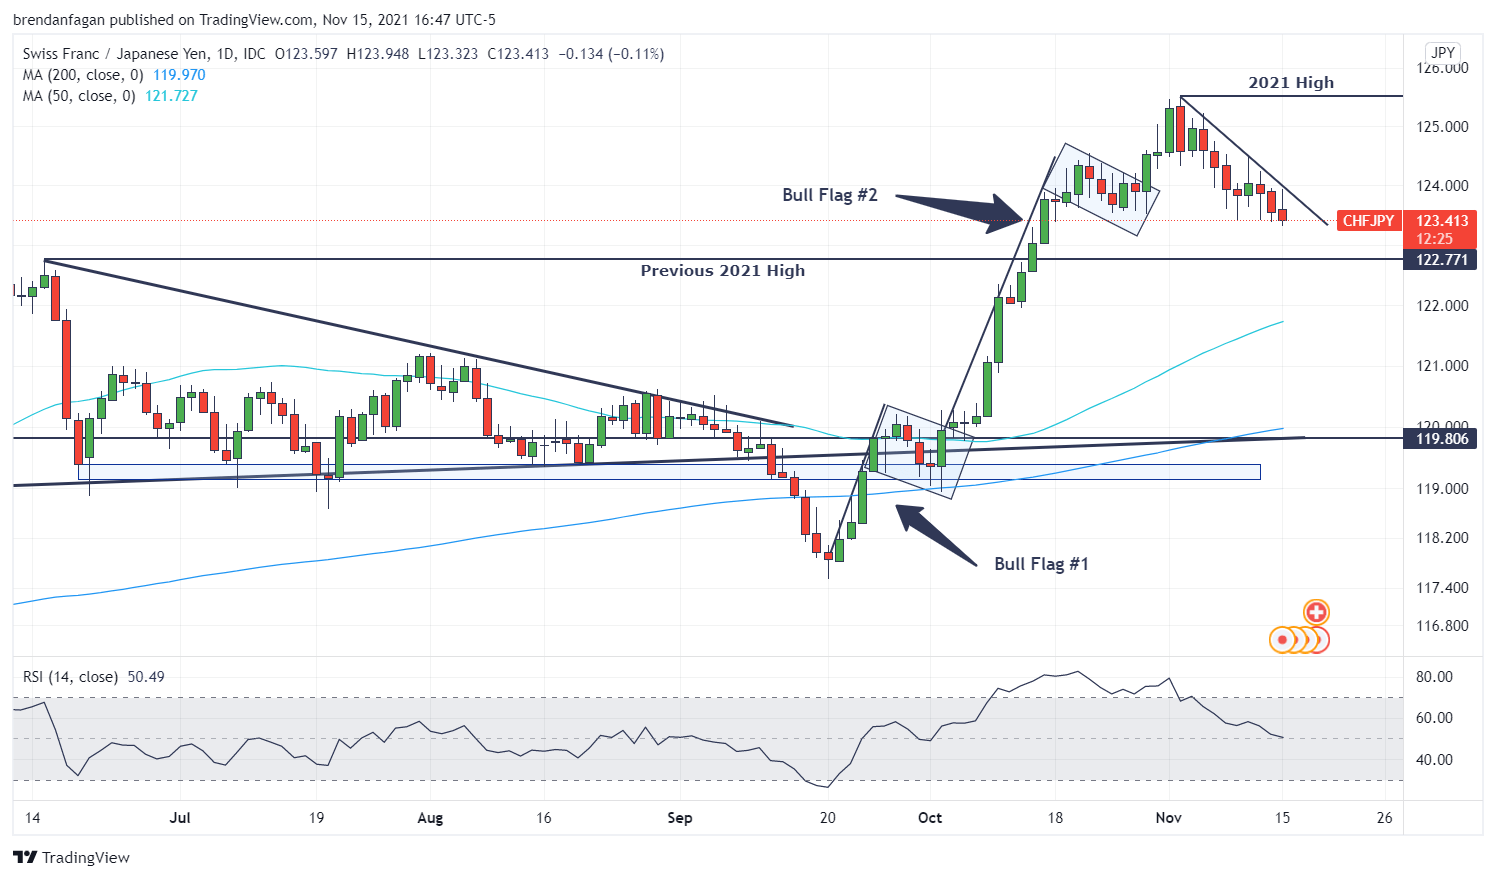
CHF/JPY Technical Analysis
After making a swift break higher to fresh yearly highs in the first few sessions of the month, CHF/JPY has since fallen onto the backfoot. A swift decline for the pair from overbought conditions has seen seven losing sessions out of the last eight. As mentioned, the pair’s robust melt higher saw the relative strength index (RSI) approach 80, indicating severely overbought conditions were present.
The move lower over the last couple of weeks has been constrained by overhead trendline resistance, which has guided price lower. Price may continue to guide lower to the previous yearly high of 122.771, a level which may act as a key pivot point. With sellers firmly in control of this cross, traders may look for a test of the 50-day moving average should the previous yearly high fail as support.
CHF/JPY Daily Chart
Chart created with TradingView
EUR/CHF Technical Analysis
EUR/CHF finds itself on the backfoot as well, with price failing to hold the 0.236 Fibonacci level at 1.064 as support. Despite gyrating price action to begin November, the trend lower has continued as the pair looks to test the upper bound of a key pivot zone from the 2020 lows. Price immediately reversed from these levels during two separate tests in March and May of last year. Should that replicate in the coming weeks, traders may eye a retest of the aforementioned 0.236 Fib level. A break lower through this key zone would see the cross trade to lows not seen since 2015.
EUR/CHF Daily Chart
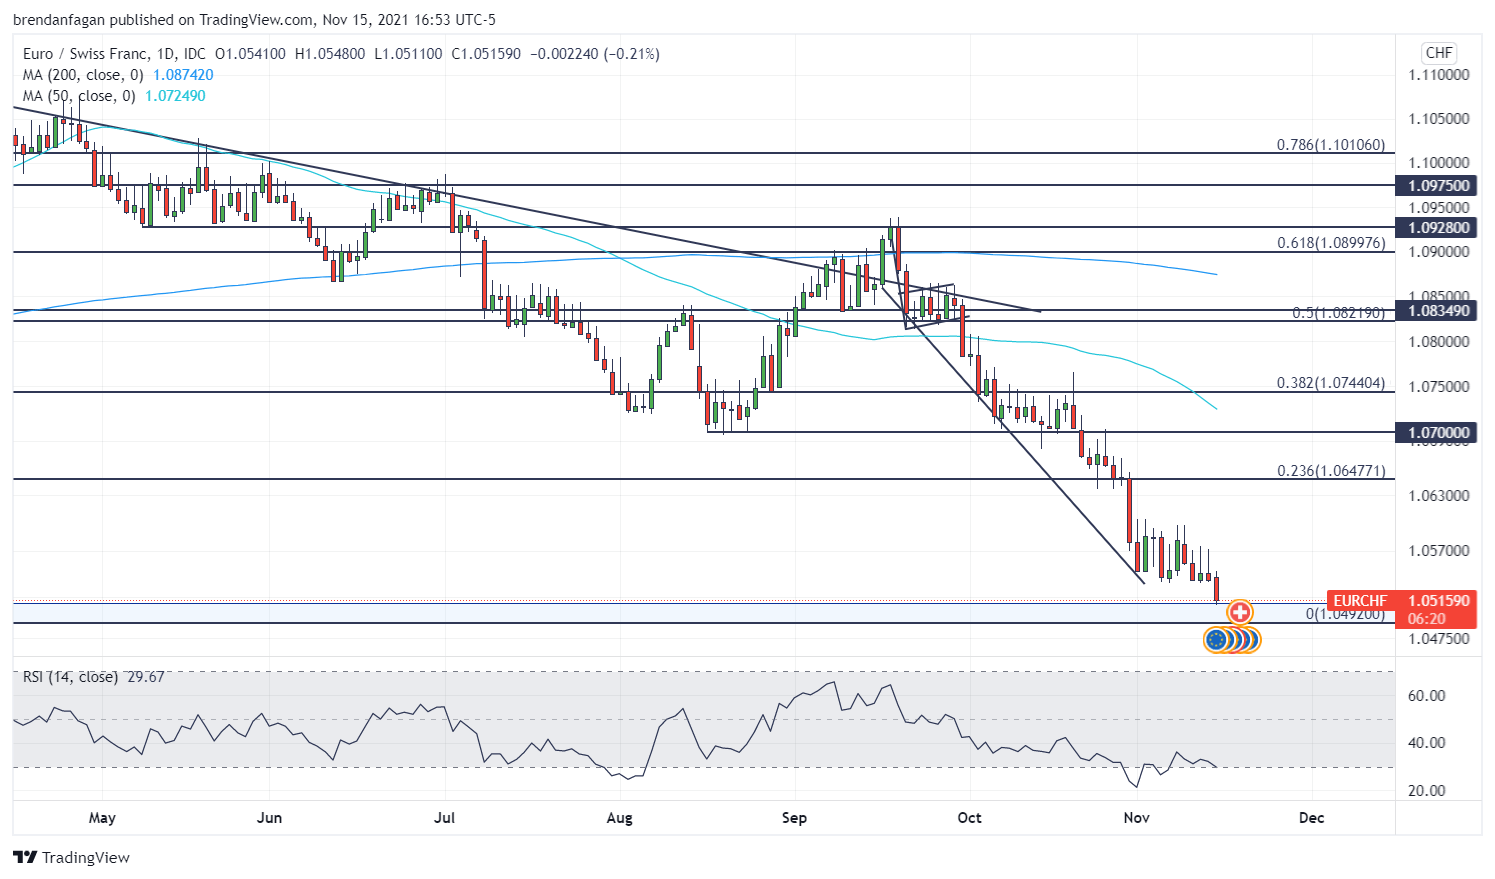
Chart created with TradingView
GBP/CHF Technical Analysis
GBP/CHF appears to have carved out a bottom above 1.2300 following a break lower from a bear flag. Confirmation of the bear flag saw the cross break the lower bound of a descending channel it had been carving out since early May. Sentiment was already bearish, as a Death Cross had formed in early October. With 1.2300 propping up price in the near-term, the cross may find resistance in the form of previous support, being the lower bound of the multi-month descending channel. A break back into the channel could see price retest 1.2500, but a failed breakout may bring 1.2300 back into play.
GBP/CHF Daily Chart
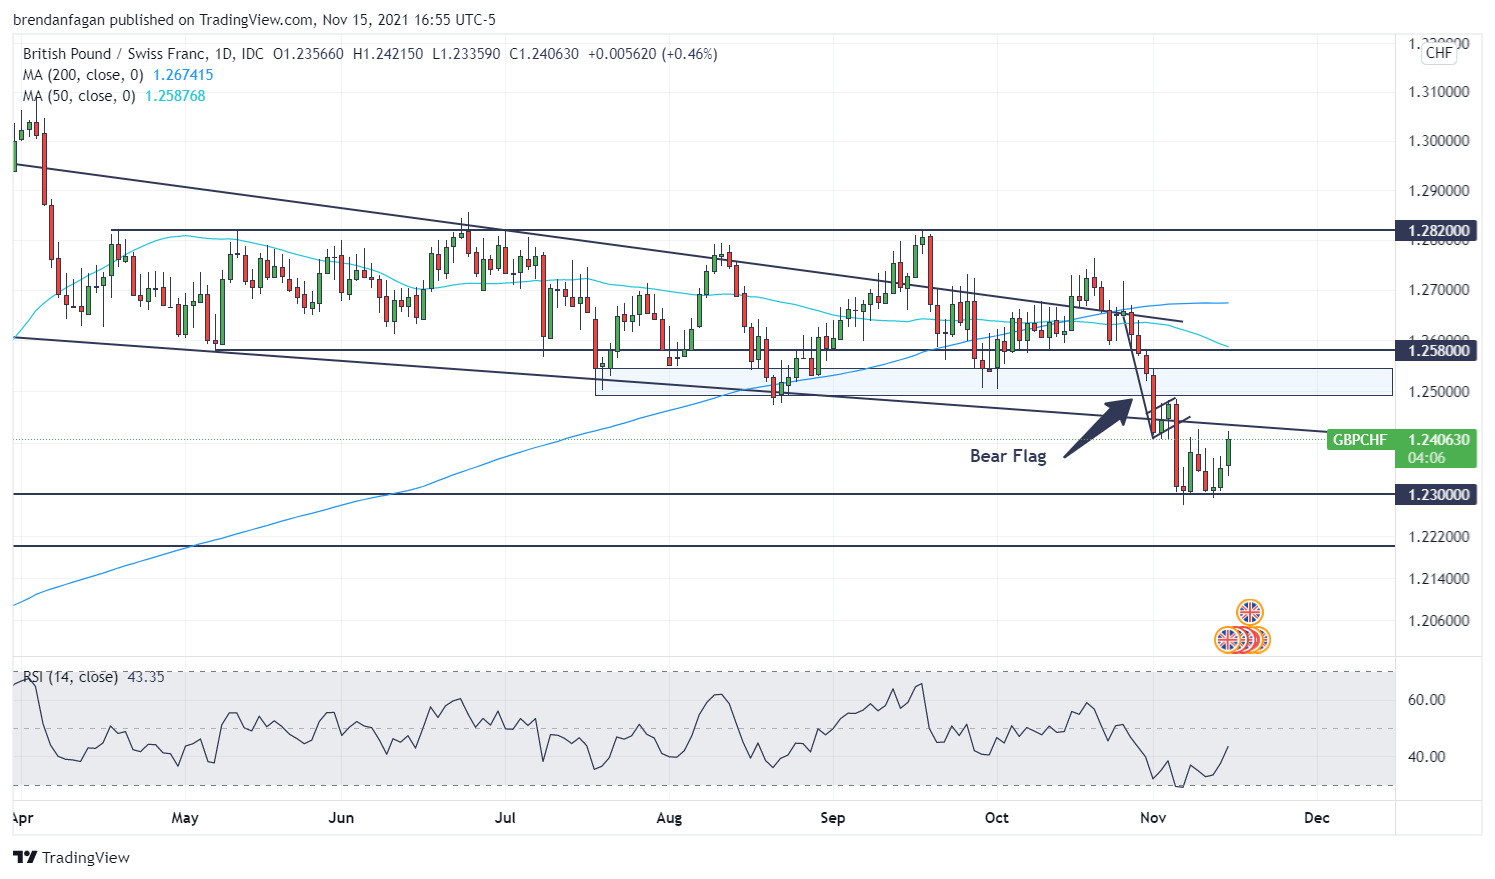
Chart created with TradingView
Resources for Forex Traders
Whether you are a new or experienced trader, we have several resources available to help you; indicator for tracking trader sentiment, quarterly trading forecasts, analytical and educational webinars held daily, trading guides to help you improve trading performance, and one specifically for those who are new to forex.
— Written by Brendan Fagan, Intern
To contact Brendan, use the comments section below or @BrendanFaganFX on Twitter
Be the first to comment