

Marina113/iStock via Getty Images
I recently wrote articles detailing why I think Suburban Propane (SPH) may be a defensive MLP to own in a challenging macro environment. One of SPH’s main competitors is Superior Plus Corp. (TSX:SPB:CA)(OTCPK:SUUIF). Does SPB also show the same attractive business profile?
While Superior Plus is in the same business as Suburban Propane, and shares many of the same business qualities that I find attractive, I have reservations about an investment in Superior Plus. The 6.4% dividend yield is attractive, but my main fear is that management will overpay for acquisitions. Also, with such a heavy debt load (3.7x leverage), the business does not have much margin of safety. Finally, I don’t like the capital structure with the convertible preferred shares that reap the upside (convertible), but are protected on the downside (cumulative dividends).
The Superior Plus Story
Superior Plus Corp. began its public history in 1996 as an Income Trust (“Superior Propane Income Trust”) to acquire and hold securities issued by Superior Propane Inc. and distribute to trust holders distributions from Superior Propane.
The actual business, Superior Propane, has been around since the 1950s and at the time of the income trust issuance, was the largest propane distributor in Canada with over 40% market share.
Income Trust, for those not familiar, was a corporate structure popular in Canada in the late 1990s to early 2000s. It was basically a tax avoidance structure where corporate income before tax was paid to investors and investors were responsible for paying income taxes. As many income trusts were held in tax-exempt accounts (such as registered retirement accounts), the federal treasury ended up losing out on billions in tax revenue.
The income trust party ended in 2006 when, faced with the possible conversion of Bell and Telus into income trusts (two of the country’s largest companies), the Canadian Federal government amended tax laws deeming income trust distributions to be taxable as regular dividends at both the investor and corporate level. Superior Plus converted into its current corporate structure in December 2008.
At the time of the conversion in 2008, Superior Plus also had a specialty chemicals business called ‘ERCO Worldwide’. However, the specialty chemicals business was recently sold to private equity in April of 2021 for $725 million in proceeds.
Today, Superior Plus is a business focused on consolidating the fragmented U.S. propane distribution market. It remains the number 1 distributor in Canada with 38% market share. In addition, it is the 4th largest propane distributor in the U.S., operating primarily in the Northeast (Figure 1).
Figure 1 – Business Overview (Superior Plus investor presentation)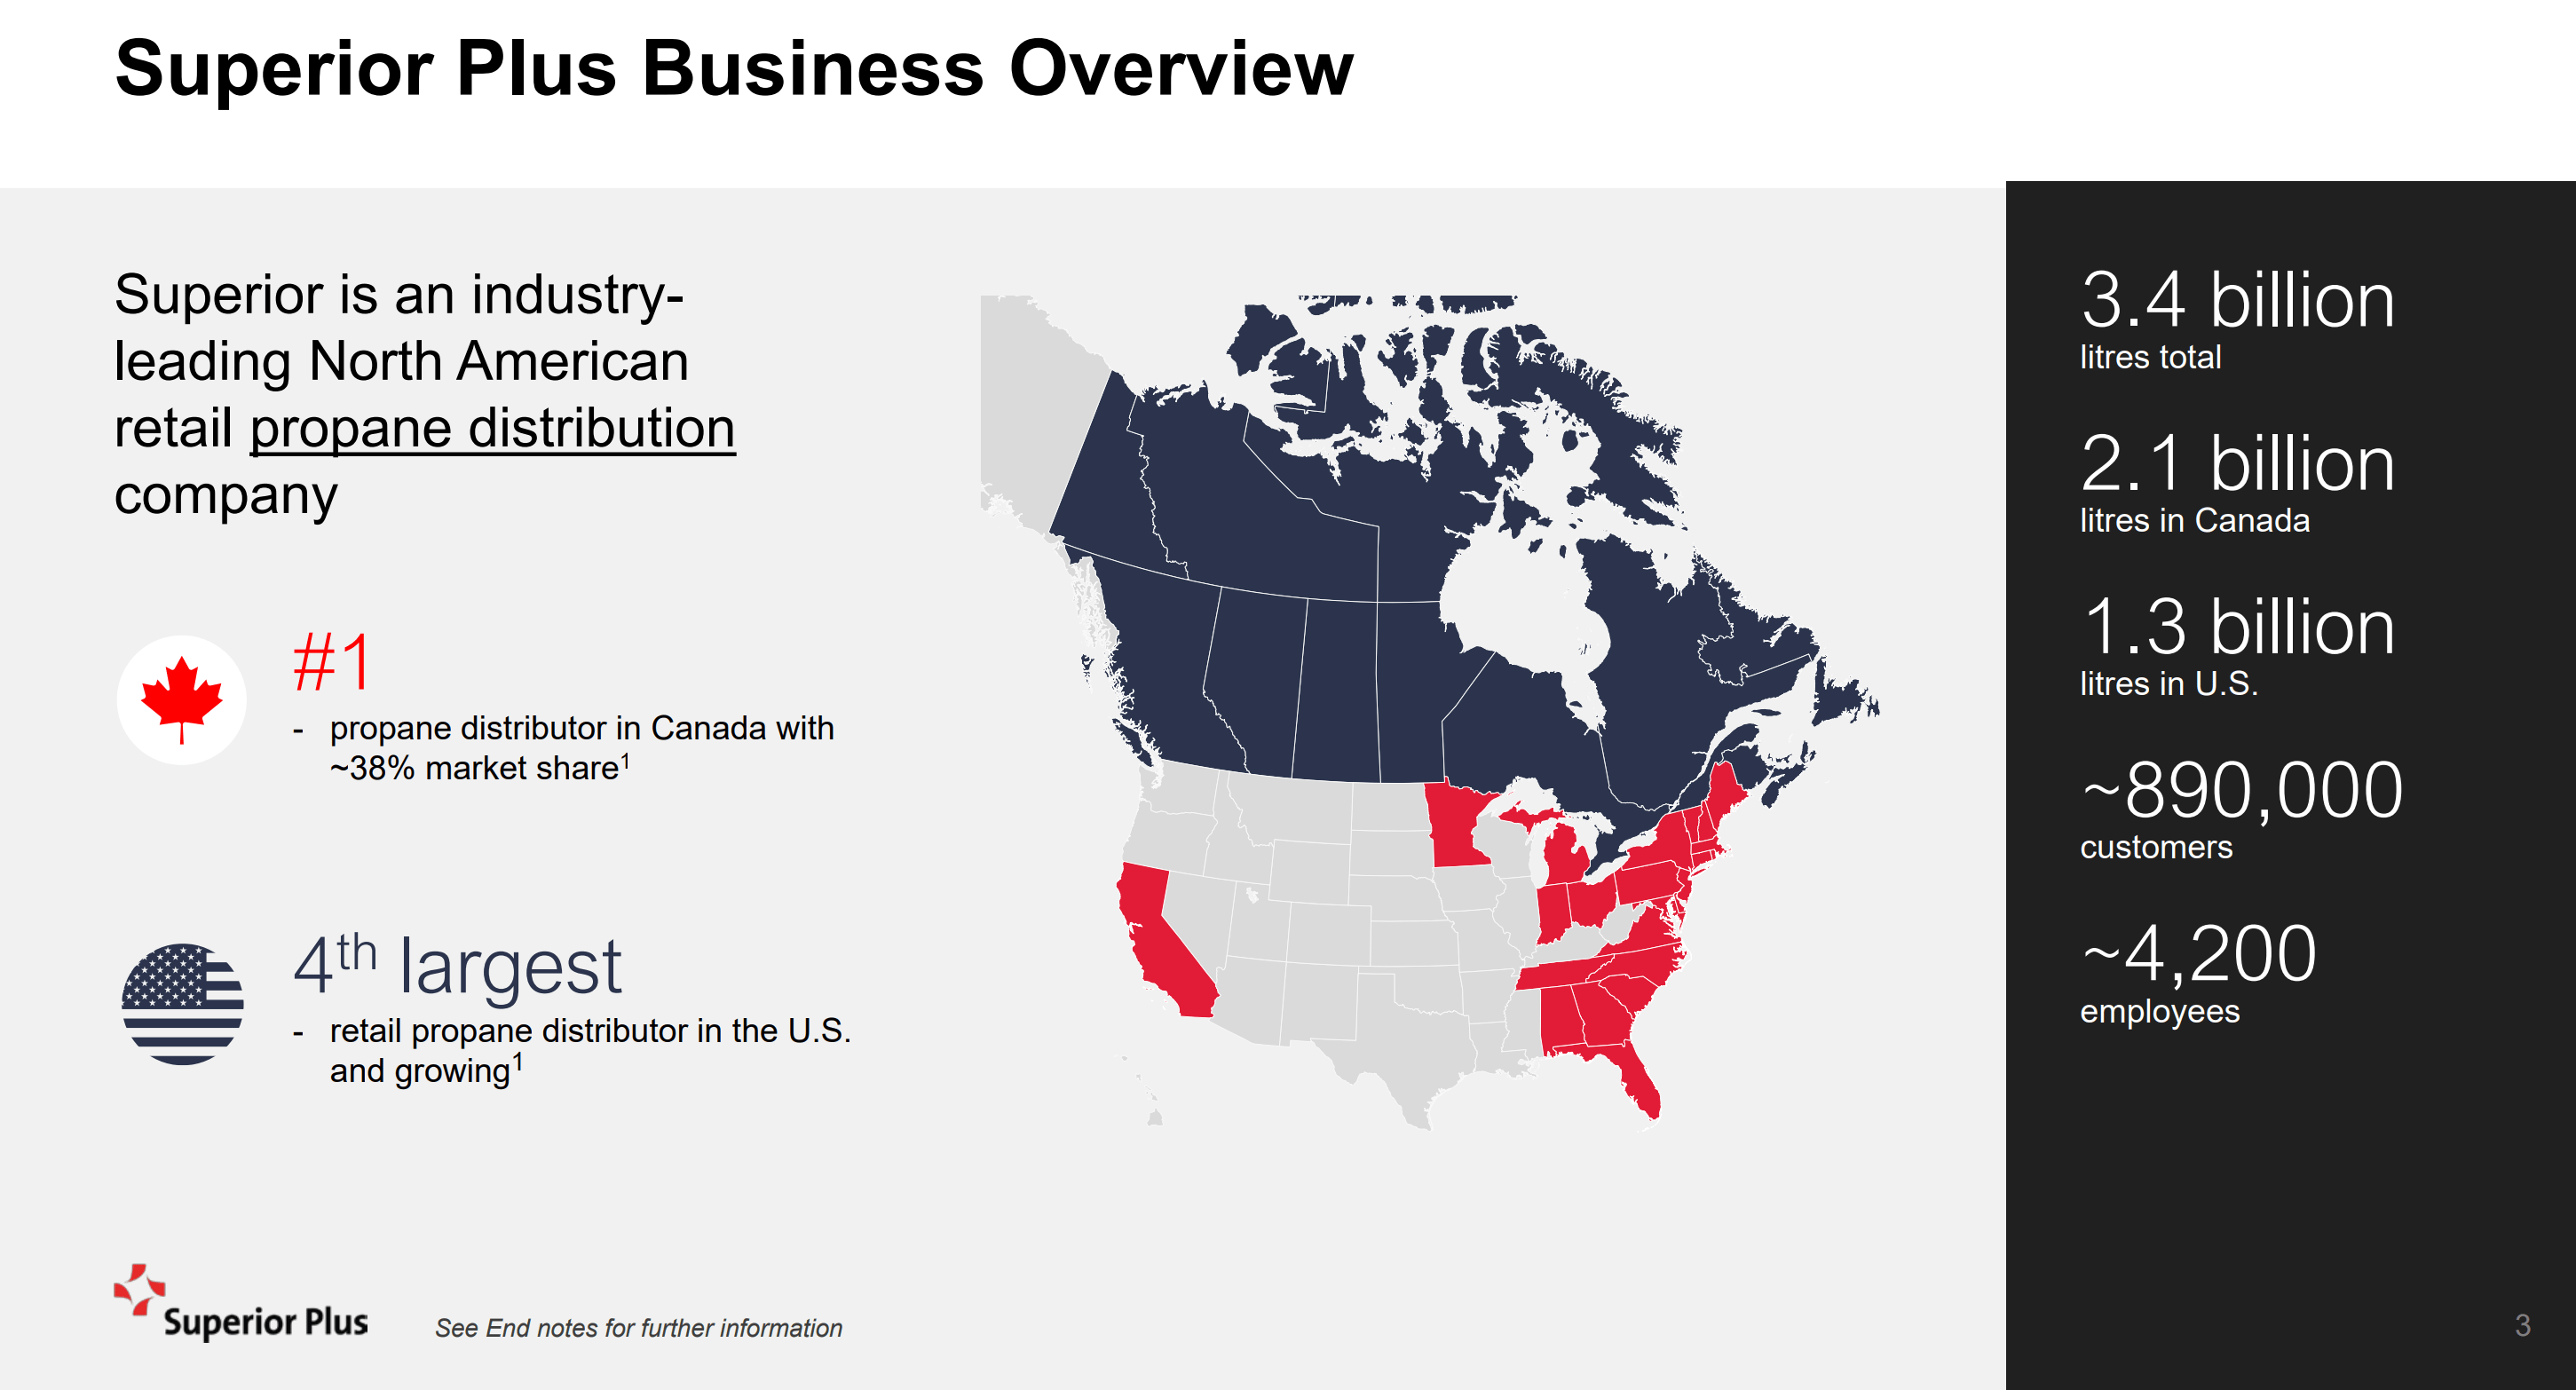
Propane Distribution Market
Propane, for those not aware, is primarily used for heating, cooking, and agricultural purposes. Historically, approximately 5% of U.S. household’s energy use comes from propane (Figure 2). In Canada, where natural gas is more prevalent, approximately 2% of household energy is sourced from propane. Propane can be used to fuel barbecue grills, water heaters, stovetops, dryers, and even backup generators.
Figure 2 – Household energy sources (Suburban Propane investor presentation)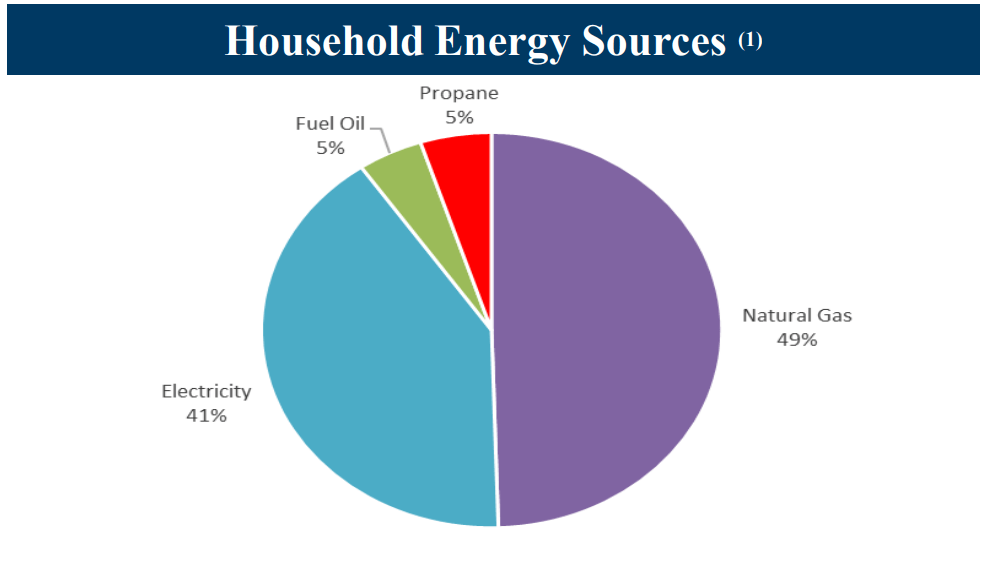
As mentioned above, Superior Plus is the largest propane distributor in Canada with 38% market share. In the U.S., the market is much more fragmented, with Superior Plus being the 4th largest distributor, but only having 3% market share (Figure 3).
Figure 3 – U.S. propane distribution market share (Suburban Propane investor presentation)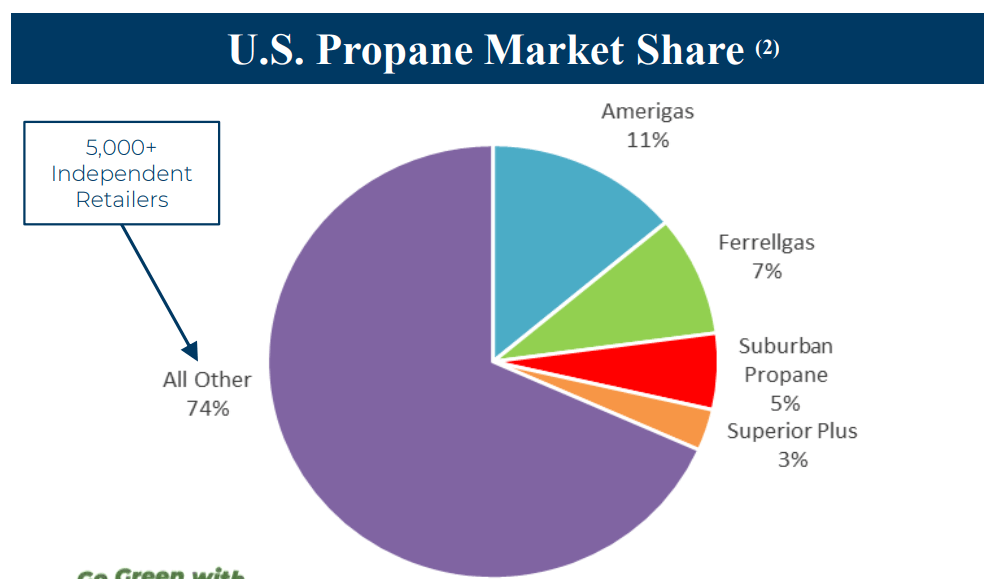
Business Analysis
For Superior Plus, although it sells more volume in Canada (2.1 billion litres in Canada vs. 1.3 billion litres in the U.S.), it actually generates the majority of its EBITDA from the U.S. (Figure 4).
Figure 4 – SPB EBITDA by segment (Superior Plus investor presentation)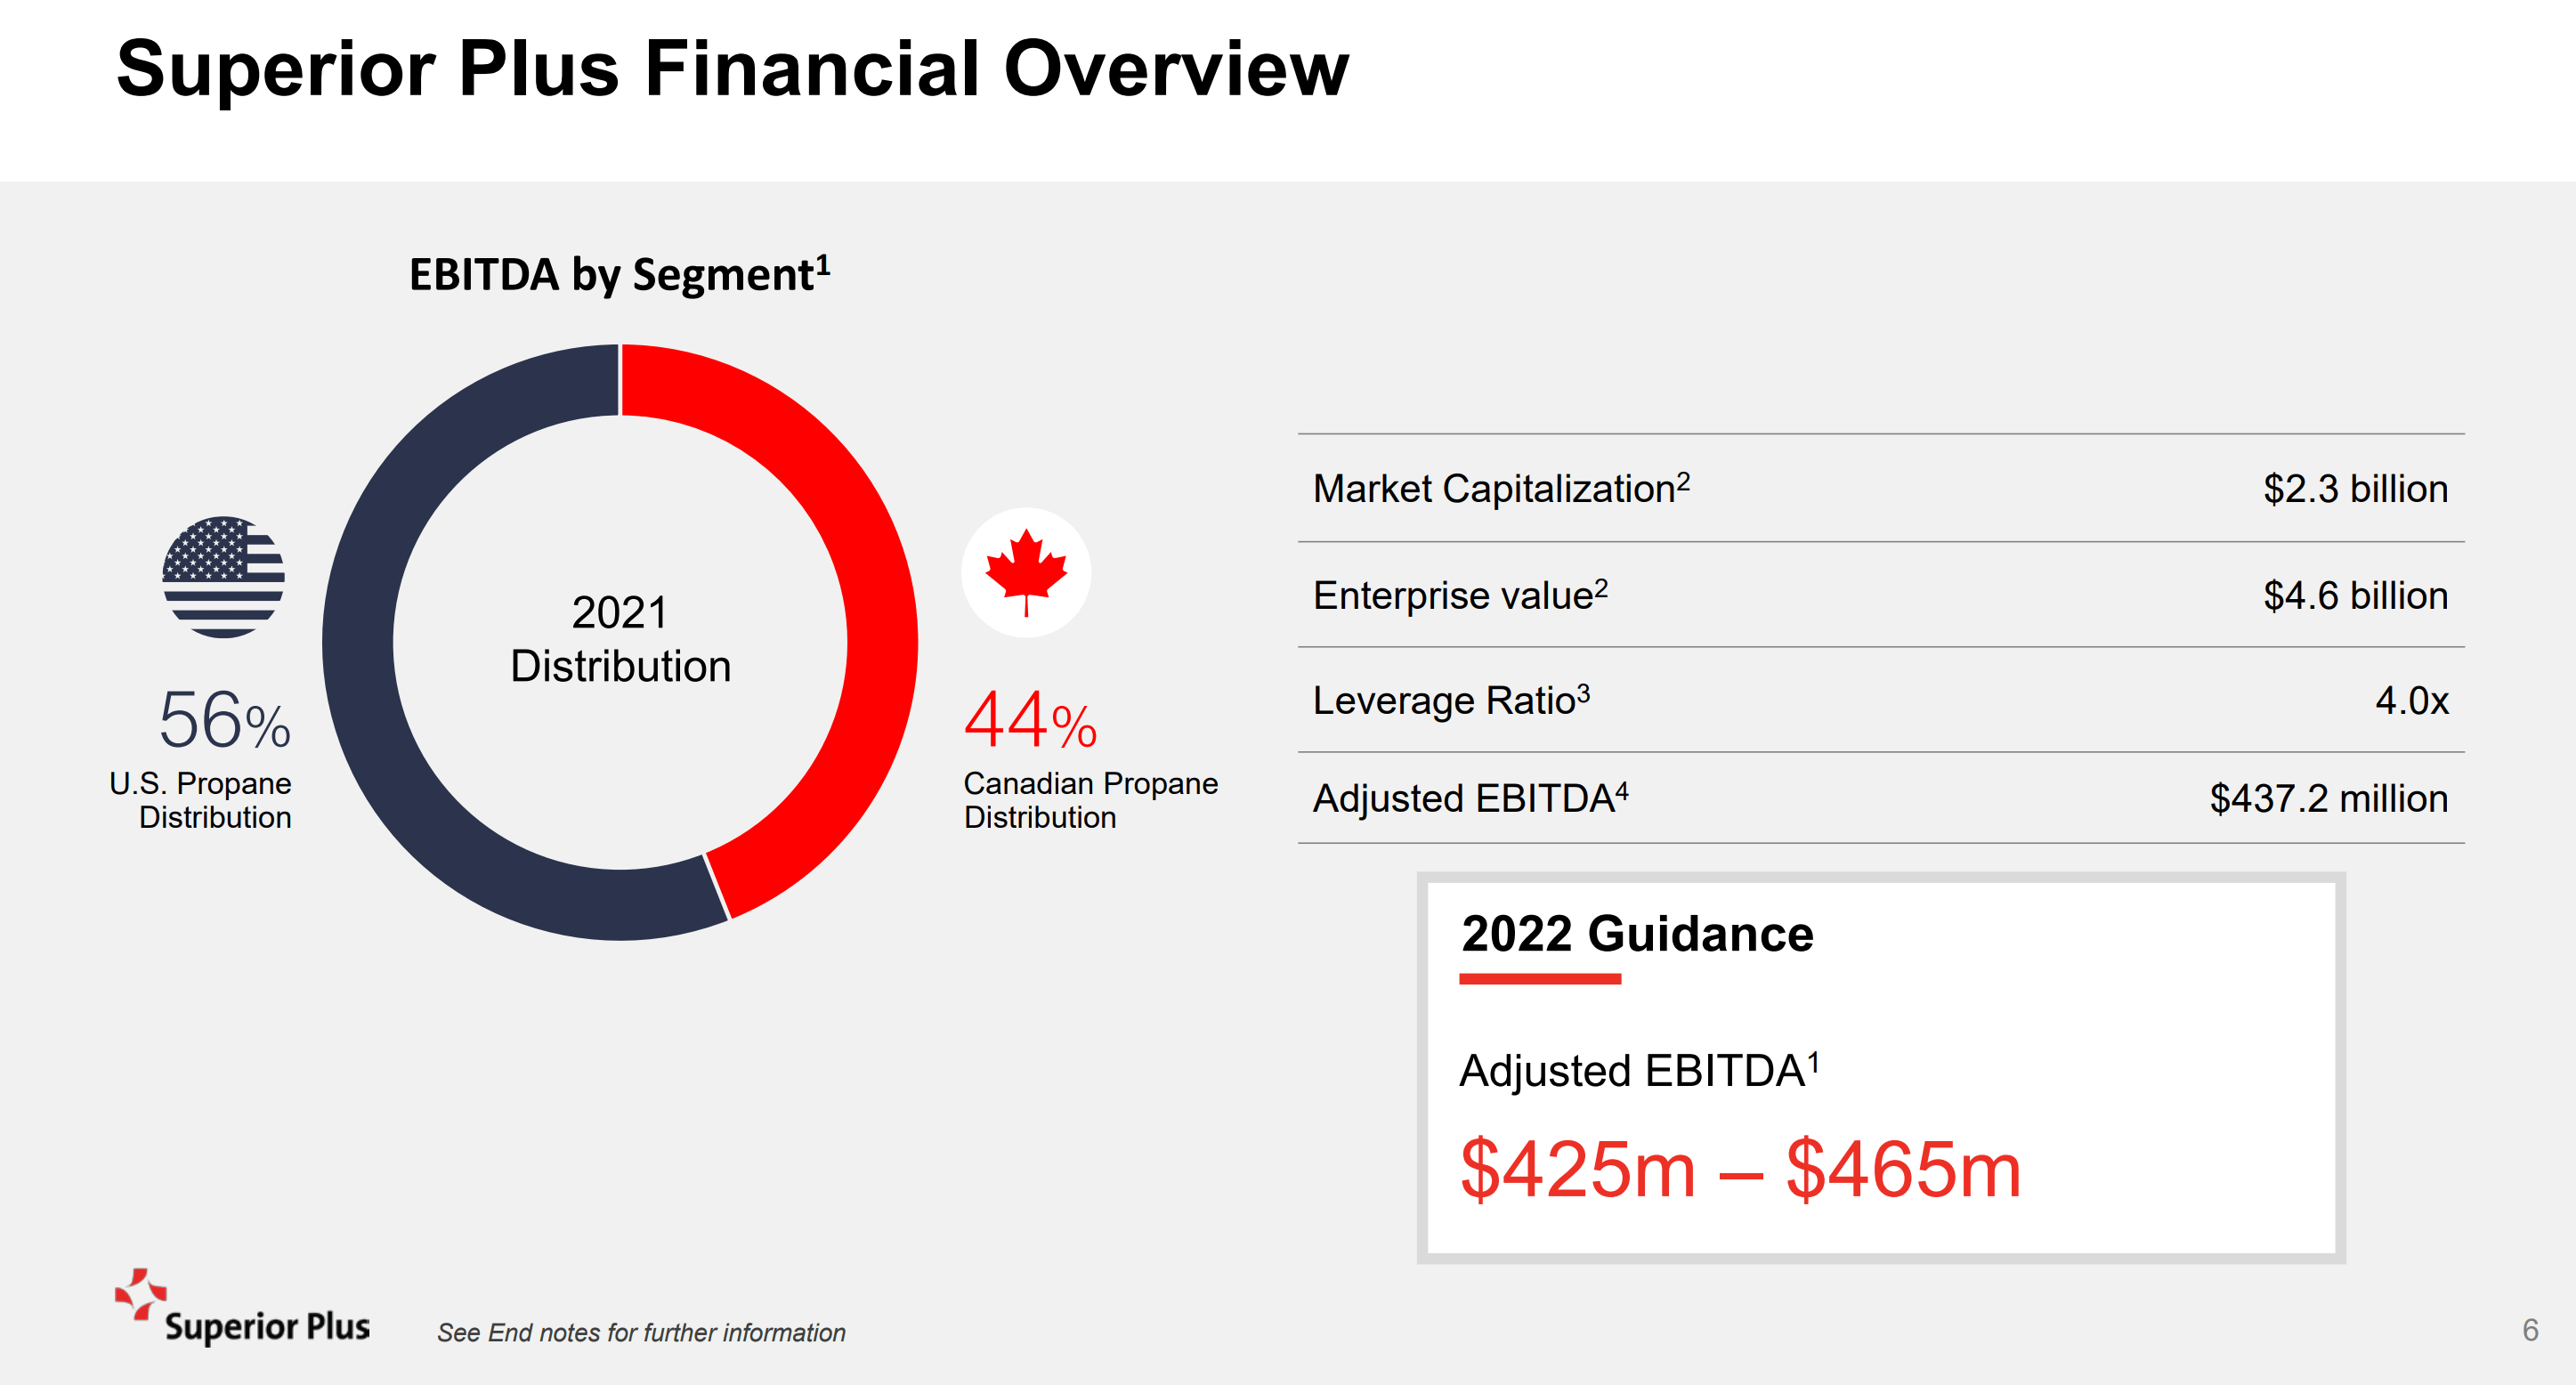
This is because the U.S. market is weighted towards residential and small commercial customers, where margins can be higher (Figure 5).
Figure 5 – SPB Customer mix (Superior Plus investor presentation)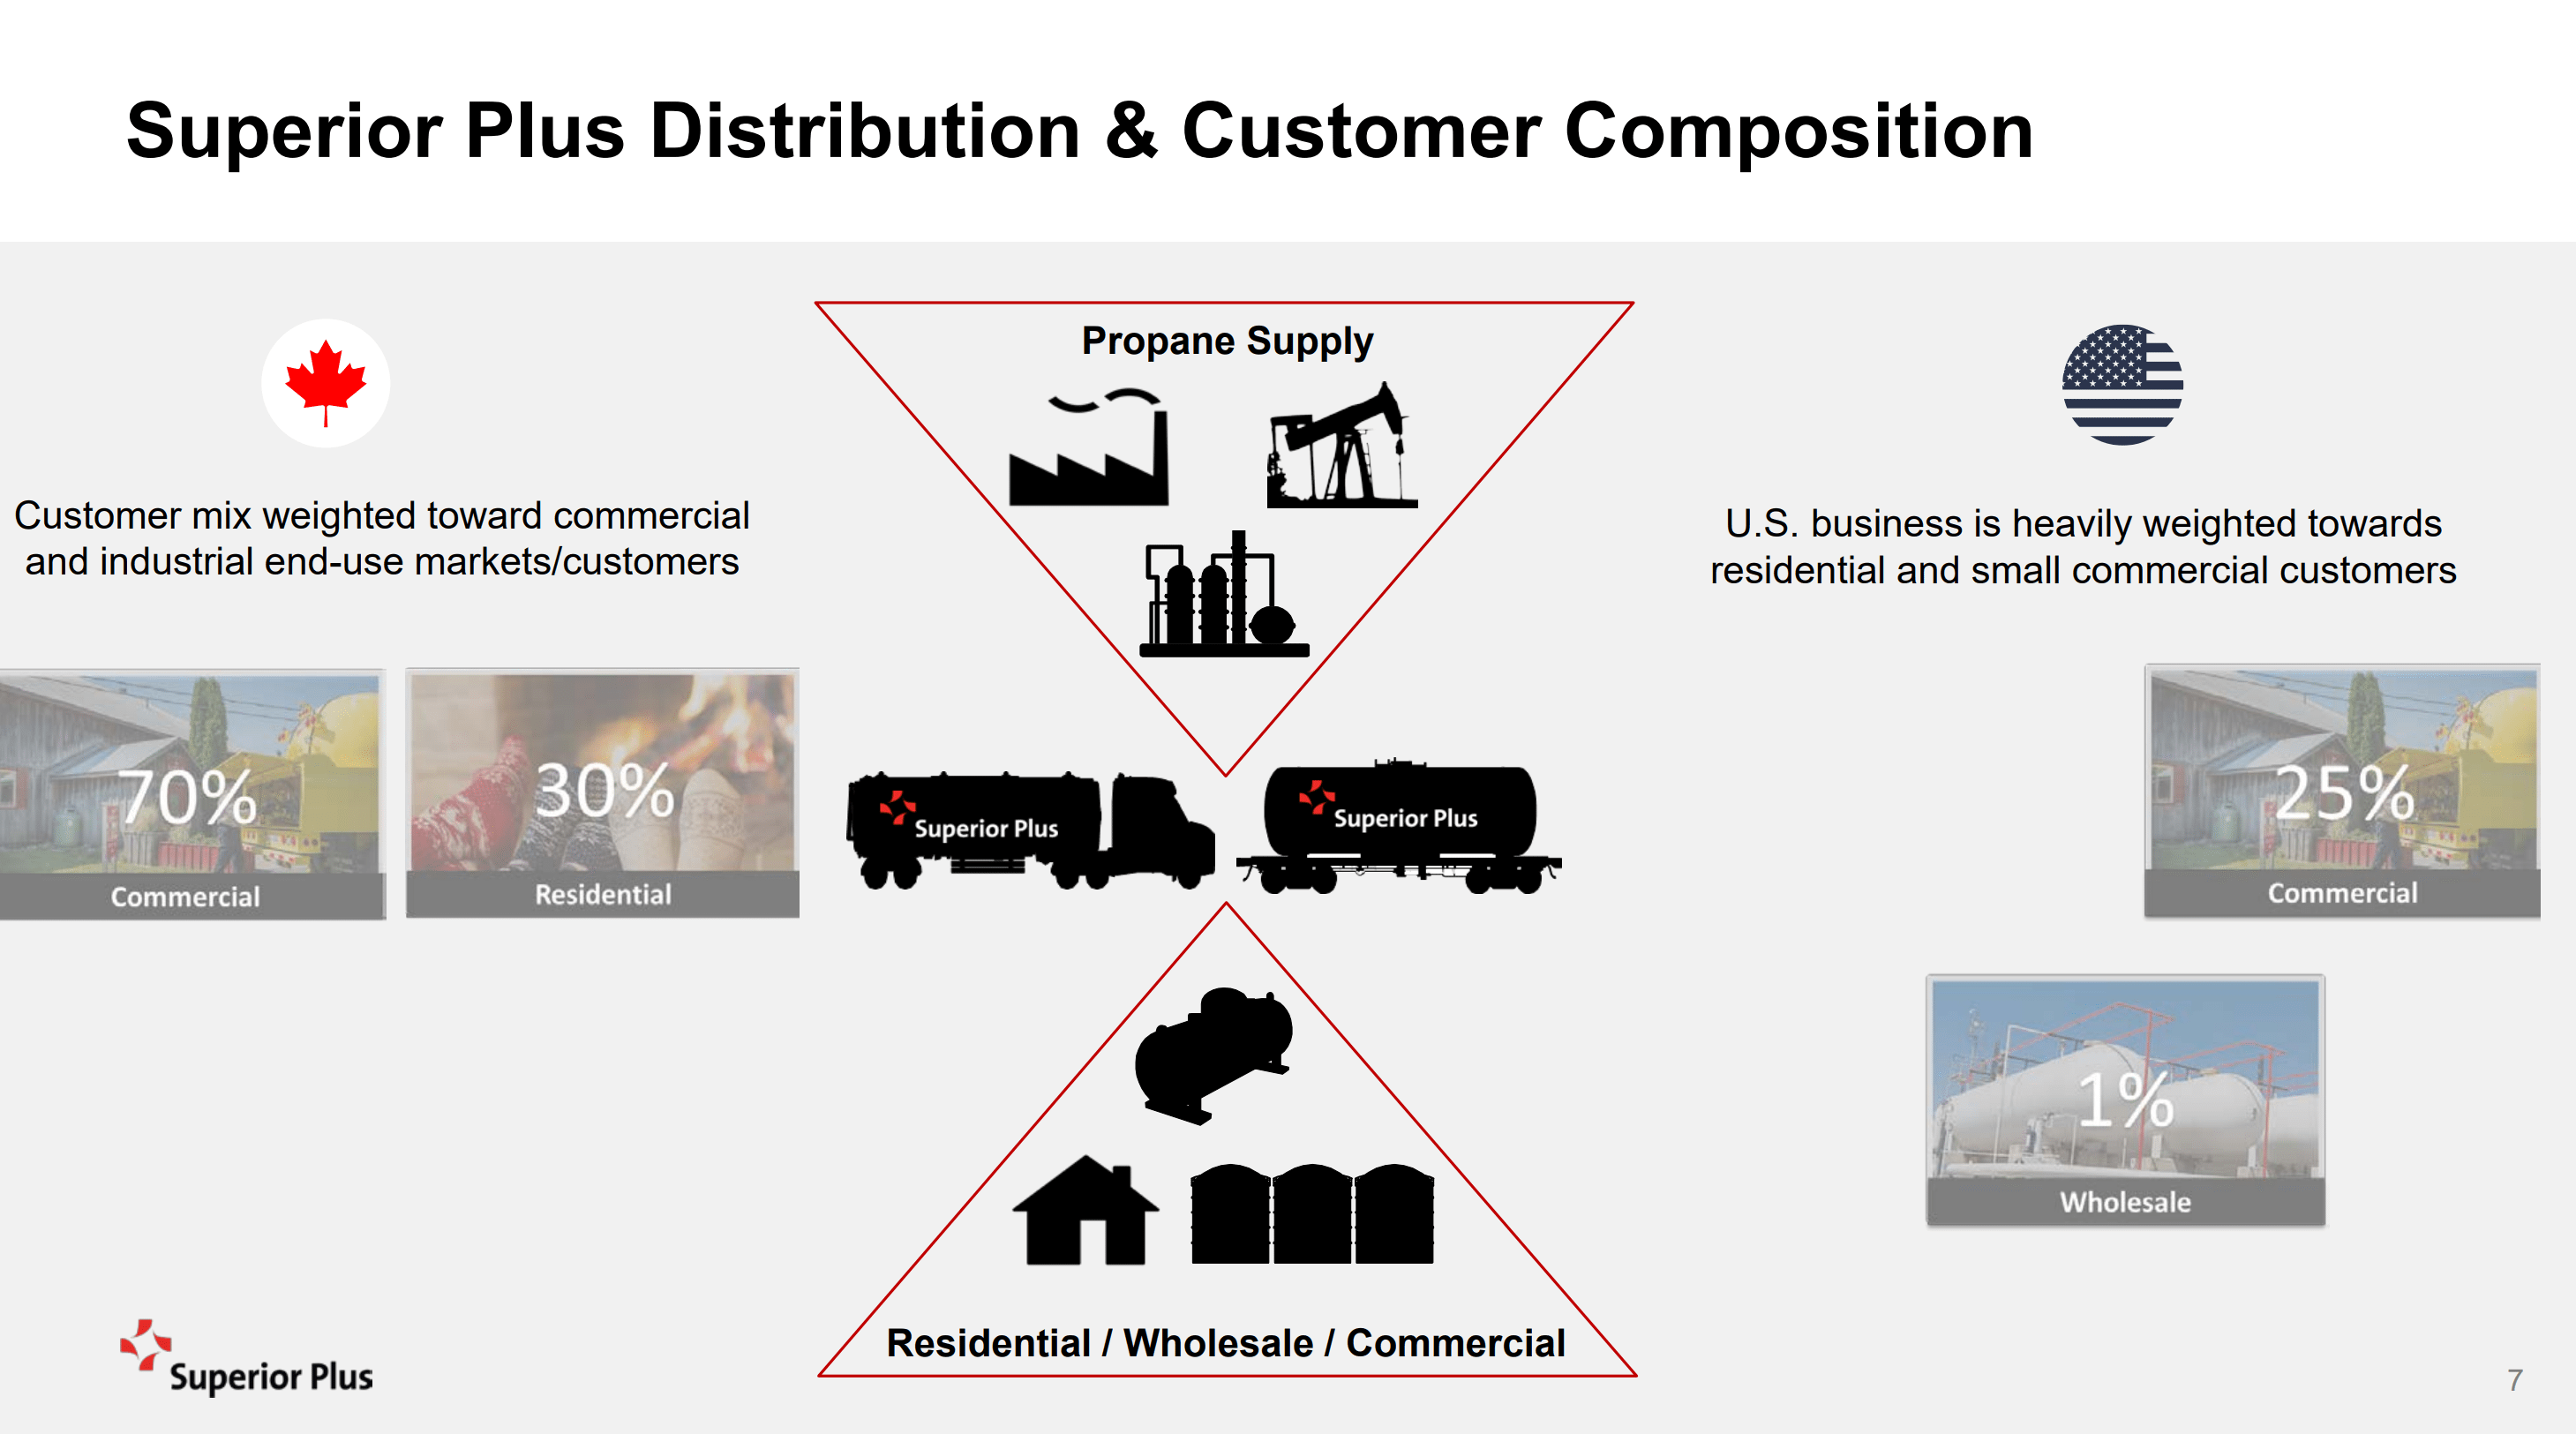
U.S. Consolidation Strategy
Due to the attractiveness of the U.S. business, Superior Plus has been on a consolidation spree. Since 2017, Superior Plus has made more than 30 acquisitions, with the majority of the acquisitions in the U.S. market (Figure 6).
Figure 6 – SPB acquisition history (Superior Plus investor presentation)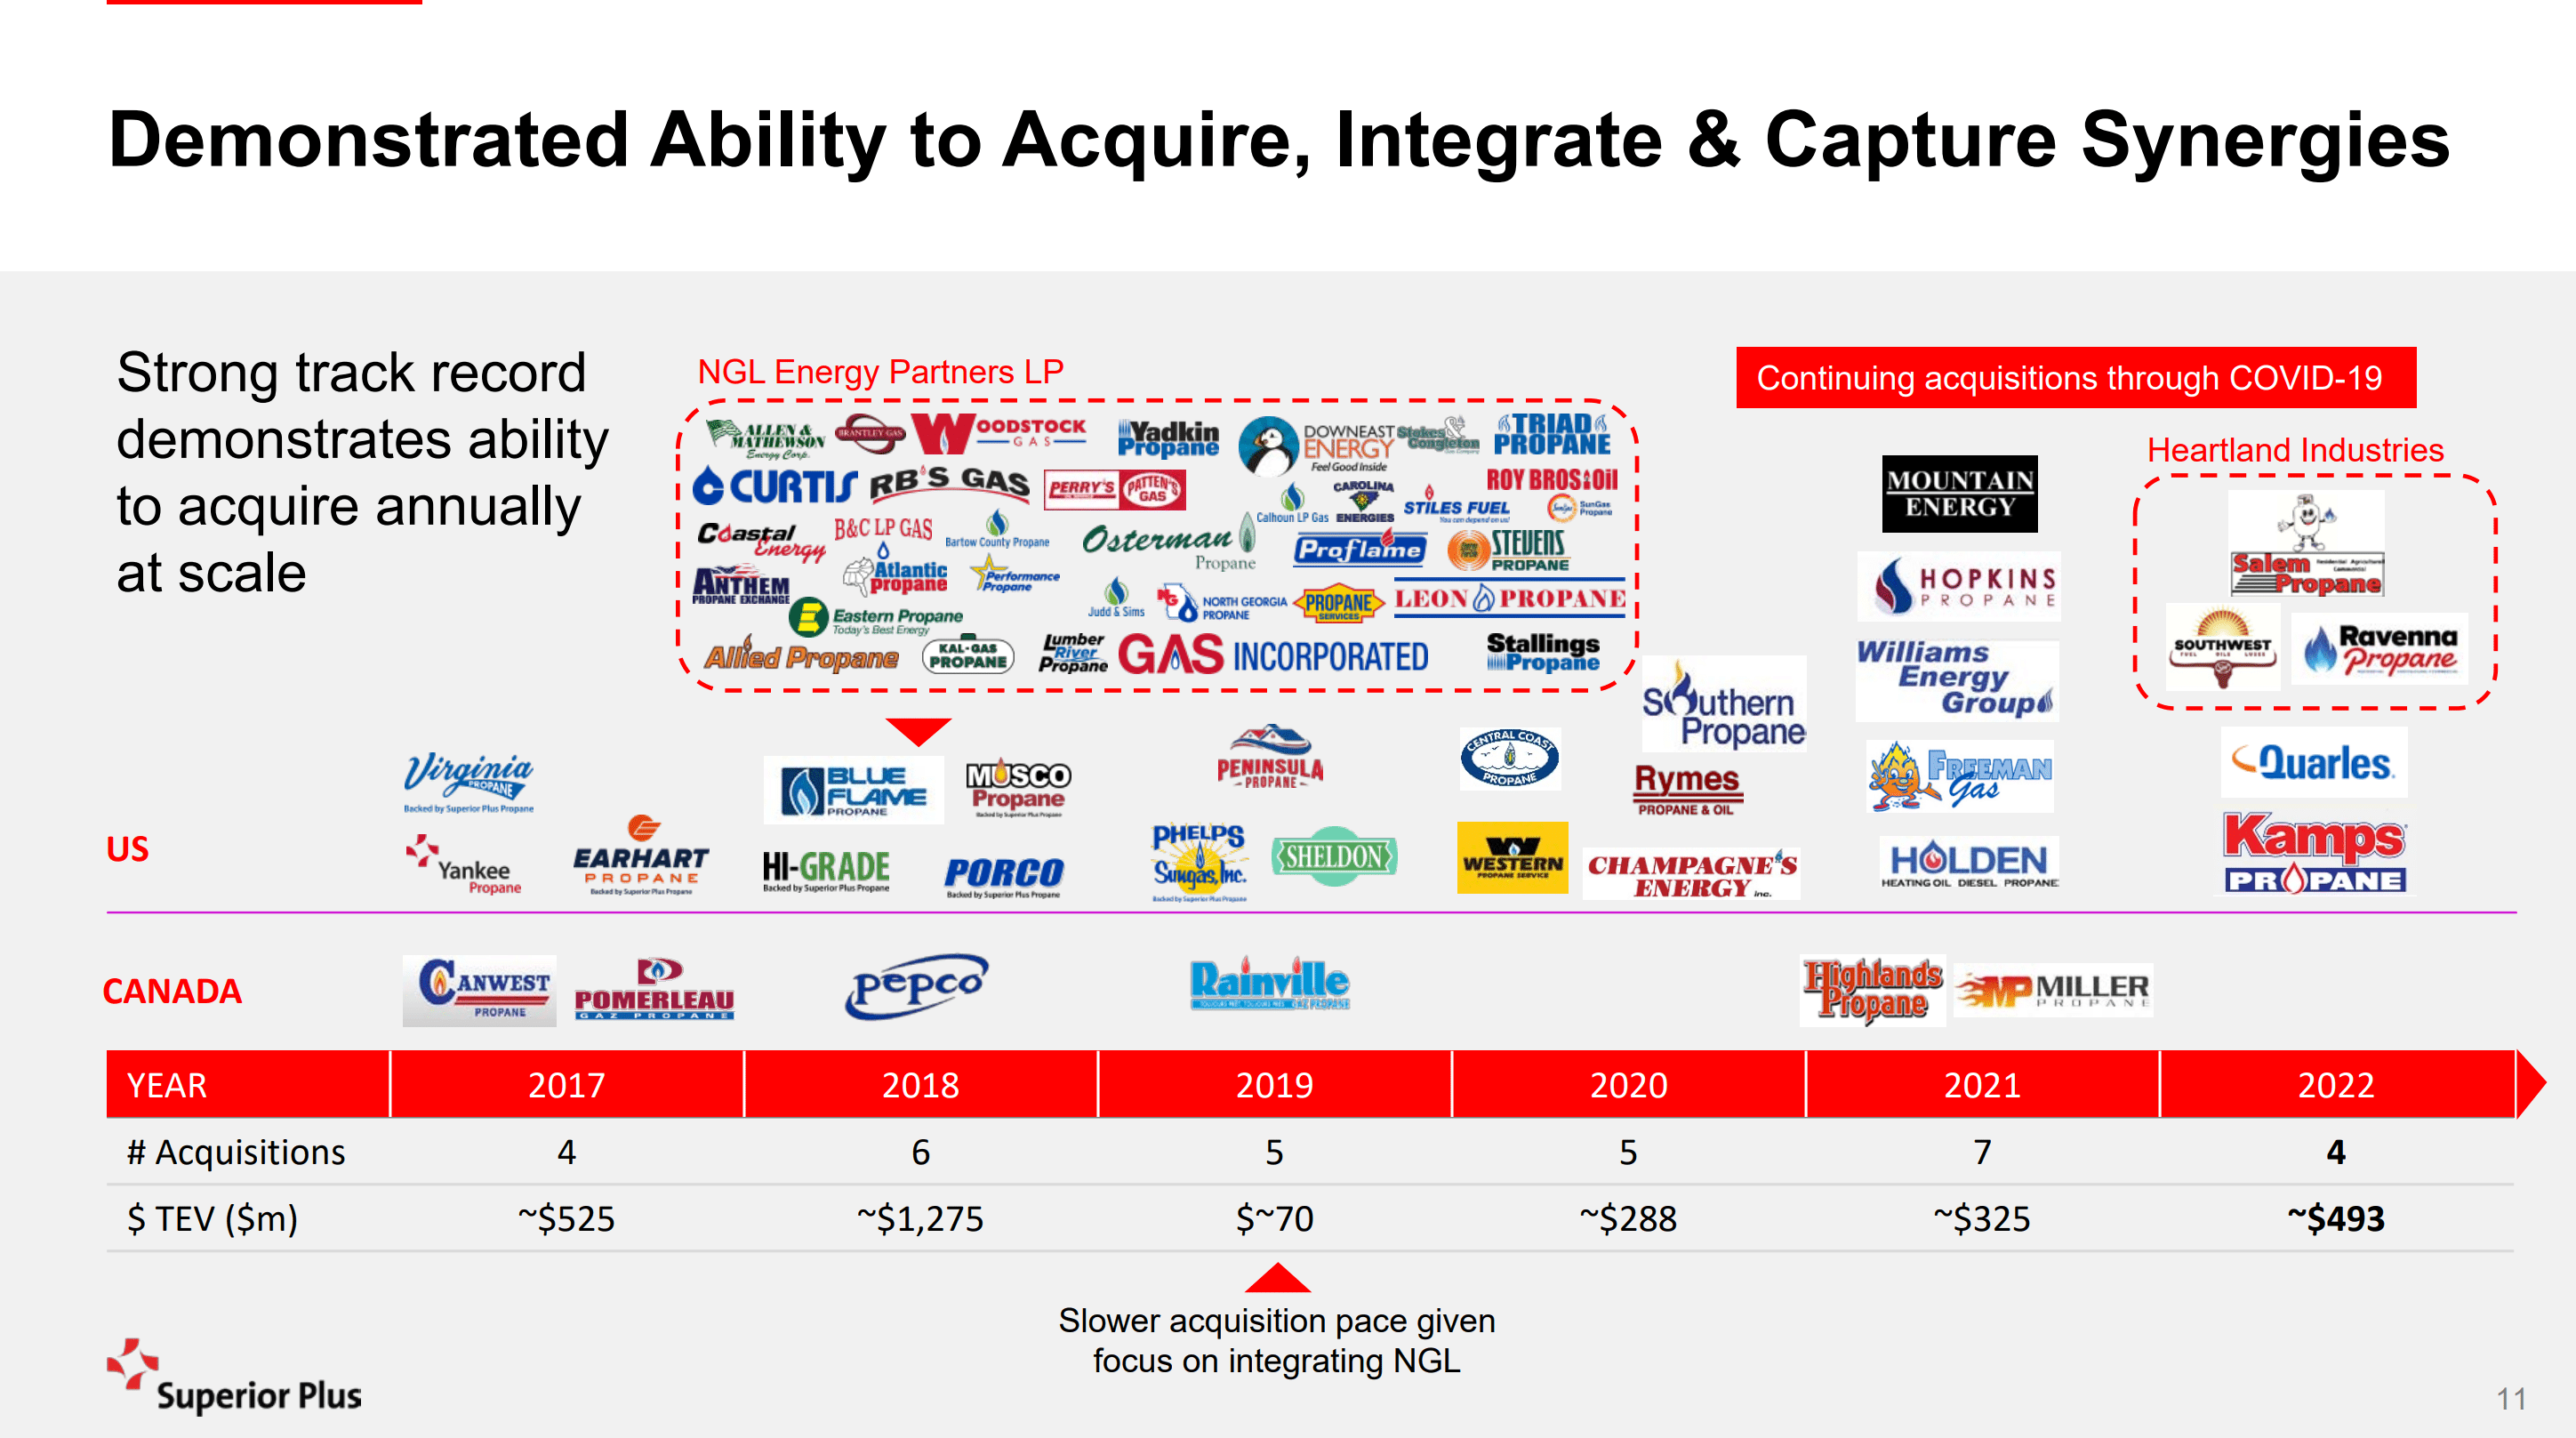
Since divesting the specialty chemicals business in 2021, Superior Plus has made ambitious plans to grow EBITDA by 70-80% to $700-$750 million by 2026 through organic growth and acquisitions (Figure 7). A key lynchpin of the strategy is $1.9 billion in planned acquisitions as part of its ‘Superior Way Forward’.
Figure 7 – SPB ambitious EBITDA growth (Superior Plus investor presentation)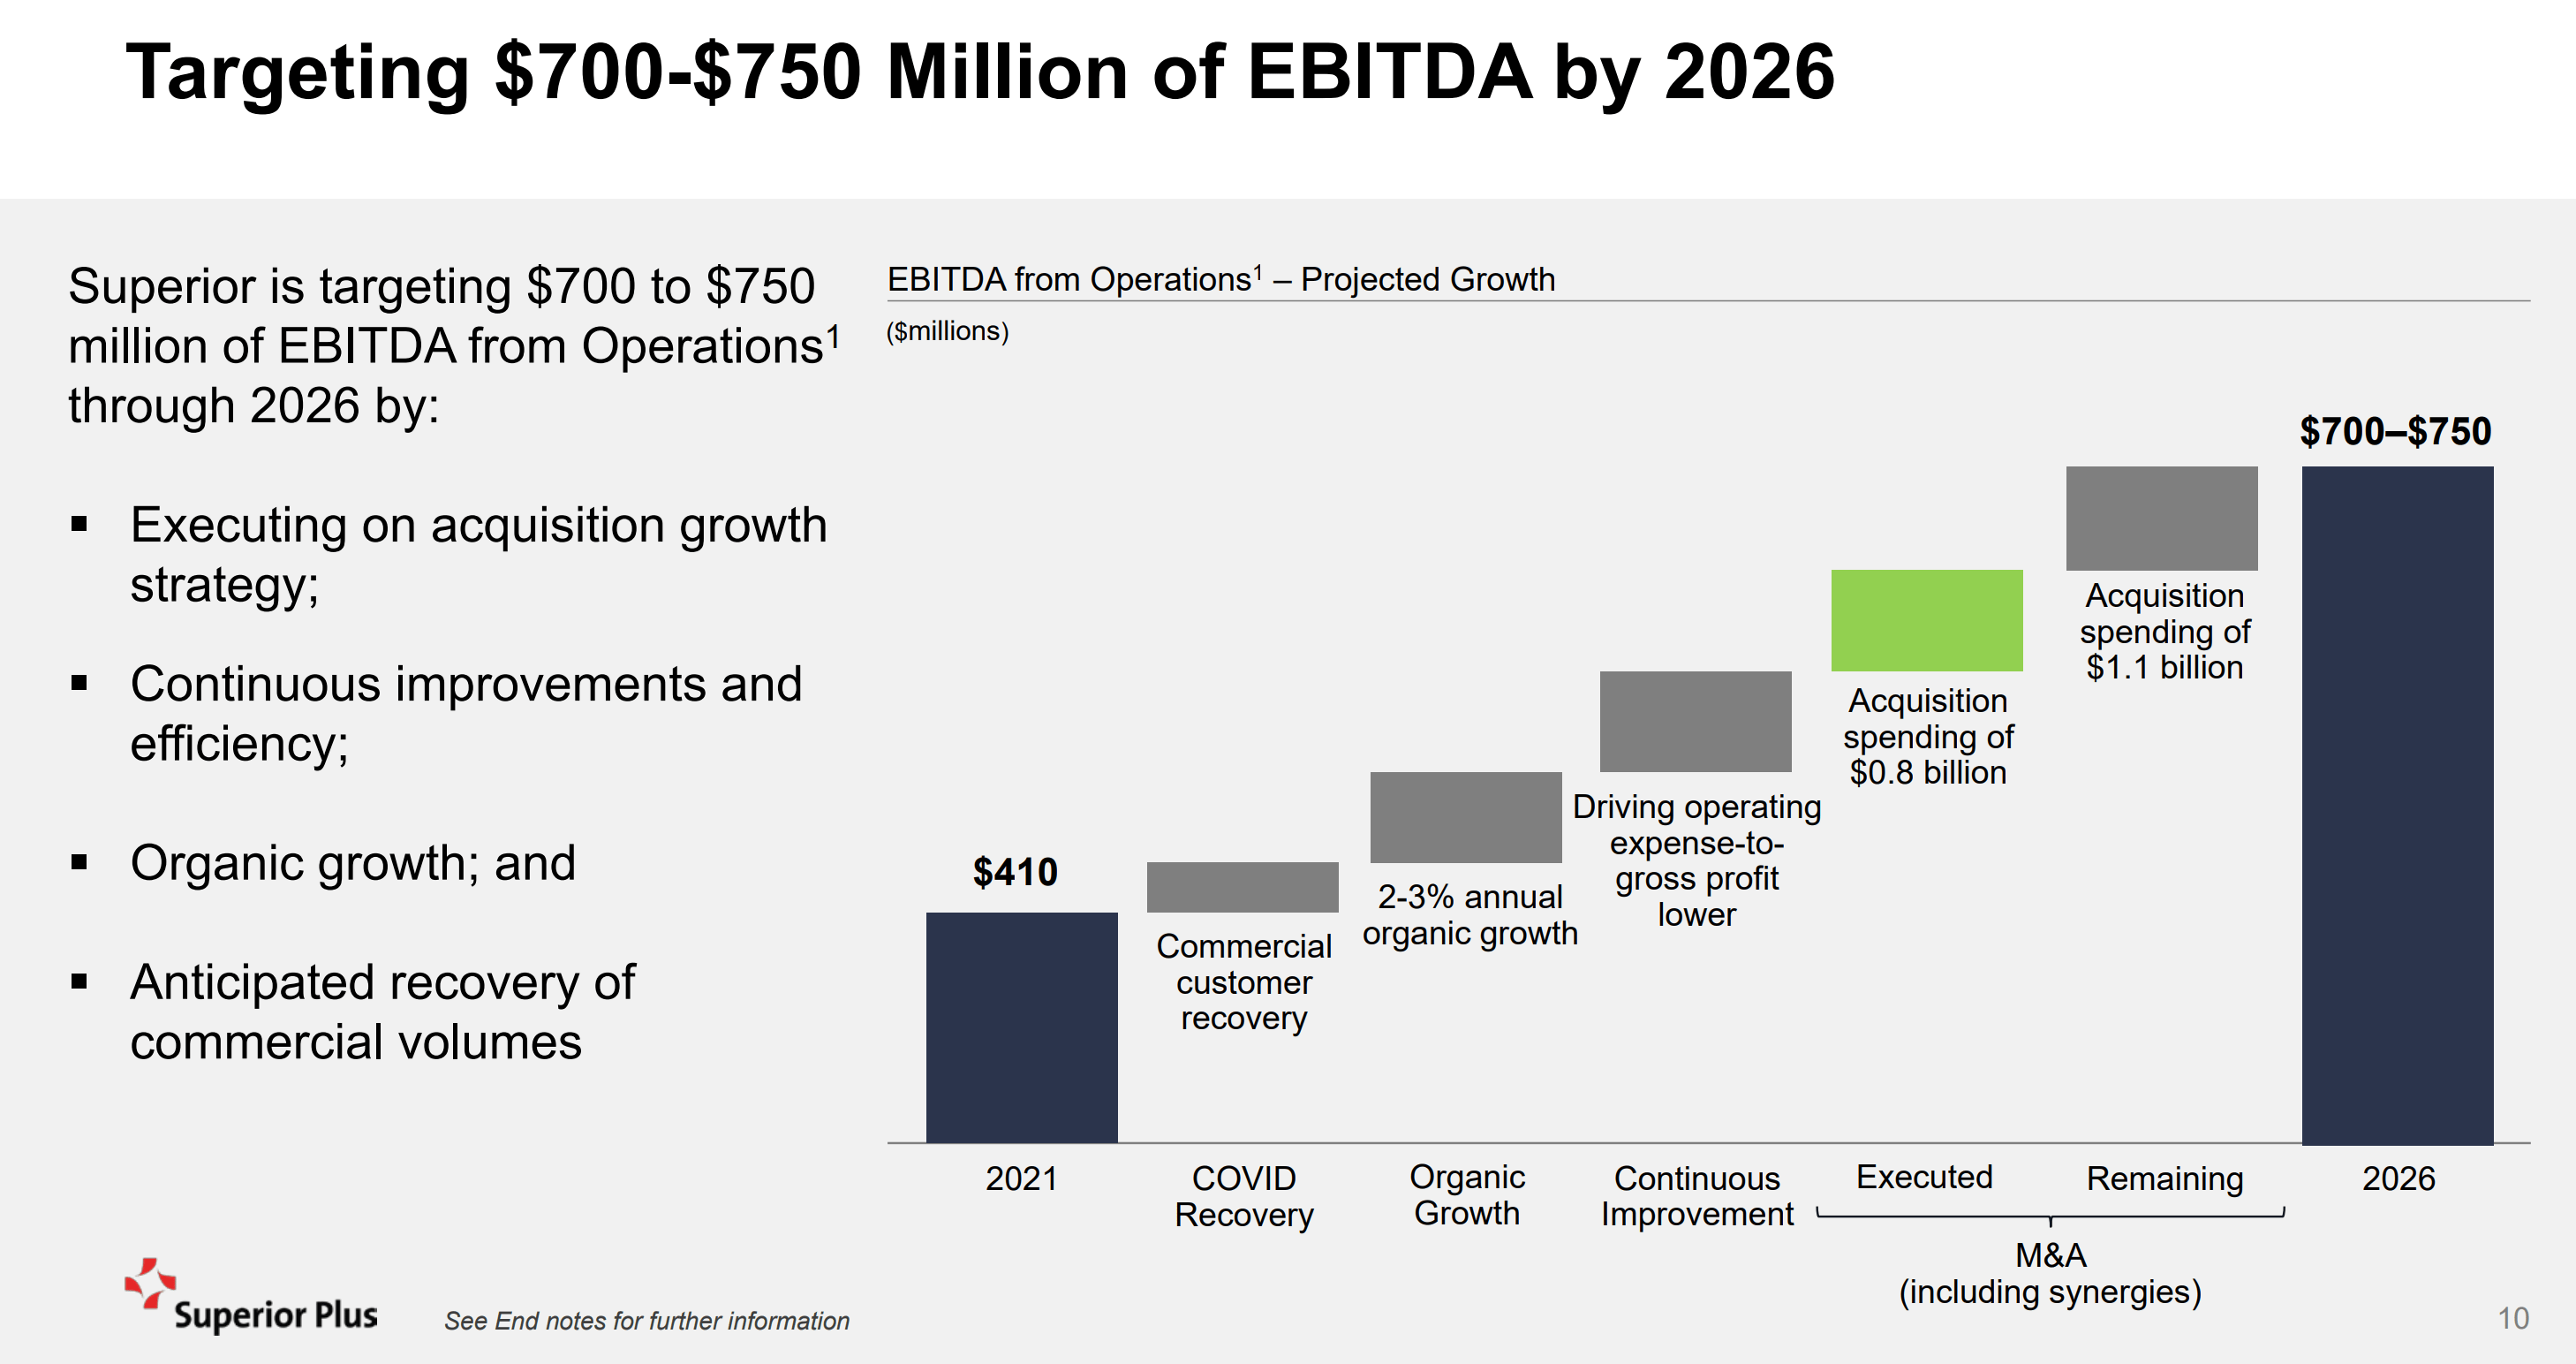
Industry consolidation can be a lucrative business strategy in theory, particularly if the industry is fragmented like the propane distribution industry. Typically, Superior Plus targets acquisitions at 8.8x EV/EBTIDA, which translate to 6.4x post synergies (Figure 8). However, in practice, what I find is that it is very hard to analyze companies pursuing a consolidation strategy, as financials are often adjusted and restated. It is only years later that we find the acquirer had overpaid for acquisitions or synergies failed to be delivered.
Figure 8 – SPB acquisition model (Superior Plus investor presentation)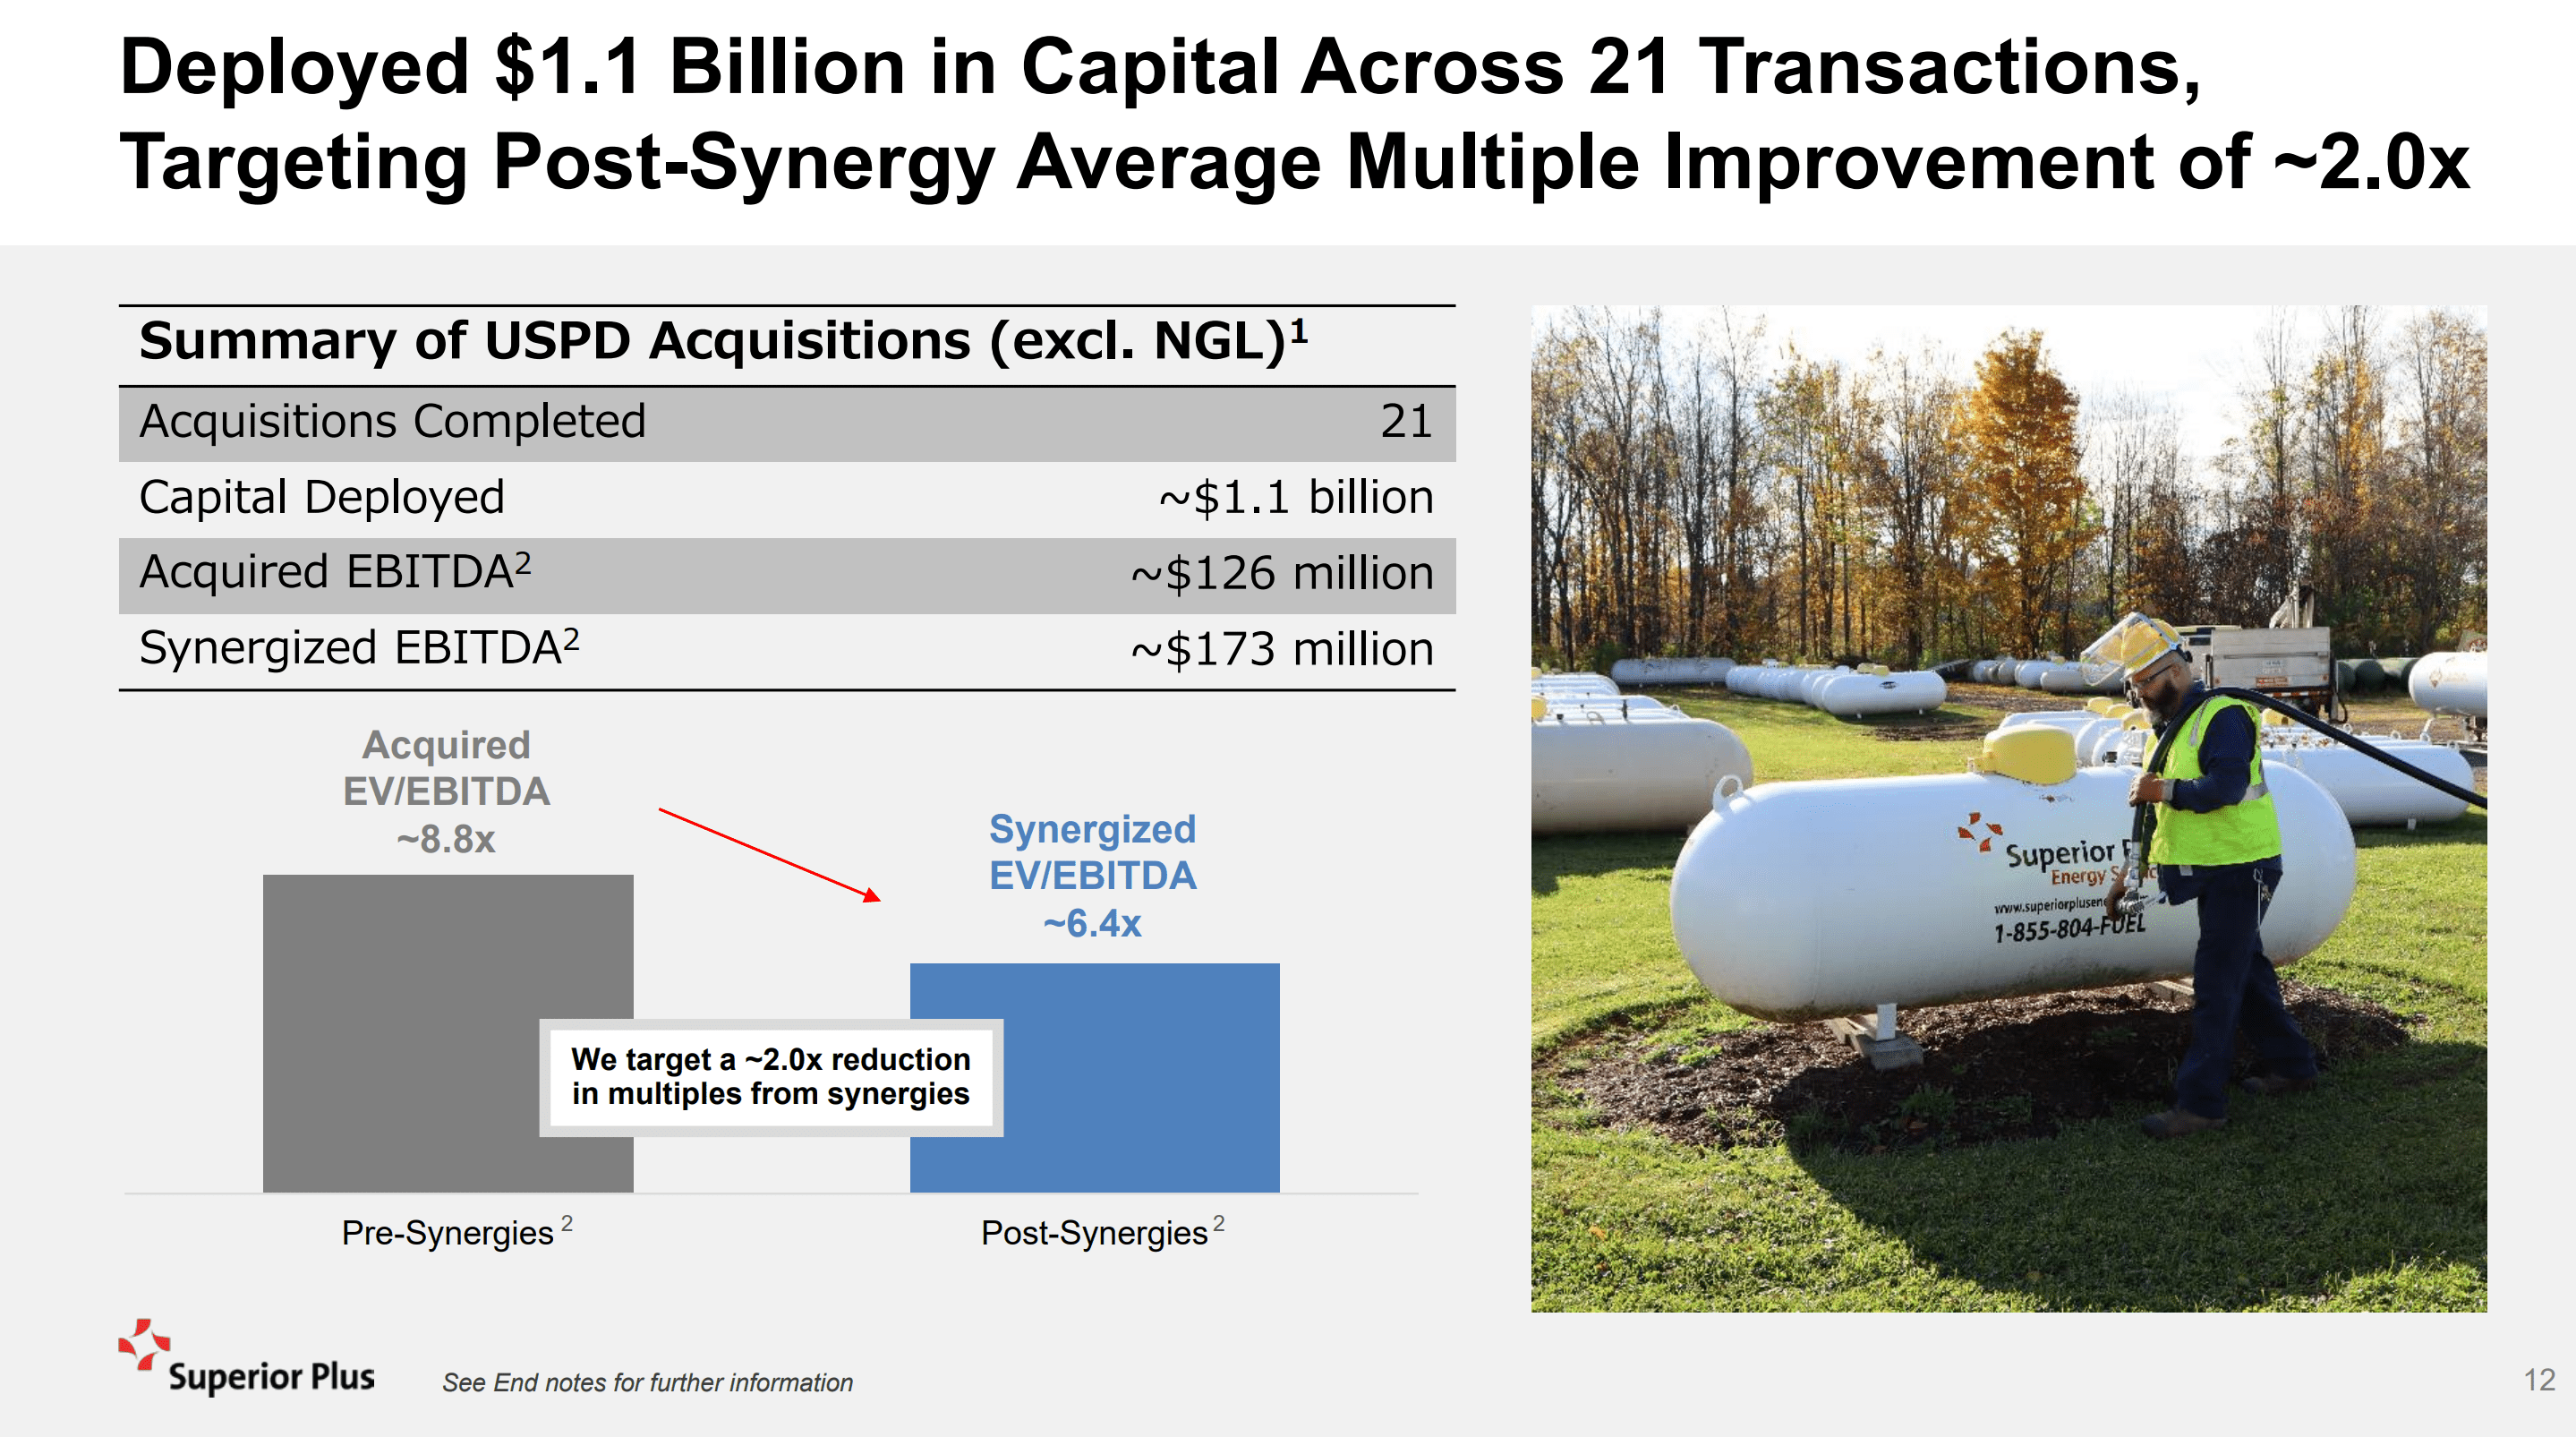
Financial Analysis
The challenge with analyzing a consolidator is that the financials can often get messy, with lots of charges and M&A adjustments. From Superior’s 2021 annual report, we get the following set of financials (Figure 9). As we can see, although revenues increased 32% YoY, gross profit was flat at $913 million, meaning gross margins declined from 50.6% to 38.1%. The result is surprising, as our prior analysis of Suburban Propane showed SPH had gross margins of 65.4% and 62.3% in 2020 and 2021 respectively.
Figure 9 – consolidated financials (Superior Plus 2021 annual report)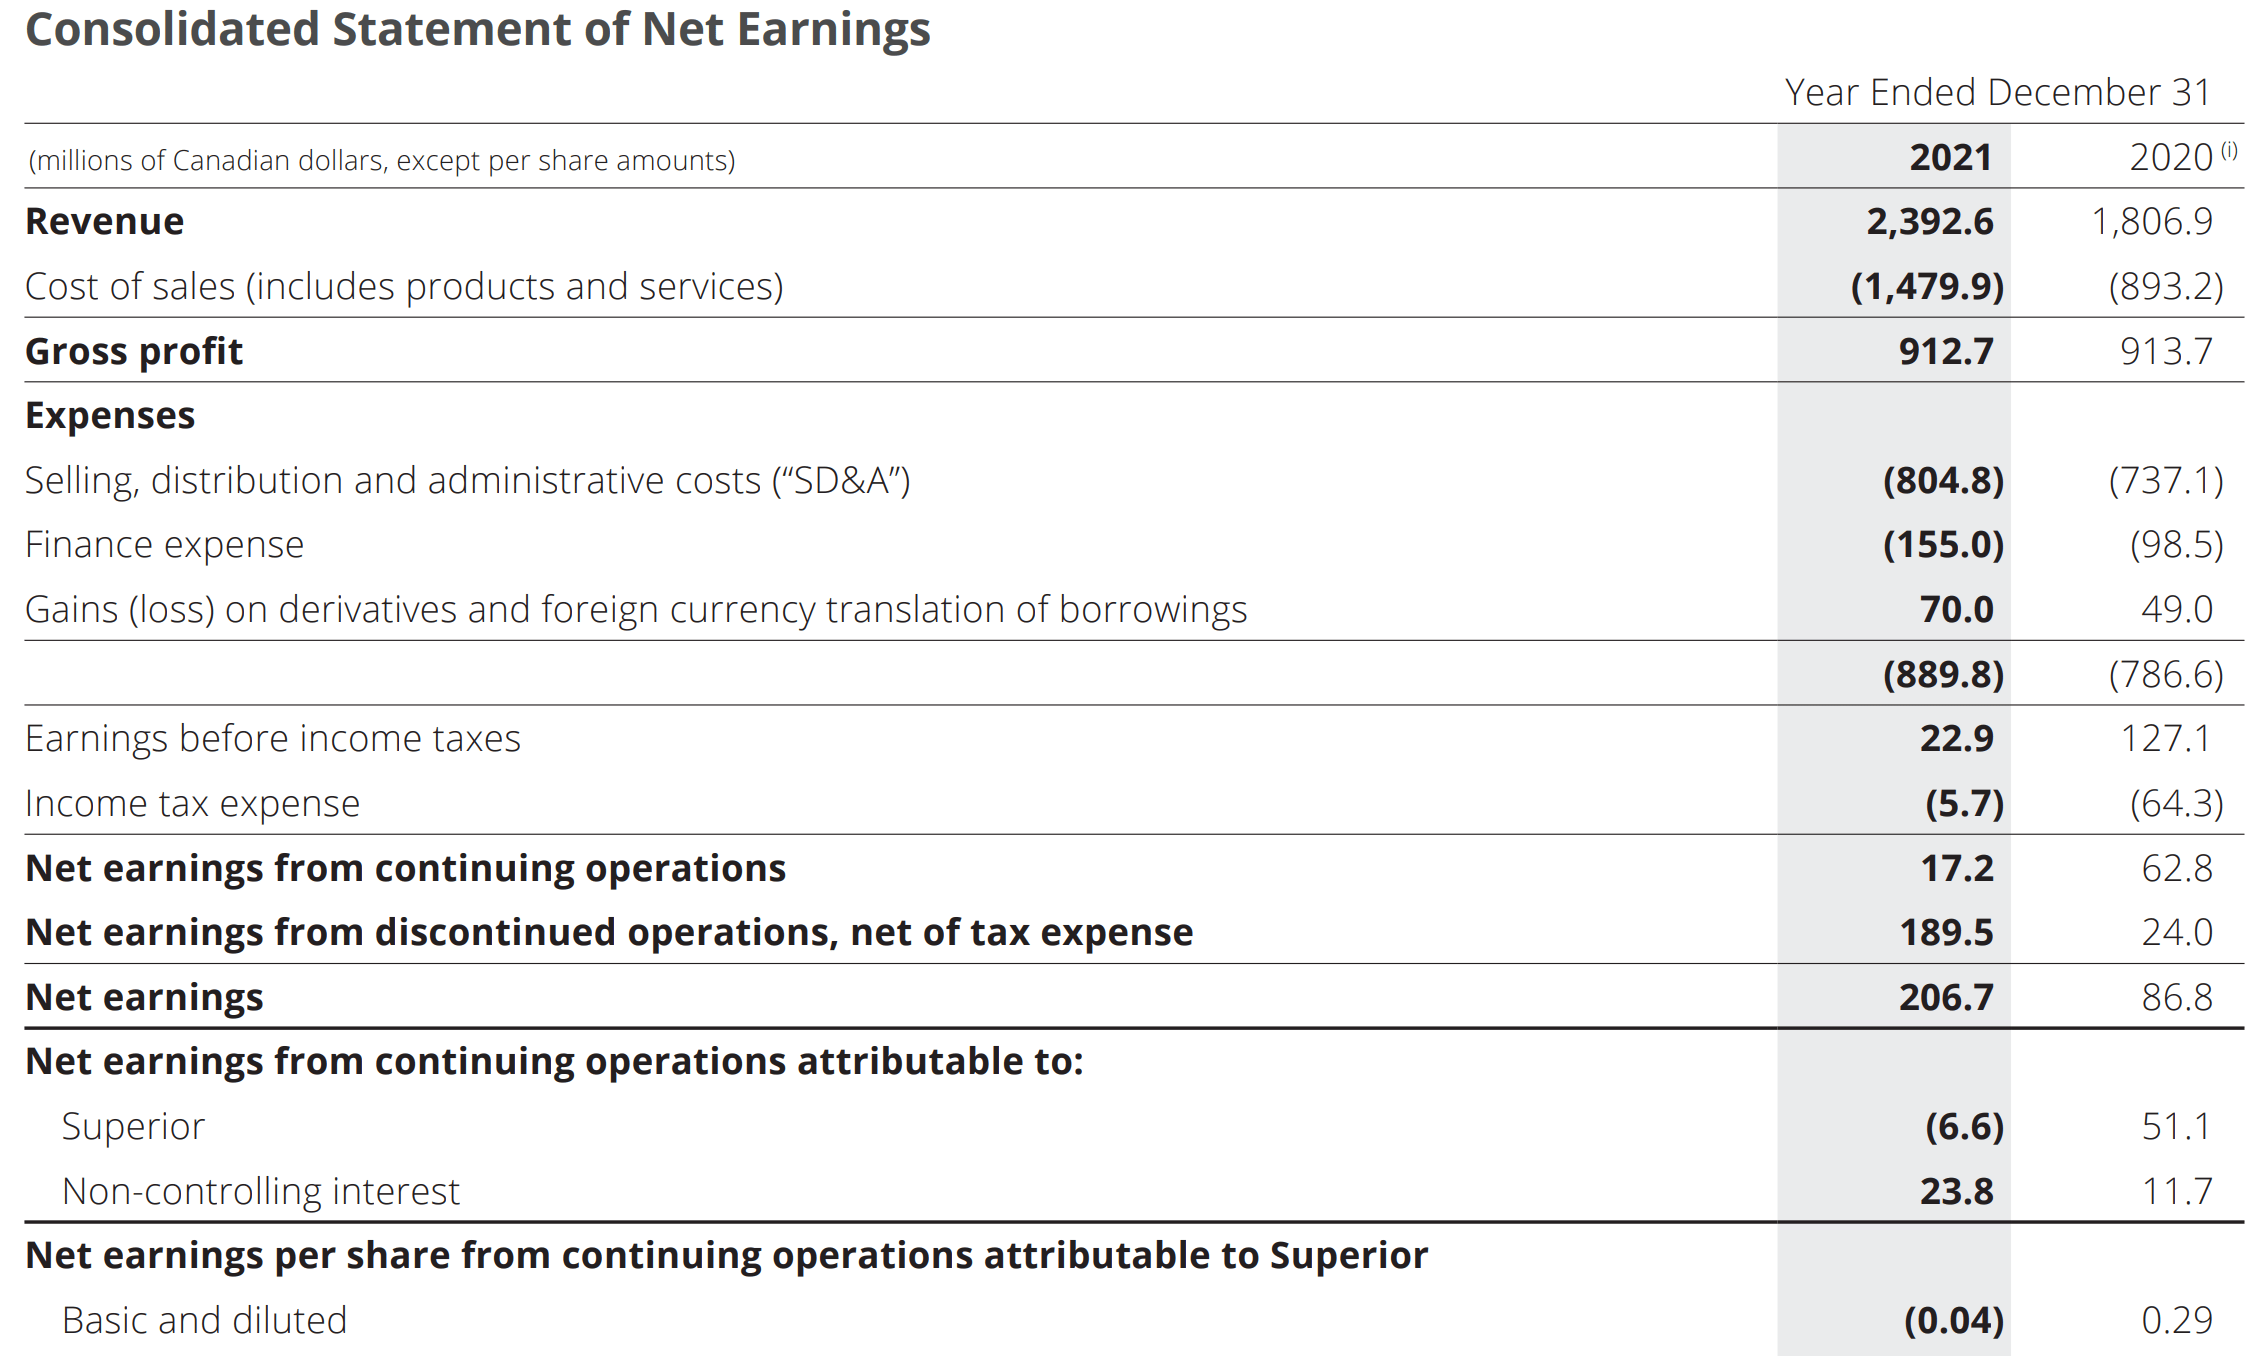
Looking purely at Superior’s U.S. business, we see adjusted gross margins were 55.5% and 47.8% in 2020 and 2021 respectively, higher than consolidated margins but still substantially less than Suburban Propane’s gross margins. Adjusted EBITDA margins for 2020 and 2021 are 23.0% and 19.2% respectively for Superior Plus.
Figure 10 – SPB US business (Superior Plus 2021 annual report)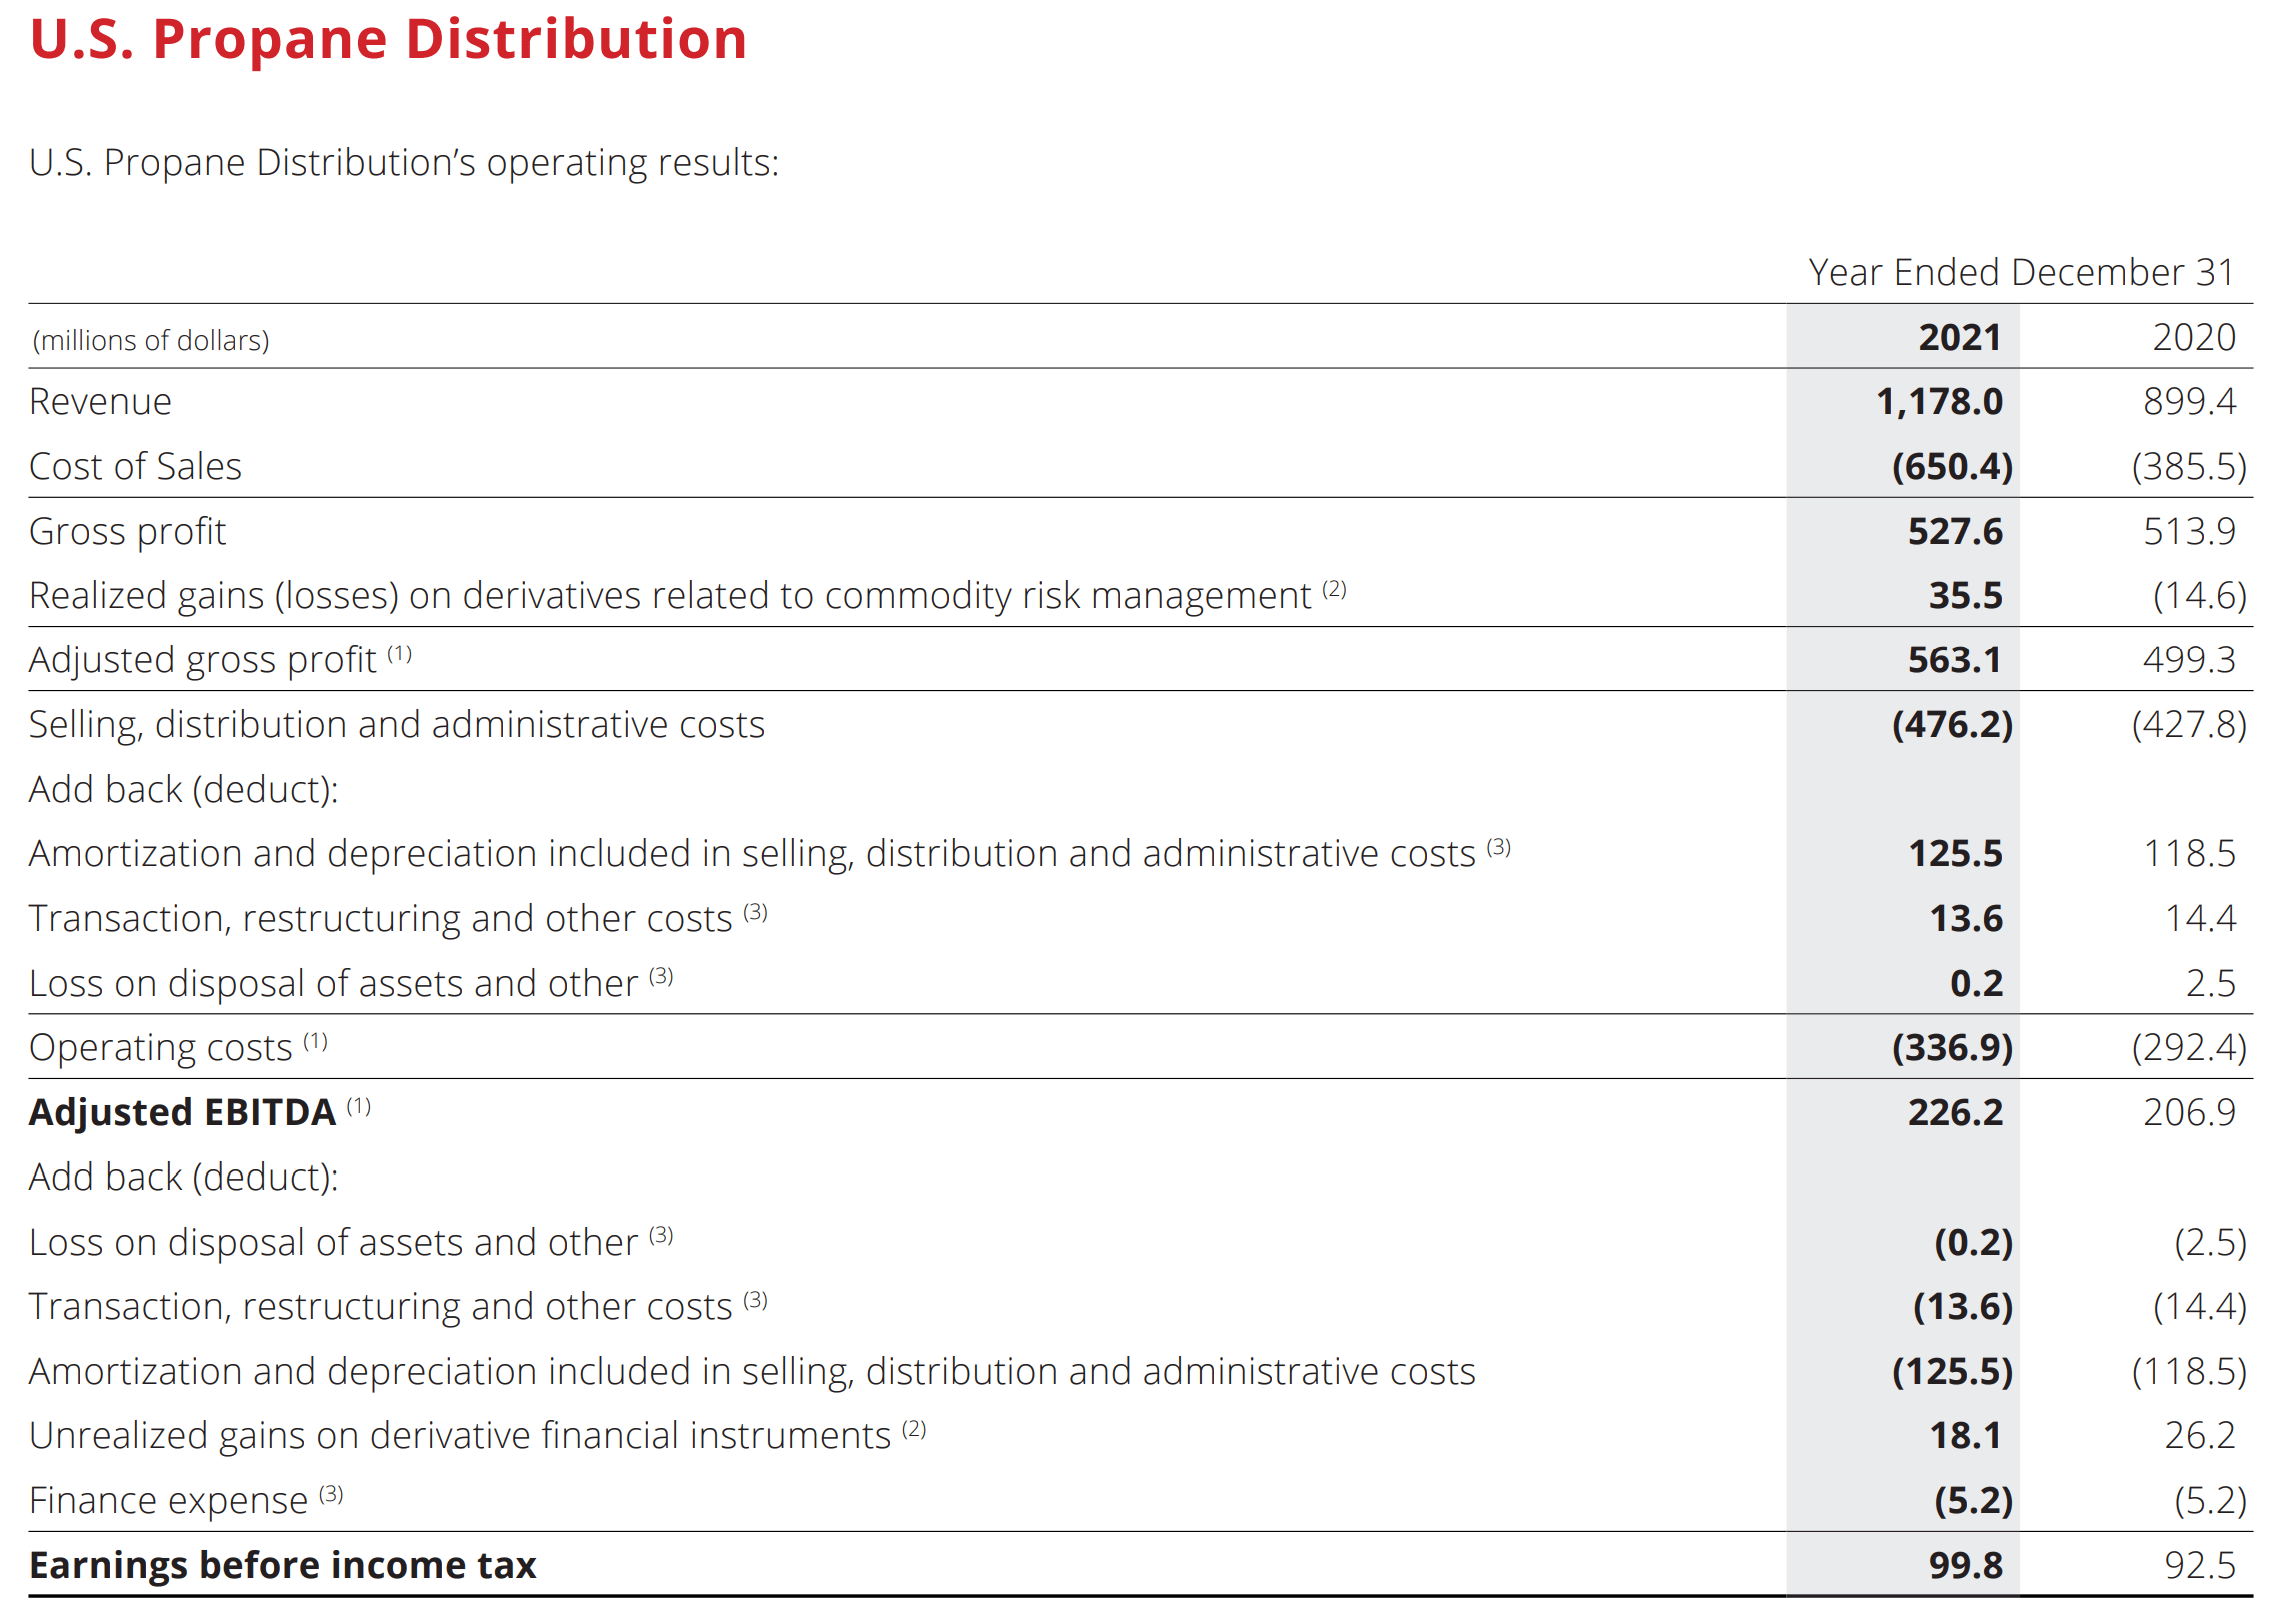
For comparison purposes, Figure 11 shows Suburban Propane’s summary financials for 2020 and 2021. Suburban Propane generated US$1.11 billion and US$1.29 billion in revenues for the two years respectively, for EBITDA margins of 22.9% and 21.4%. This is roughly in line with Superior Plus’ EBITDA margin, meaning the two businesses are roughly similar (as expected), but account for costs differently. One possible explanation for the difference is that Superior Plus may have included some service costs in the COGS figure, while Suburban just displayed the cost of fuel sold. However, it is still notable that Superior Plus’ U.S. business had a 2% lower EBITDA margin than Suburban in 2021, when 2020 was roughly identical.
Figure 11 – Suburban Propane EBITDA margins (Suburban Propane 10K)
Figure 12 shows Superior’s Canadian segment. We see that adjusted gross margins were 43.1% and 31.9% for 2020 and 2021. Adjusted EBITDA margins were 21.1% and 14.8%. While the Canadian business has substantially lower gross margins than the U.S. business (31.9% vs. 47.8% in 2021), the EBITDA margin difference was not as large (14.8% vs. 19.2%). This makes intuitive sense, as the U.S. business caters to small customers, which allows for higher gross margins, but requires more G&A support.
Figure 12 – SPB Canadian business (Superior Plus 2021 annual report)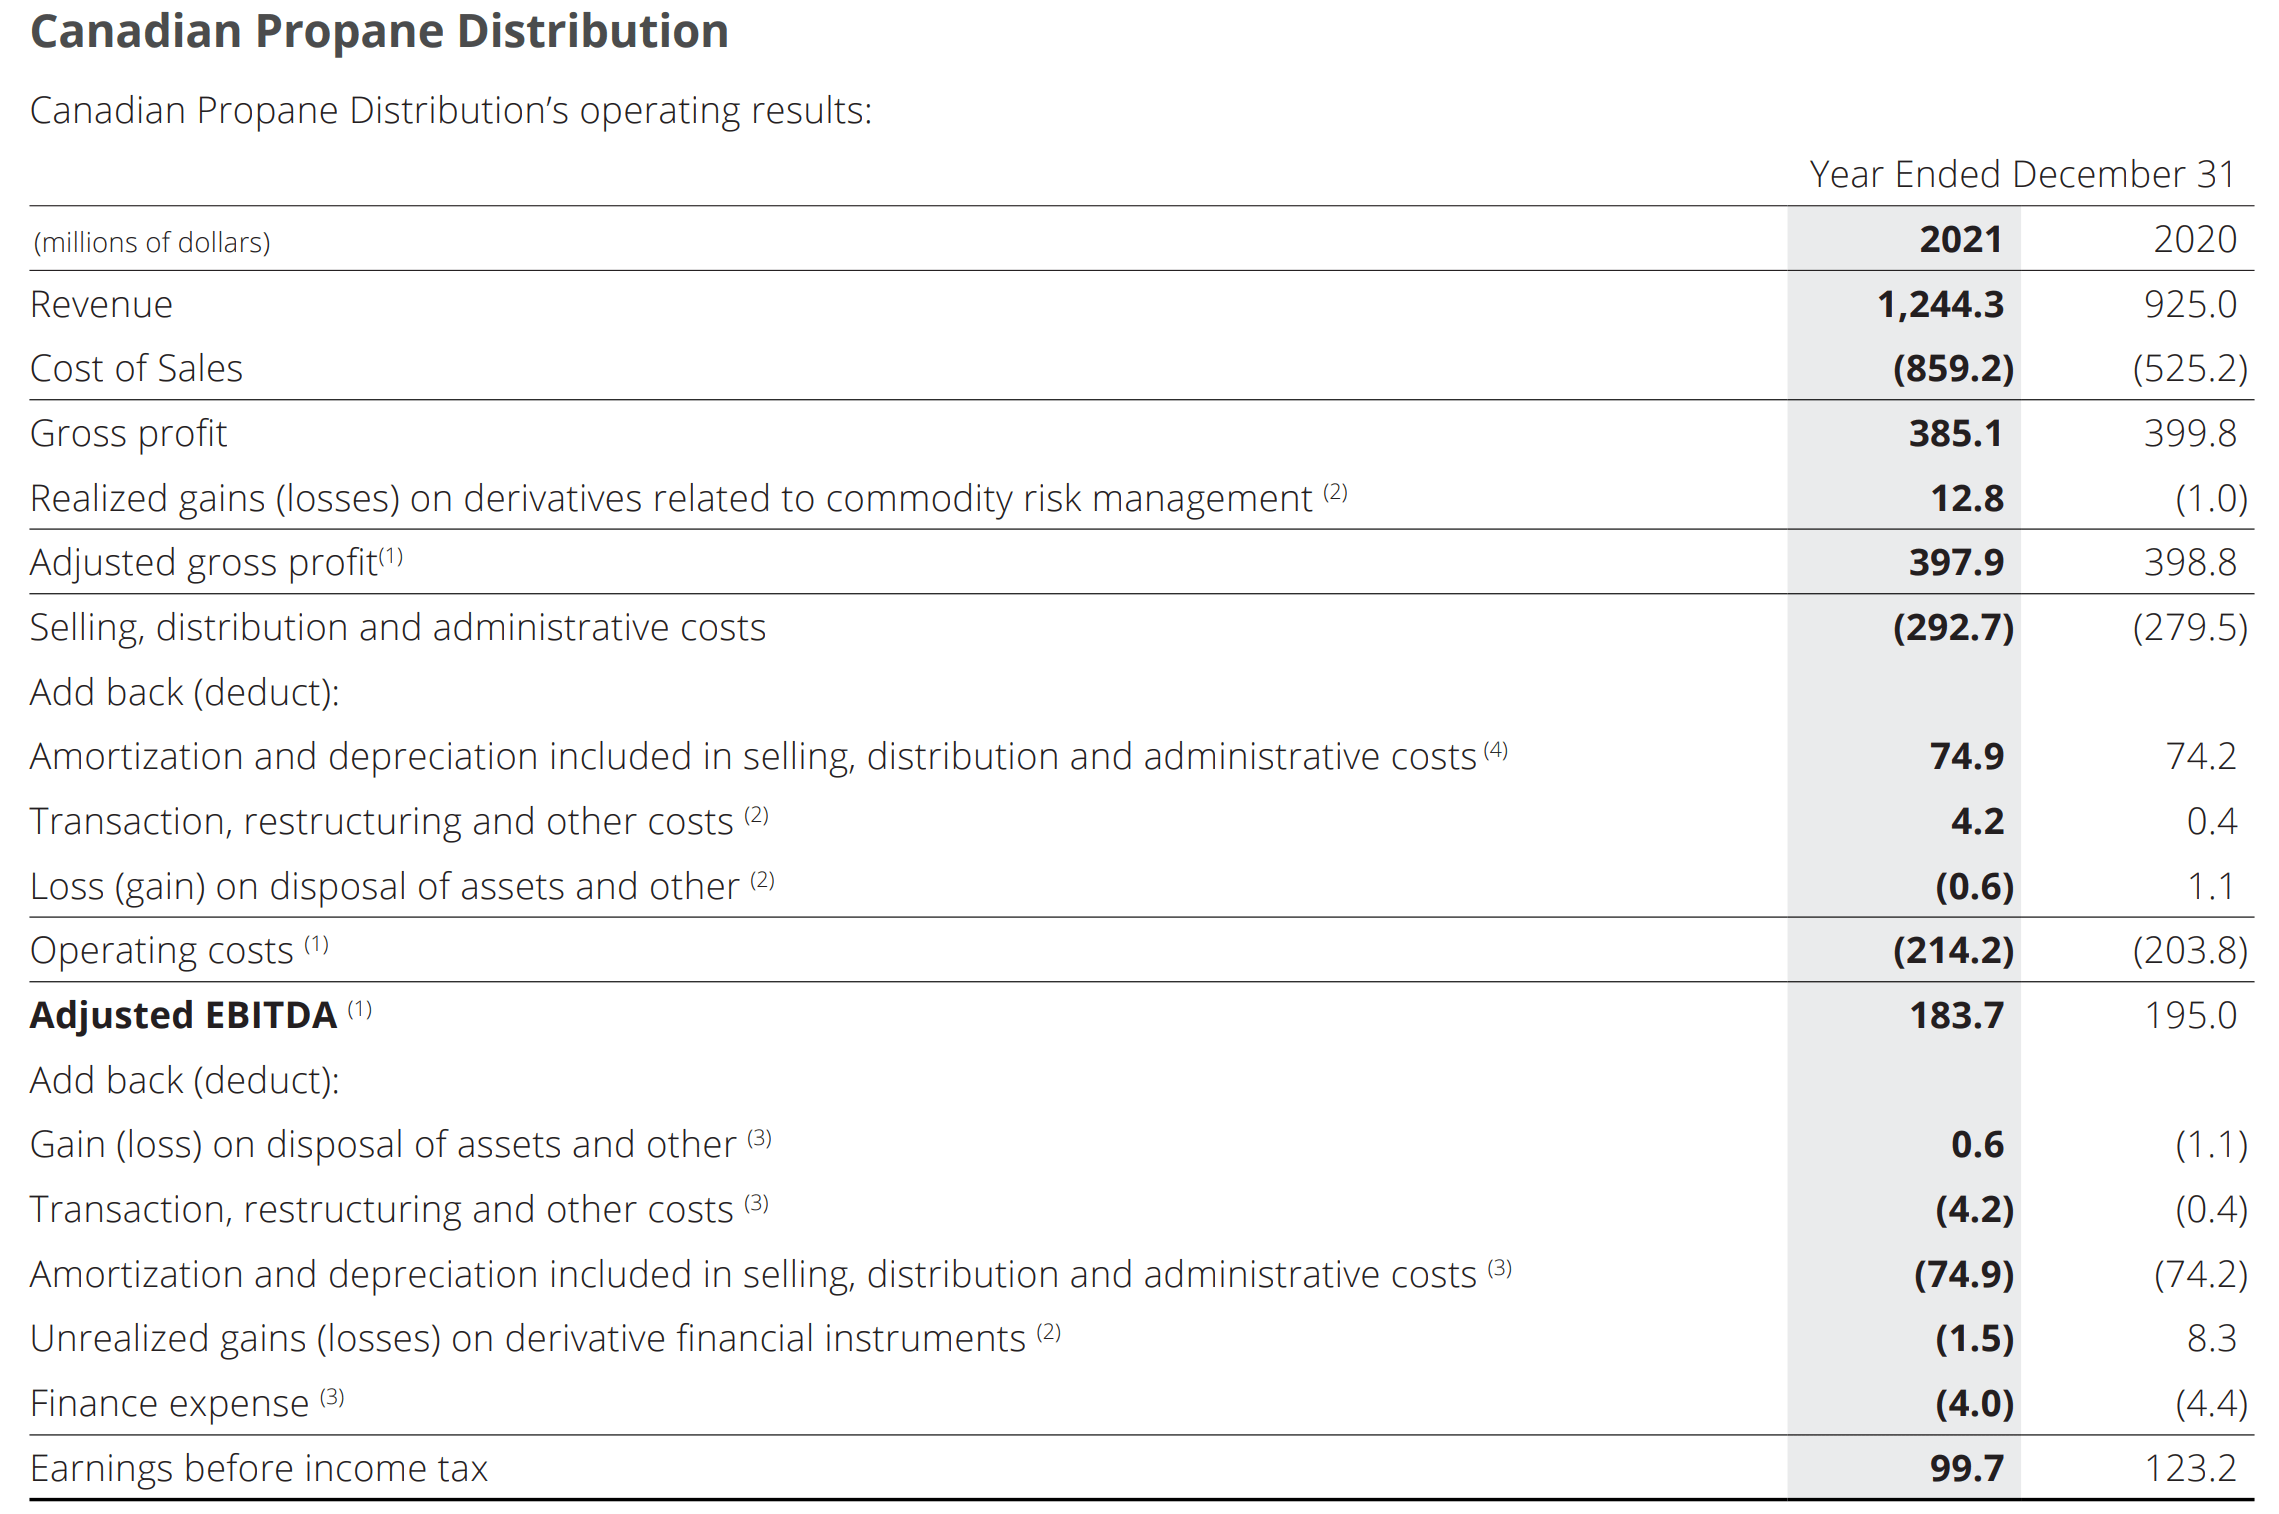
Overall, given the higher margins and consolidation potential, it makes strategic sense that management is focused on finding acquisitions in the U.S. retail distribution market.
Latest Quarter Was A Mixed Bag
On August 9th, Superior reported its Q2/2022 earnings. Revenues grew by 72% YoY to $629 million, leading to gross profit of $194.5 million (31% GM). However, to be consistent with the financial analysis above and peers, adjusted gross profit (including gains/losses on fuel hedges) was $200.9 million or 32.0%.
Adjusted EBITDA in the seasonally weak quarter was $25.6 million, a decrease of 19% YoY. The company reported a much wider net loss of $85 million in the quarter vs. $36.1 million in Q2/2021. This was blamed on “a loss on derivatives and foreign currency translation of borrowings compared to a gain in the prior year quarter, higher SD&A and taxes”. SD&A grew 40% YoY to $249 million primarily due to completed acquisitions and inflation in labour costs (Figure 13).
Superior reiterated guidance for full year Adjusted EBITDA between $425 to $465 million, or roughly 7-17% YoY growth from $398 million in 2021. Note, if we look on a 6 month basis, adjusted EBITDA of $276 million is $33 million ahead of 2021. So Superior already has the low-end of guidance ‘in the bag’, assuming the second half is the same as last year.
Figure 13 – Q2/2022 financial overview (Superior Plus Q2/2022 report)
On the positive side, revenues and gross profit grew strongly YoY. As commodity prices rallied significantly and Superior had deployed $800 million in acquisitions in the past 18 months, this is to be expected. However, on the negative side, it is concerning that adjusted EBITDA actually fell YoY in the second quarter. Moreover, if we take the high of management’s guidance and assume Superior Plus generates $465 million in Adjusted EBITDA in 2022, this is still only $67 million in additional EBITDA versus $800 million spent in acquisitions (11.9x EV/EBITDA), which does not jive with figure 8 above where management targets acquisitions at 8.8x EV/EBITDA. Granted perhaps acquisitions need more time to be brought online, but judging by performance so far, management’s $700-750 million EBITDA by 2026 seems a little out of reach.
Valuation
In terms of valuation, Superior Plus trades at a forward P/E multiple of 21.2x, and forward EV/EBITDA multiple of 9.8x (Figure 14). The best comparison for Superior Plus would be Suburban Propane, which trade at 8x forward EV/EBITDA. P/E ratios are not comparable as SPH is an MLP and pays no corporate taxes.
The difference in valuation between SPB and SPH could be due to the fact that Superior Plus is actively consolidating and growing, while growth at Suburban Propane is more muted as it is an MLP structure focused more on monthly distributions (to be fair, SPH do make small tuck-in acquisitions as well). However, a 2x difference in EV/EBITDA does seem rather large.
Figure 14 – SPB valuation (Seeking Alpha)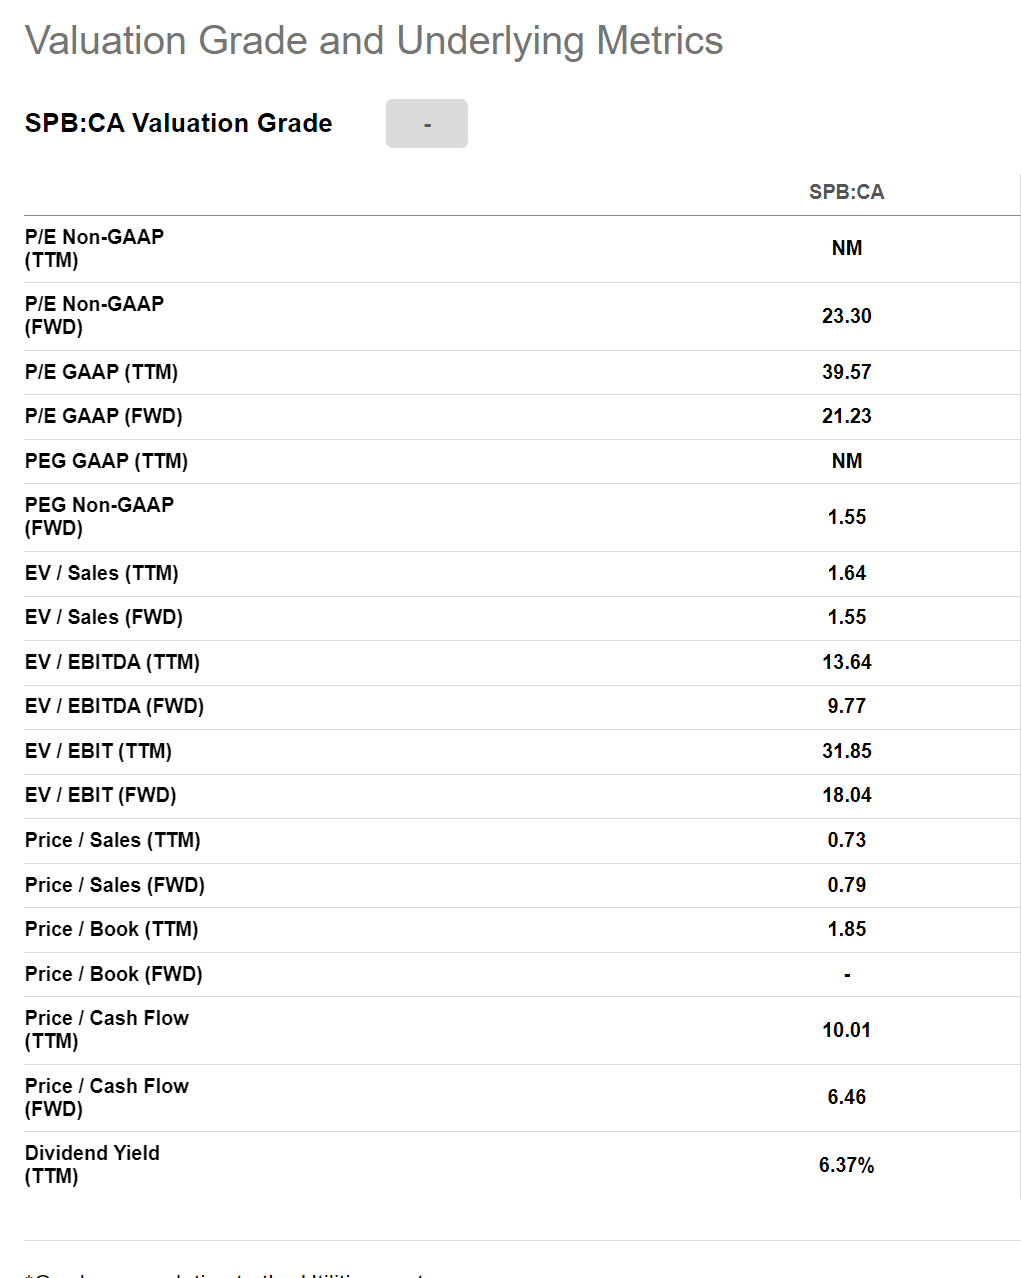
Superior Plus also pays a $0.06 monthly dividend, which computes to an annual 6.4% dividend yield. Superior Plus generated adjusted operating cash flows (“AOCF”) of $292 million in 2021 (Figure 15), or $1.41 / share.
Figure 15 – SPB adjusted operating cash flow (Superior Plus 2021 annual report)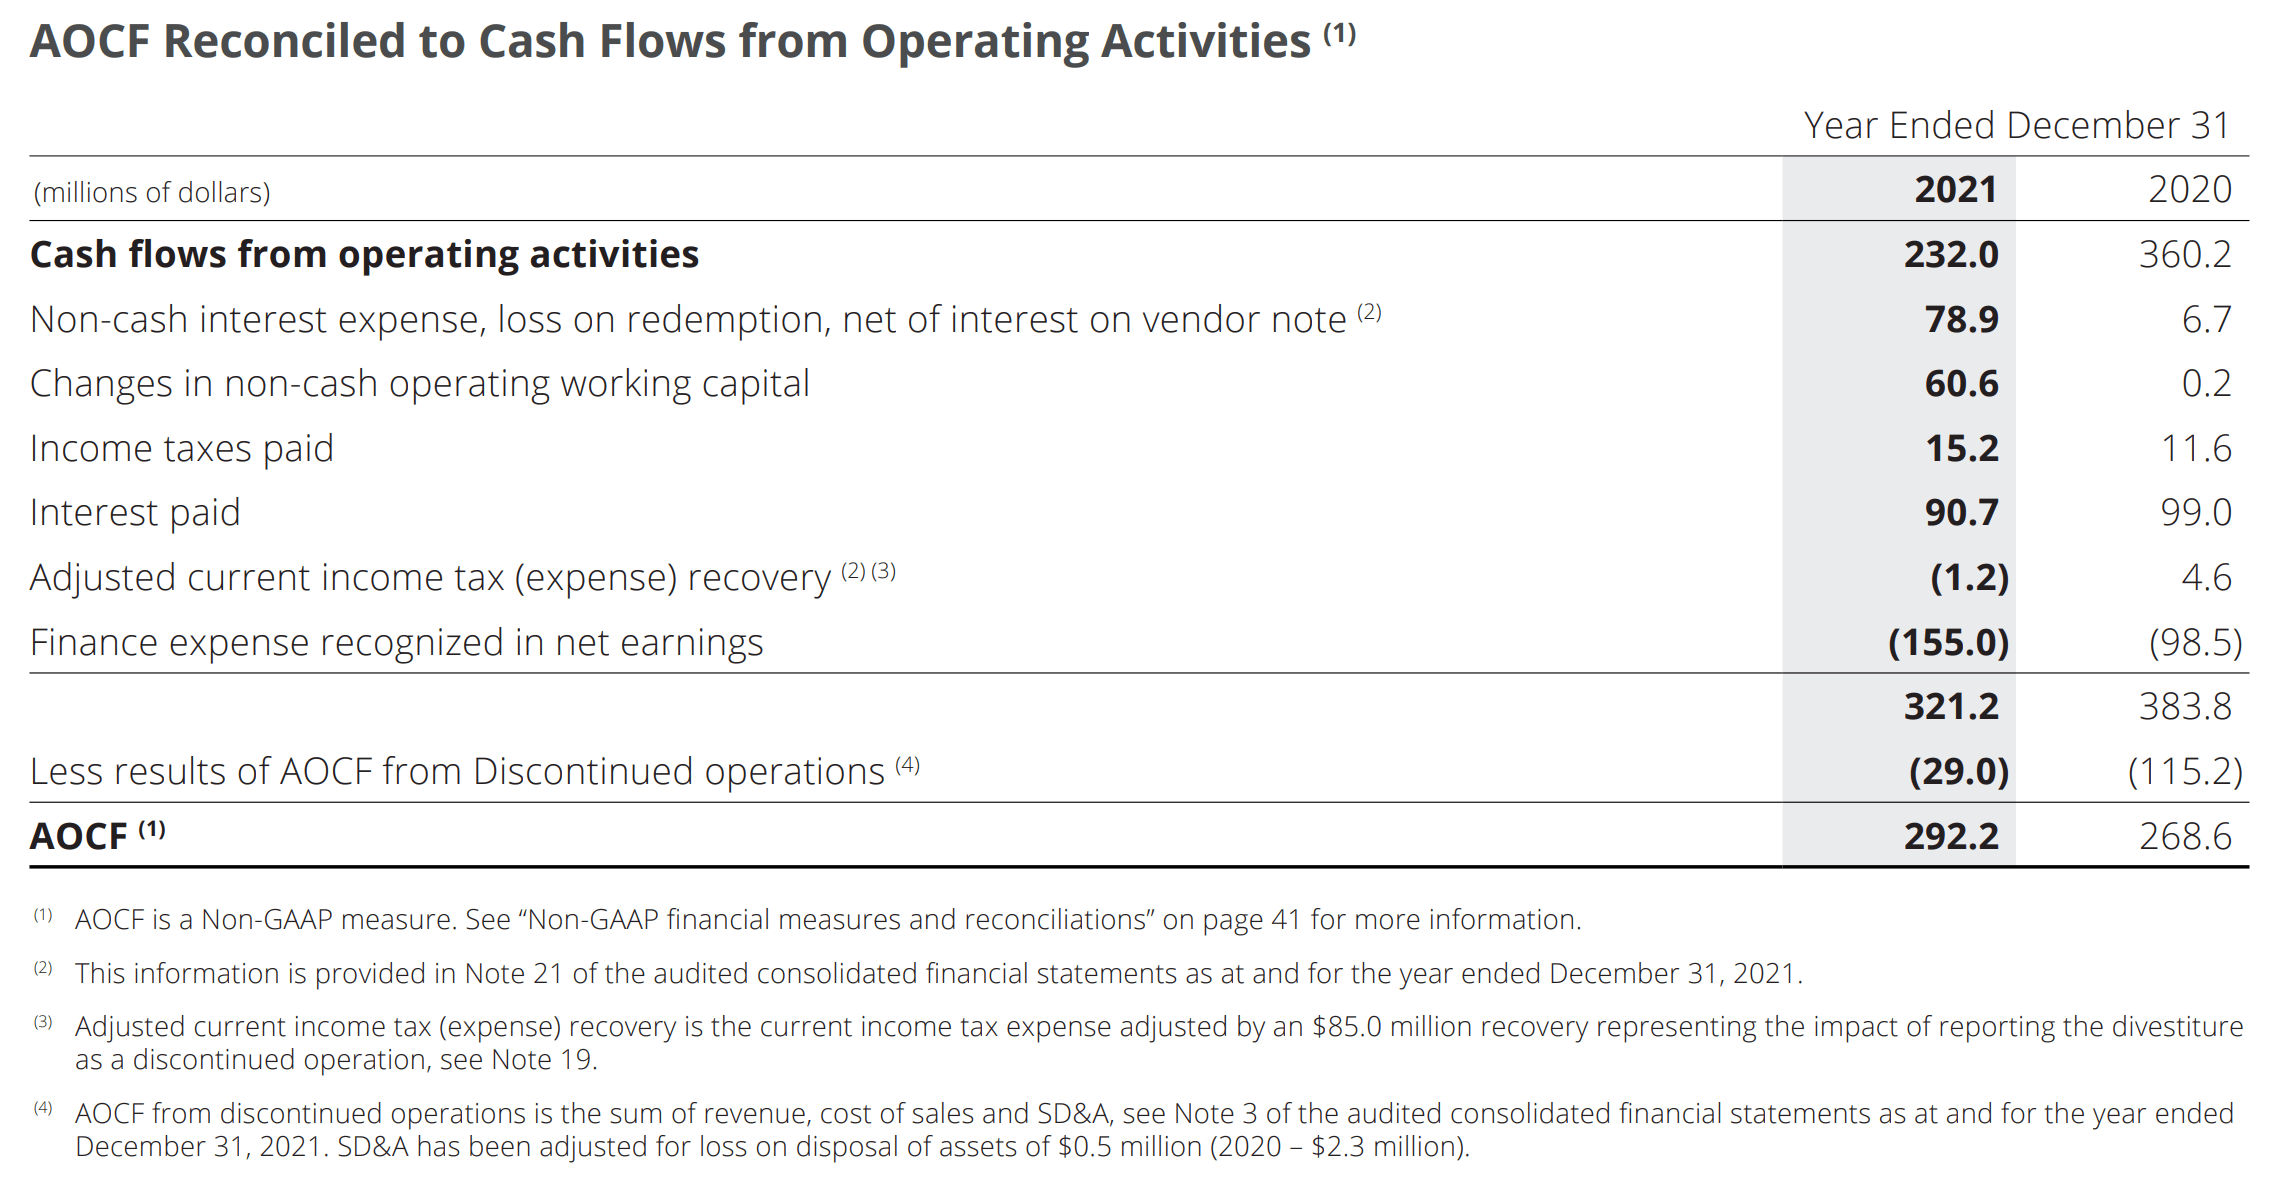
YTD, from figure 13 above, we see that AOCF is ahead of 2021’s rate by 20.9%. Assuming this YoY gain is sustained, Superior Plus could generate north of $350 million in AOCF, which should cover the dividend of ~$148 million plus expected capital expenditures of $130-150 million (Figure 16).
Figure 16 – SPB capex and FCF conversion (Superior Plus investor presentation)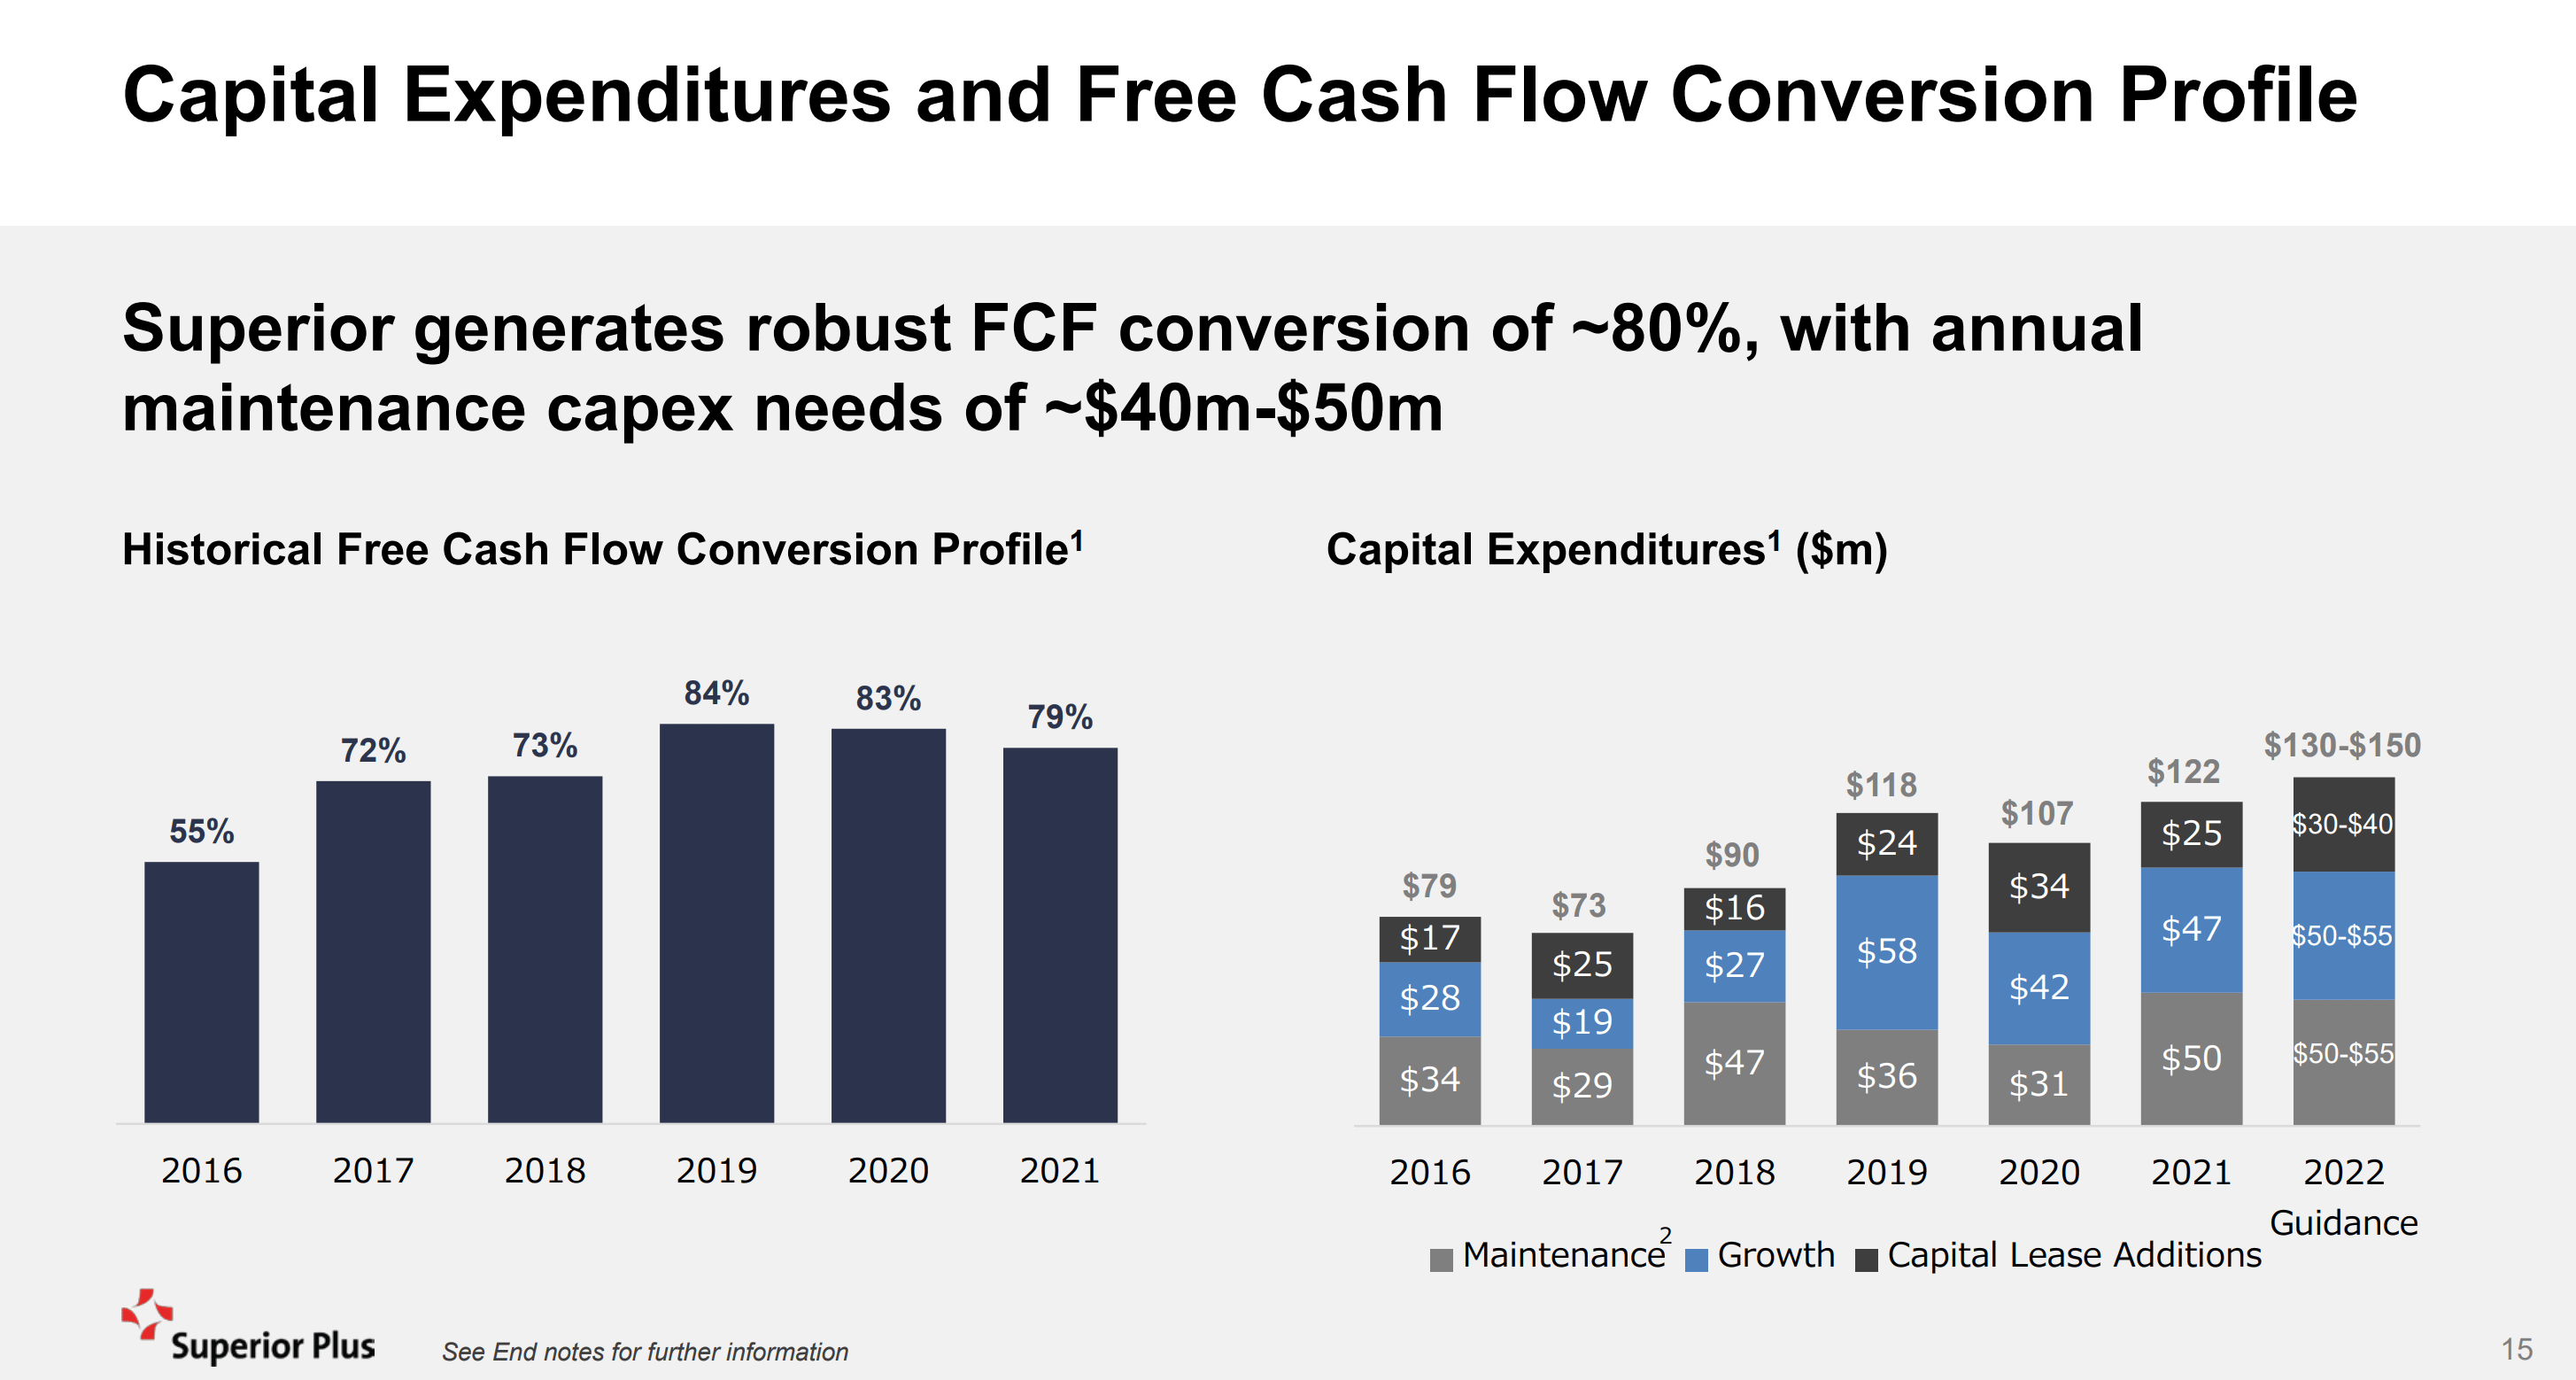
However, one note of caution is warranted. Companies cannot spend ‘adjusted’ cash flows, and investors cannot spend ‘adjusted’ EPS. On a reported basis, H1/2022 net operating cash flow of $225 million is actually trailing the $230 million figure from H1/2021. If this dynamic plays out into year-end, it is possible that Superior Plus could generate full year operating cash flows below 2021’s $232 million figure. In that case, cash flows would not be sufficient to cover the dividend ($148 million) and expected capex ($130-150 million).
One final note on the dividend, Superior Plus paid its monthly $0.06 dividend even during the COVID-19 pandemic, showing management’s commitment to it. So most likely, the company would simply take on additional debt to fund the dividend, even if there is a cash flow shortfall.
Preferred Shares Stand Ahead Of Equity Investors
While Superior Plus’ overall business share some attractive characteristics with Suburban Propane’s (U.S. business has similarly strong EBITDA margins), one big impediment in my eyes is that Superior has a non-favorable capital structure. In addition to $1.7 billion in debt, Superior Plus has US$260 million in preferred stock outstanding, issued to Brookfield Asset Management in 2020.
The preferred stock pays an annual 7.25% dividend and are exchangeable into 30.0 common shares. If the preferred shares are not redeemed by 2027, the dividend rate will increase by 0.75% per annum up to 10.25%. My understanding is that Superior Plus issued the preferred stock to Brookfield to shore up the balance sheet during COVID-19, and also to find a deep-pocketed partner to fund its U.S. consolidation strategy.
Unfortunately, the preferred shares rank ahead of common shareholders in many respects. For example, if you look at the consolidated financials in figure 9, while SPB generated $17.2 million in net income from continuing operations in 2021, the preferred stock was allocated $23.8 million (from the 7.25% yield) while common shareholders suffered a $6.6 million loss.
Also dividends on the preferred shares are cumulative, meaning if the business runs into trouble, common share dividends are cut first before preferred dividends; and the company must pay out ‘accumulated’ preferred dividends before reinstating common dividends.
Risks
One of the biggest risk to Superior Plus is its high debt levels. As of March 31, 2022, Superior Plus had $1.7 billion in debt outstanding plus $200 million in lease liabilities for a pro-forma current leverage ratio of 3.7x (Figure 16). While there are no near-term maturities, the high levels of debt outstanding is a worry, particularly as we see the economy start to slow down.
Figure 17 – SPB has high debt (Superior Plus Q2/2022 report)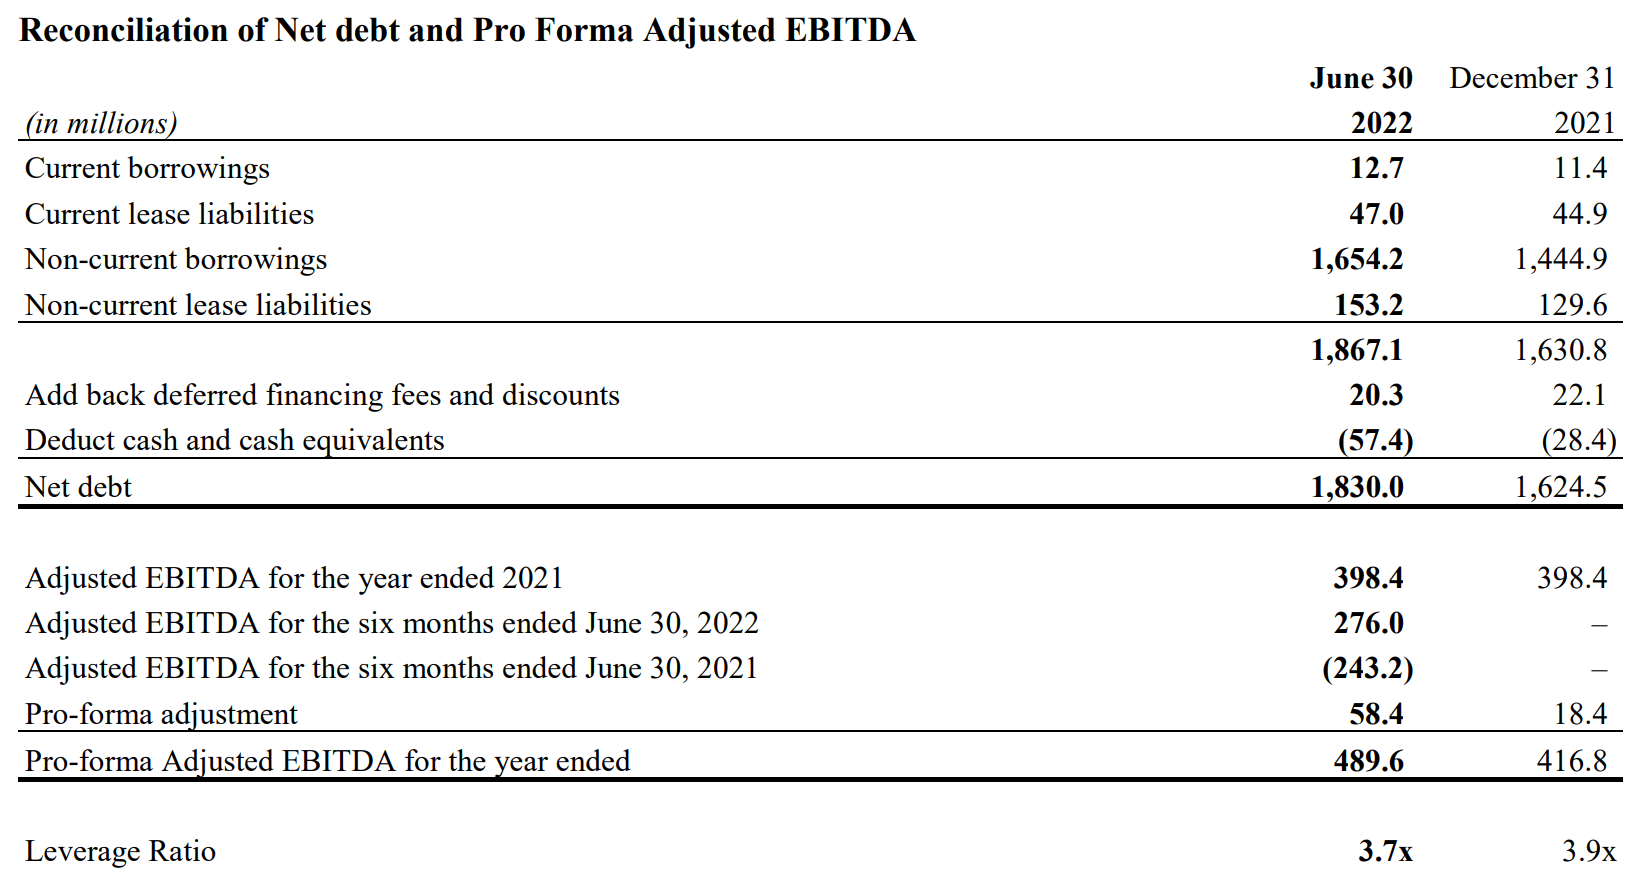
Another risk is that Superior Plus becomes a deal junkie and overpays for acquisitions. Even in the propane distribution business, there is a good example, Ferrellgas (“FGP”). Ferrellgas grew by debt-fueled acquisitions, becoming the #2 distributor in market share. However, the underlying business couldn’t sustain the more than US$2.5 billion in debt, and the company was delisted from the NYSE in 2019. Today it trades on the pink sheets, awaiting a financial restructuring.
Technicals Signal Caution
While Superior Plus is in the same business as Suburban Propane, its technical profile is substantially weaker. Since peaking in mid 2021, SPB has been making a series of bear-flags (i.e. sharp decline followed by sideways consolidation). It recently broke from one such bear flag on the mixed Q2/2022 earnings, with a mechanical MACD sell signal triggered (Figure 18).
Figure 18 – SPB price breaking down (Author created with price chart from stockcharts.com)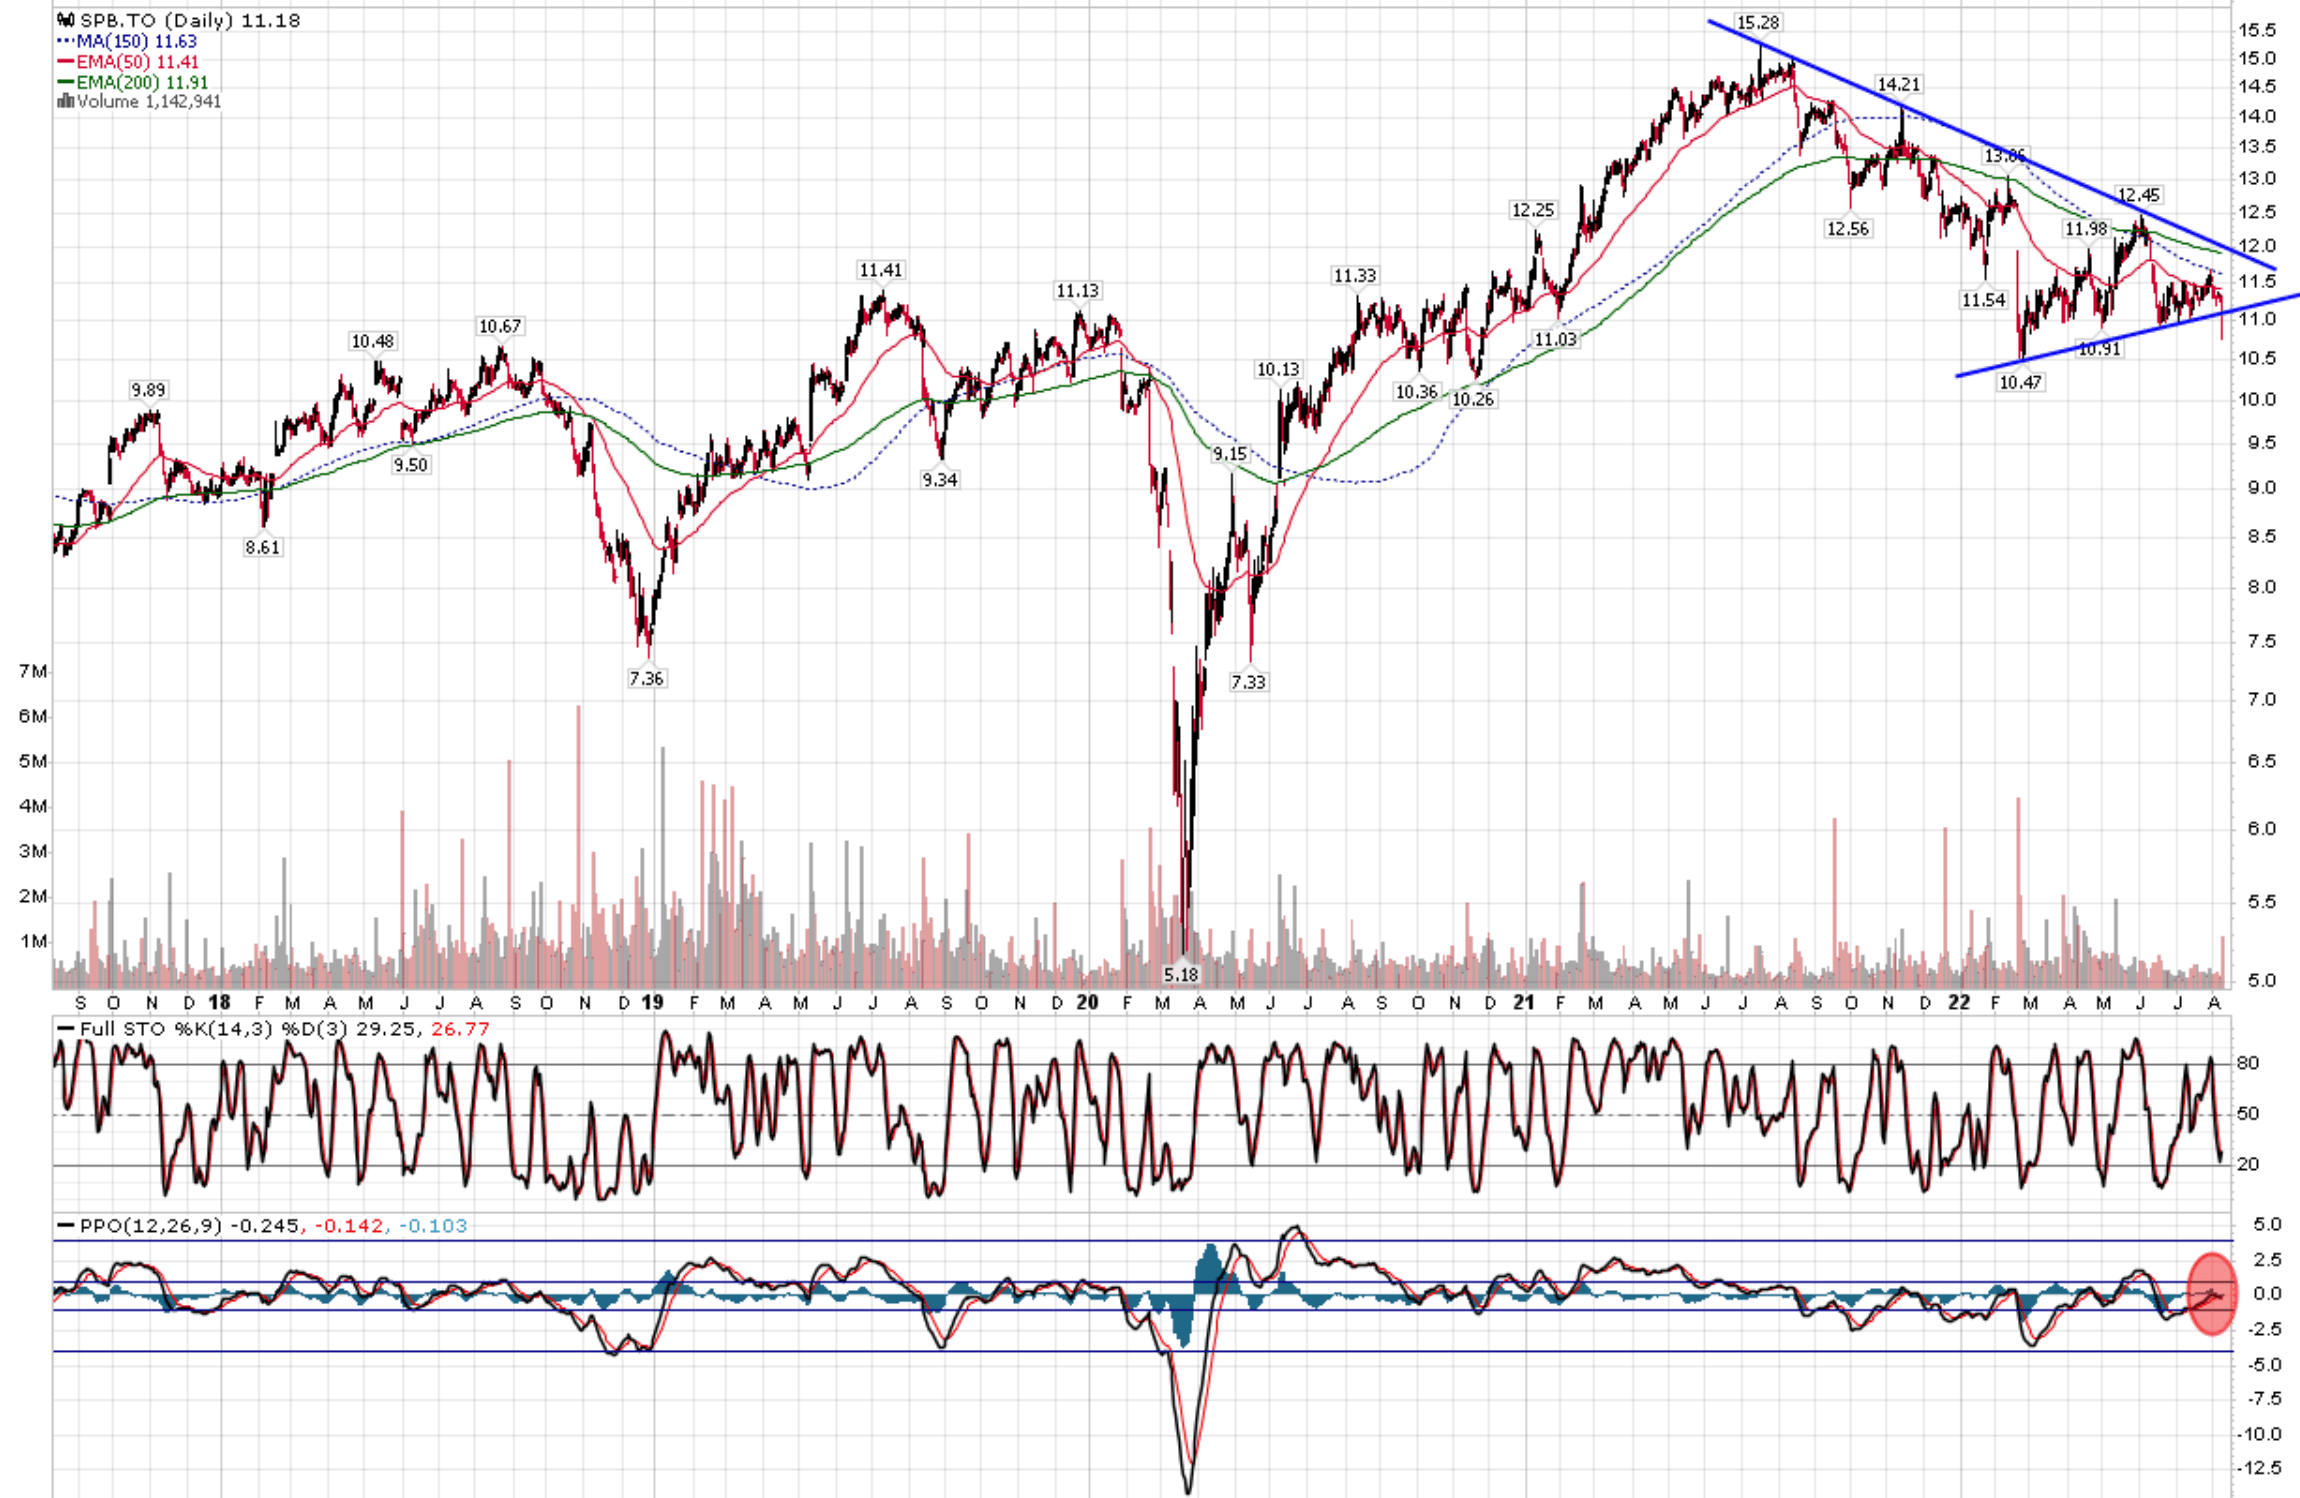
Conclusion
In conclusion, while Superior Plus is in the same business as Suburban Propane, and shares many of the same business qualities that I find attractive, I have reservations about an investment in Superior Plus. First, it trades at a 2x higher EV/EBITDA multiple than Suburban. Second, my main fear is that management will overpay for acquisitions in an attempt to consolidate the industry. Also, with such a heavy debt load (3.7x leverage), the business does not have much margin of safety. Finally, I don’t like the capital structure with the convertible preferred shares that reap the upside (convertible), but are protected on the downside (cumulative dividends).
Be the first to comment