

Marje/E+ via Getty Images
Introduction
I recently covered Equity LifeStyle Properties (ELS), a similar stock to Sun Communities (NYSE:SUI). I prefer ELS over SUI right now because both its yield and dividend growth are slightly higher. However, Sun Communities is in no way worse, and I know for a fact that a lot of my Dutch followers who are clients of a certain popular low-cost broker cannot buy ELS. That said, SUI isn’t just an alternative when ELS isn’t an option, but a fantastic long-term investment that doesn’t need to hide from its peers. In fact, it has outperformed the average REIT with a wide margin and delivered consistent value through business cycles. In this article, I will discuss why I like SUI and why it deserves a lot of attention from both income-oriented investors as well as dividend growth investors like myself.
Sun Communities – A Great Business In A Red-Hot Housing Market
As I haven’t bought ELS yet, I own one REIT: Public Storage (PSA). I keep mentioning this to explain my investment style, not to pump the stock, of course. The company operates in a fast-growing market. The highly fragmented market allows the company to aggressively buy new properties and to add value through price hikes and improved services. I believe that Sun Communities is different but similar in a sense.
The real estate market is fragmented like no other. Companies with an attractive business plan are able to exploit this. That’s where Sun Communities comes in. The company has a $20.7 billion market cap, which makes it one of the largest REITs in the US. In this case, the company is focused on residential real estate.
The company has an impressive portfolio consisting of 602 properties in 39 states and Ontario, Canada. 50% of revenue is provided by manufactured housing. RVs account for 31% of sales. The gap is filled with revenue from the company’s many marinas. This means two things. The company operates in lower-cost residential real estate and it is somewhat dependent on recreational demand, although it’s not comparable to the income volatility of i.e., a hotel operator or an airline as its assets have long-term leases.
Sun Communities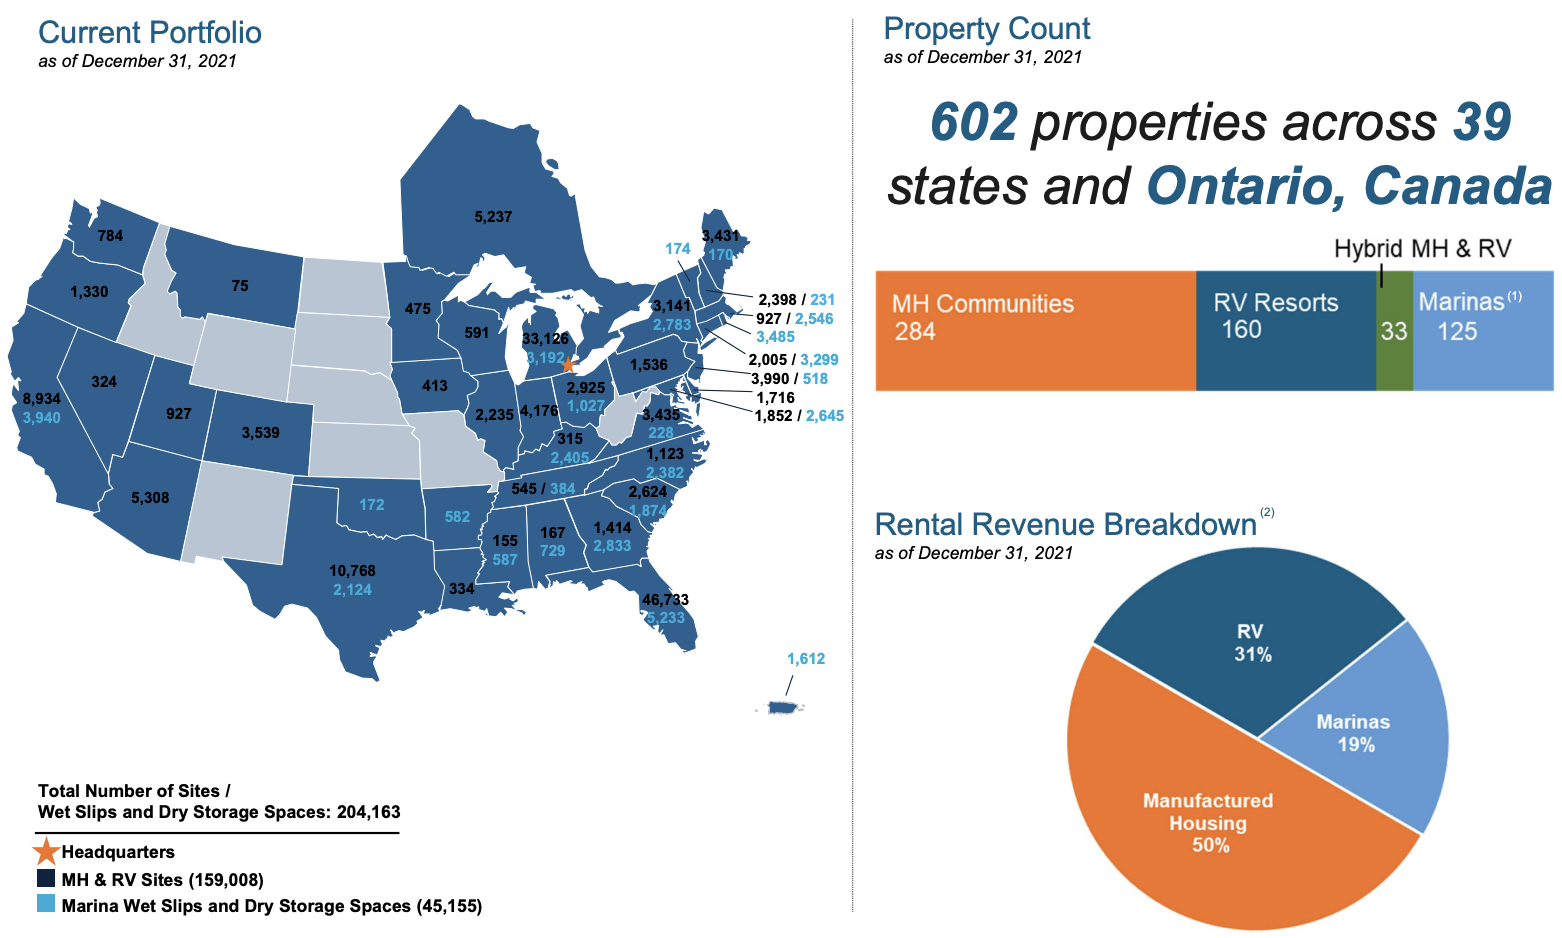
I’ve made this argument a lot of times in the past, but now it matters more than “ever”. The US housing market is red hot. In a recent homebuilding article, I explained that it’s nearly impossible for average incomes to find housing in certain markets.
The Wall Street Journal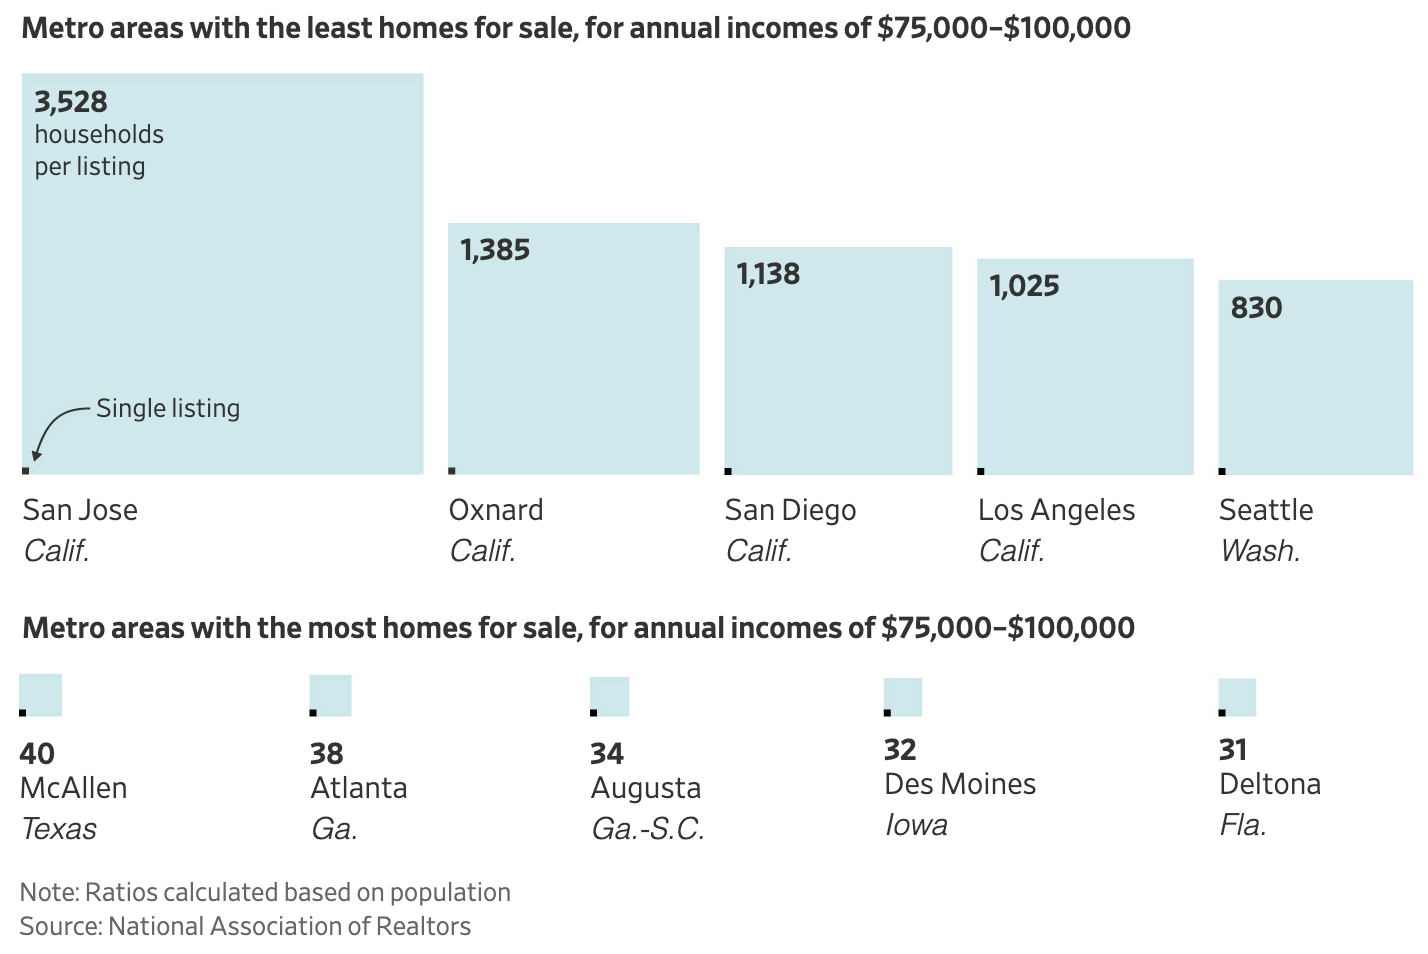
The company’s own data shows that the price is roughly $1.00 lower per square foot compared to the average non-MH rental option. However, the average footage is higher. MH communities are outside of big cities, which means more room. On average, the rent is roughly $700 lower per month.
Sun Communities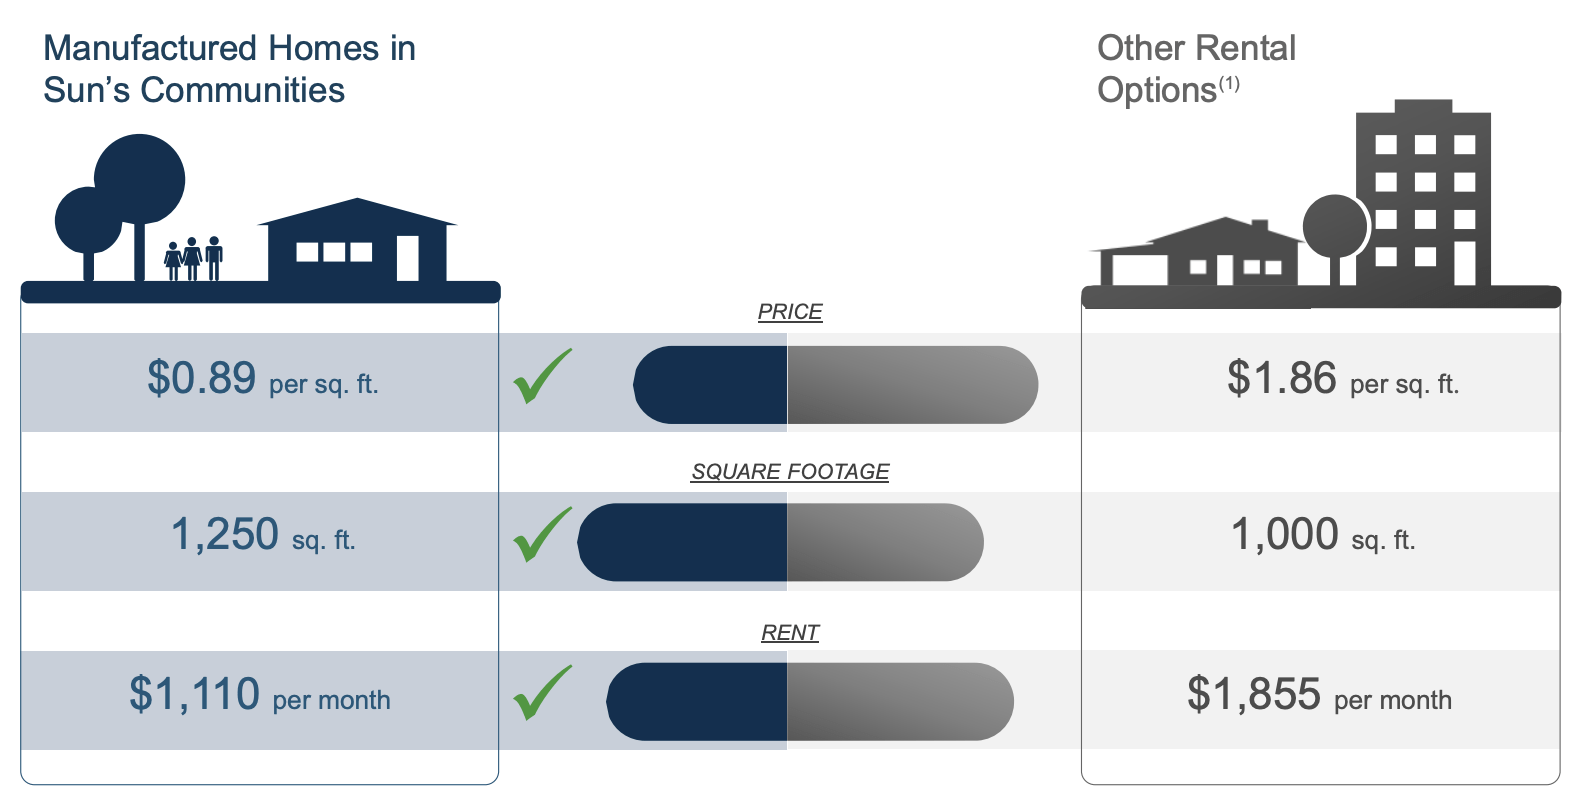
There are obviously drawbacks. In most cases, people want to live in a city or close to their jobs (often in cities). This is why these communities mainly target people close to, or in retirement.
It’s also nobody’s dream to live in an MH community. But that’s OK. MH housing has become much more sophisticated. It goes far beyond the traditional “trailer park” as the quality is better and people are able to work from home – even after the pandemic.
So, the value proposition is getting better. While I do not live in the US, I spent a lot of time visiting SUN’s properties (like this one) virtually, looking at offers and alternatives, and I’m impressed by the value this company brings to the table for a wide range of different people.
With that said, the company has a lot of growth and a nice yield.
Sun Communities – Yield & Growth
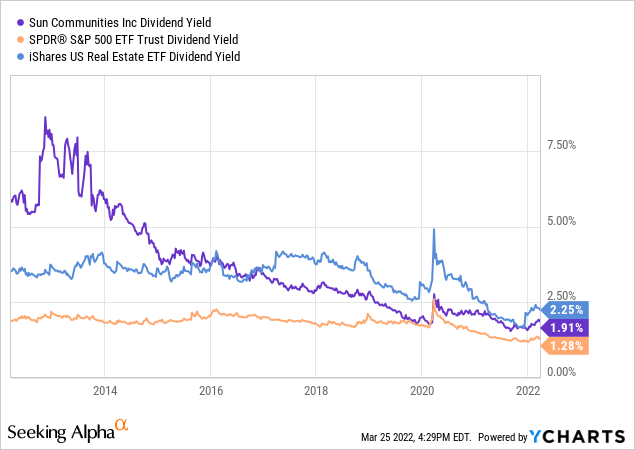
Sun Communities announced a $0.83 quarterly dividend on December 1st, 2021. This implies an annual dividend of $3.32, which implies a 1.91% dividend yield. This is roughly 60 basis points above the S&P 500 yield and a bit below the average REIT yield using the iShares US Real Estate ETF (IYR) as a benchmark.
This yield is OK, but it shouldn’t be lower, in my opinion.
Dividend growth is decent but nothing that gets me very excited. Dividend growth was very low and inconsistent in the years after the Great Financial Crisis. Back then, the company invested a lot in new properties, which took priority over dividends. And that’s more than fine. In 2018, dividend growth started to pick up. Over the past 5 years, compounded annual dividend growth is 5.0% according to Seeking Alpha. Seeking Alpha rates SUI dividend growth B+, which is fair as the sector (real estate) median is just 2.1%.
TIKR.com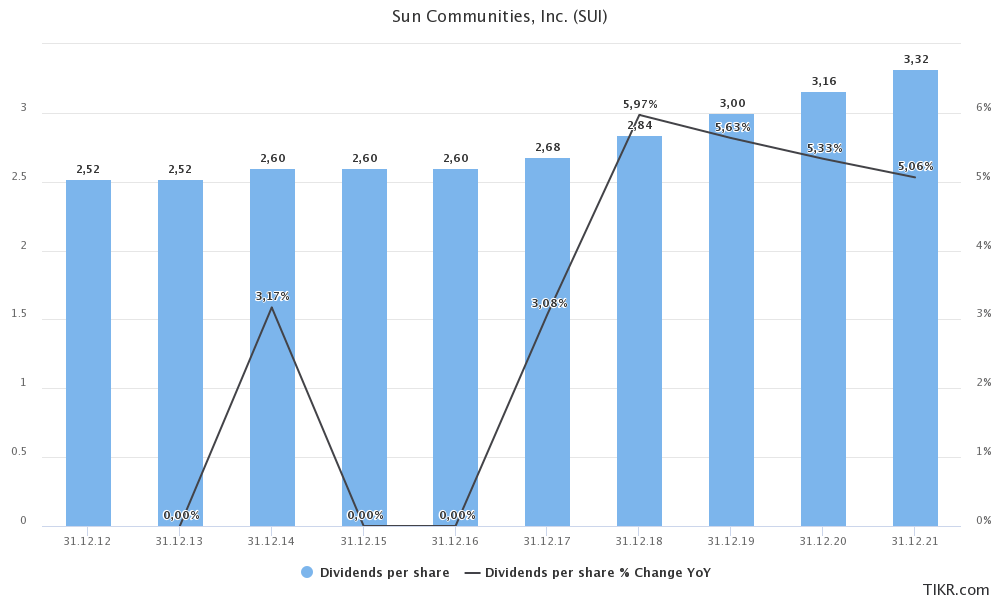
The reason why the dividend yield is so low is that investors are not letting the yield rise. After all, a company can only influence the annual dividend. The yield (based on the stock price) is determined by supply and demand.
In this case, we’re dealing with a fast-growing REIT. In 2010, Sun Communities owned 136 properties with 47,683 sites. This number has grown steadily to 602 properties and more than 200,000 sites as of 2021. Total acquired properties are valued at $9.6 billion. The company is now expanding into the United Kingdom through the acquisition of Park Holidays UK, the nation’s second-largest park owner and operator. The purchase price is $1.3 billion and it’s expected to close in mid-March of 2022. The deal adds 15,300 sites, 2,400 sites used for expansion, and a total of 42 holiday parks.
The graph below shows that Sun Community is among the top growers in the US REIT industry. Net operating income (“NOI”) has grown by 5.0% per year since 2000. That’s 10 basis points above the self-storage industry (which I own through PSA) and 20 basis points above its own industry average. Multi-family REITs (on average) have grown NOI by 2.4% per year, which isn’t bad either but way below the MH average.
Sun Communities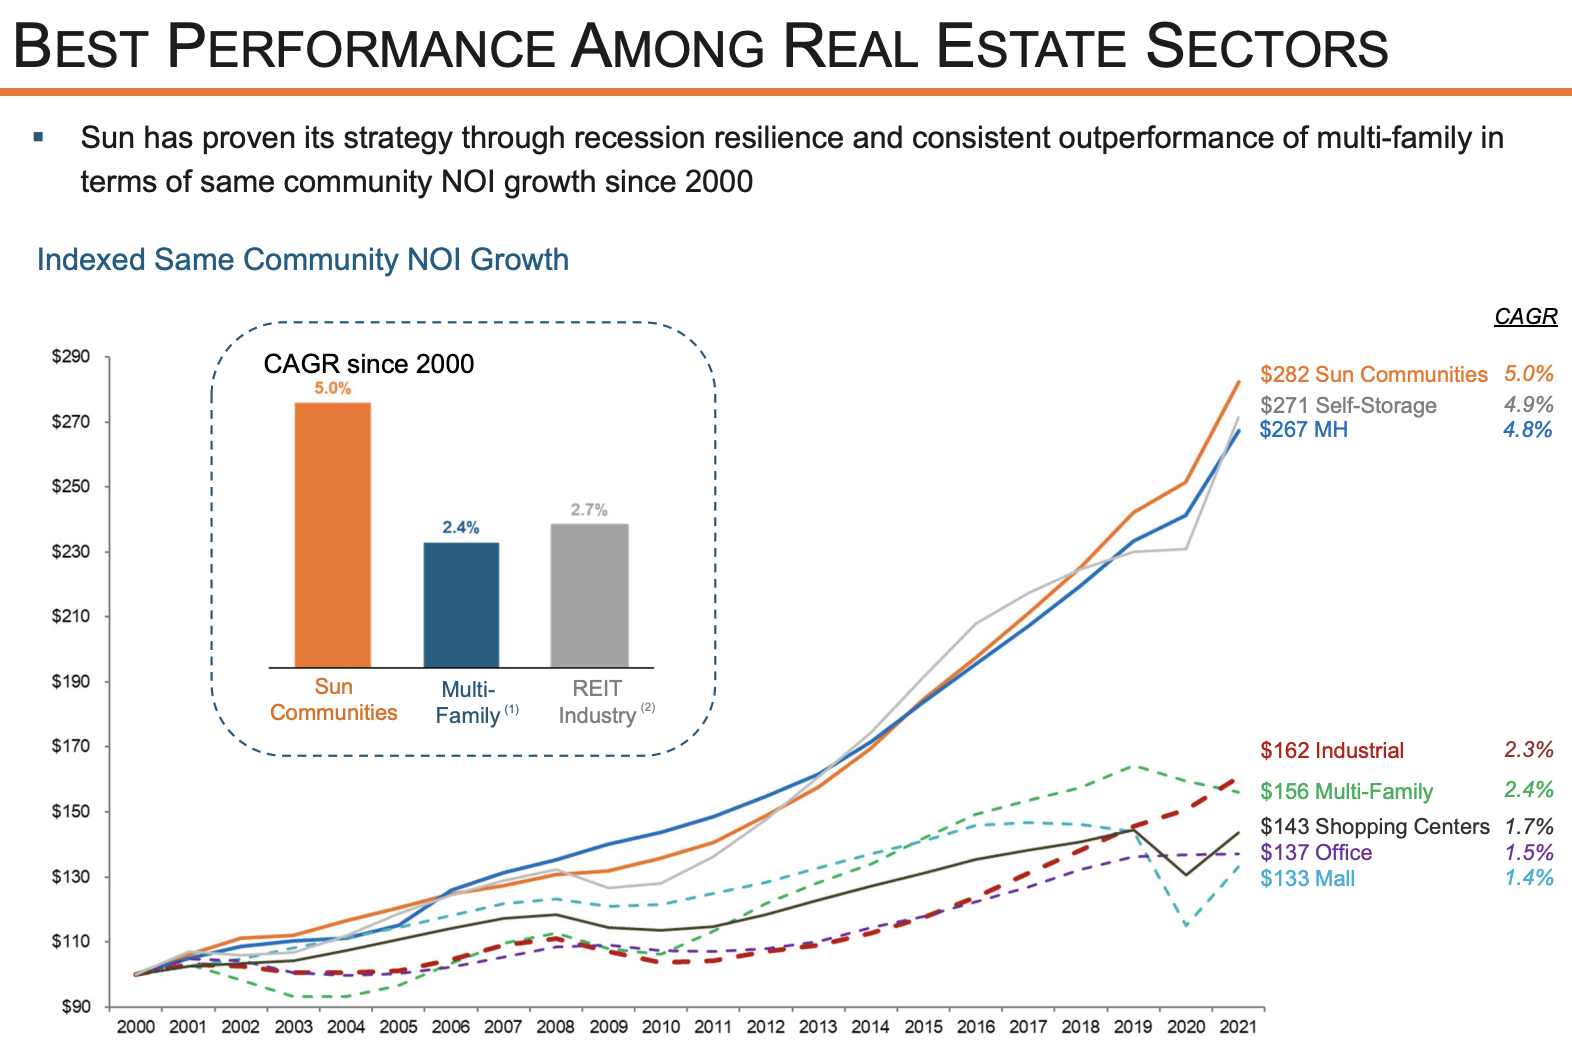
This performance is supported by internal and external growth. Internally, the company increases rent by 2-4% per year with an average occupancy rate of 96.6%. 77% of its communities have a 98%+ occupancy rate. The company believes that it can grow the average occupancy rate by 200 basis points. Moreover, the company has 7,700 available sites for expansion with a target internal rate of return of 10-14%.
Externally, the company is aiming to maintain a strong acquisition pipeline as I already briefly mentioned. Since early 2020, $4.4 billion in properties has been added. The company is targeting 3-5 new development projects per year with an internal rate of return of 7-9%.
With that said, let’s look at how growth is financed.
Sun Communities Balance Sheet
An aggressive acquisition strategy needs funding. In the case of SUI operating cash flow has improved from $133 million in 2014 to $753 million in 2021. This is the result of a significantly higher number of properties and price hikes. The problem is that operating cash flow is not sufficient to fund acquisitions internally. For example, the company hasn’t spent less than $400 million per year on acquisitions going back to 2014. Last year, total (cash) acquisitions were $2.3 billion. The sale of real estate was $275 million, which means there was a significant funding shortage of roughly $1.3 billion. And this excludes the dividend of $390 million in 2021.
TIKR.com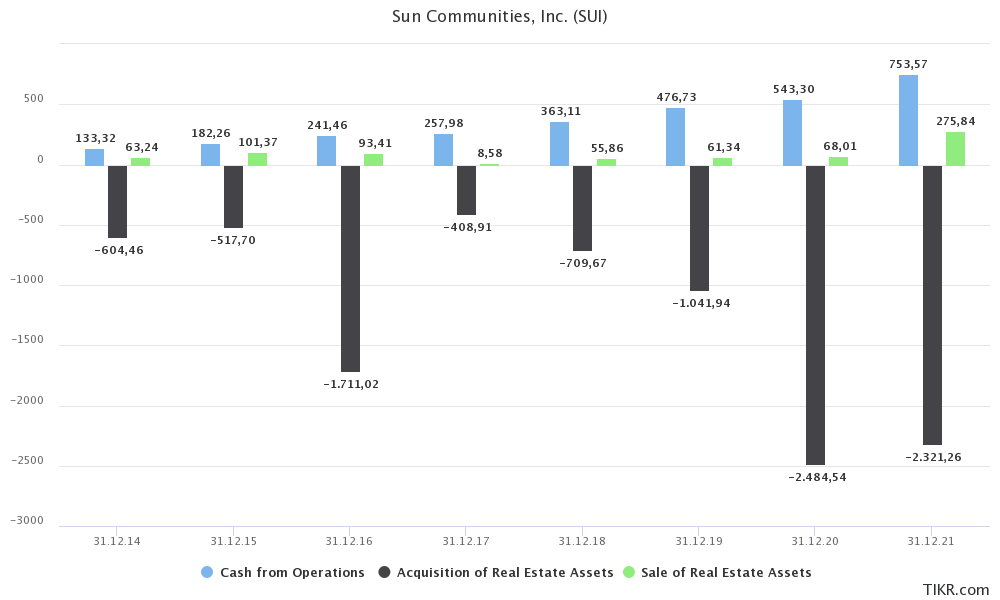
So, what did the company do? The company issued debt worth $5.0 billion and repaid debt worth $4.0 billion. That’s a billion in new debt. The company also issued stock worth $1.0 billion. This gives us $2.0 billion. As Elon Musk would say, “funding secured”.
The graph below shows the 10-year history of debt (issued and repaid) and issuance of common stock.
TIKR.com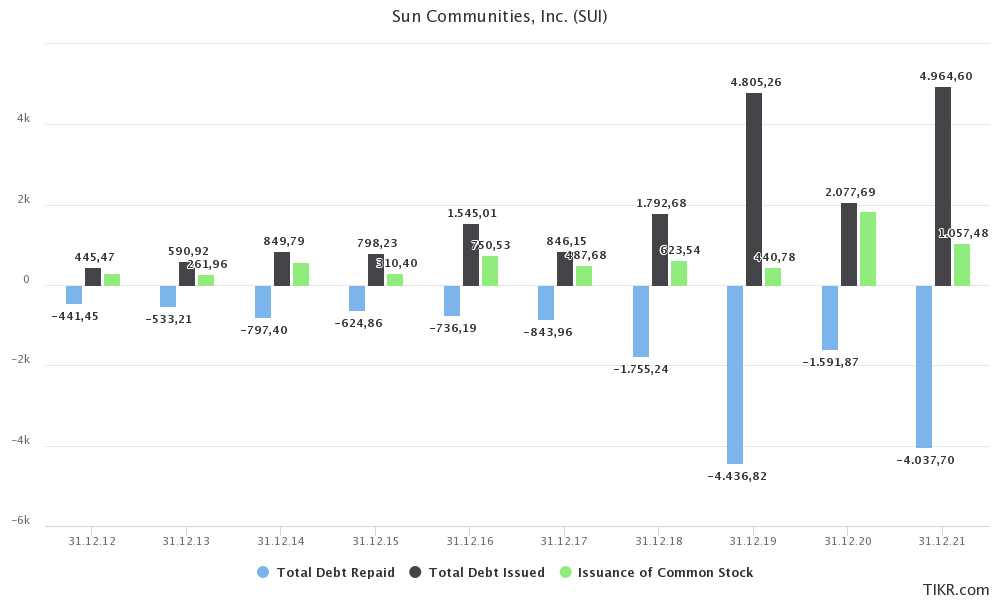
The company is issuing common stock quite aggressively.
Between 2017 and 2021, the number of common shares outstanding rose from 76.08 million to 112.58 million. That’s 8.2% growth per year.
However, during the past few years, FFO (funds from operations) has accelerated by 17.6% per year (starting in 2019), which means the value per share has increased as well – despite rapid dilution. Last year, the company did $6.16 in FFO per share. Core FFO was $6.51. In 2019, it was $4.92.
This is incredibly important and it shows that the company is generating value. If a company issues shares used to invest in unprofitable ventures, dilution results in devastating wealth destruction.
The only negative side of aggressive common equity funding is that a lower share price means that the company needs to sell more shares to get its desired funding target.
With that said, the company managed to maintain an incredibly healthy balance sheet. As of December 31, 2021, the company has $5.7 billion in debt. Slightly more than half of it is secured debt. The average yield is 3.0%, which is very favorable.
Net debt is also back to 5.7x EBITDA, which is down from 6.9x in 2020 when EBITDA was lower. Now it’s back in a range comparable to its peers.
Sun Communities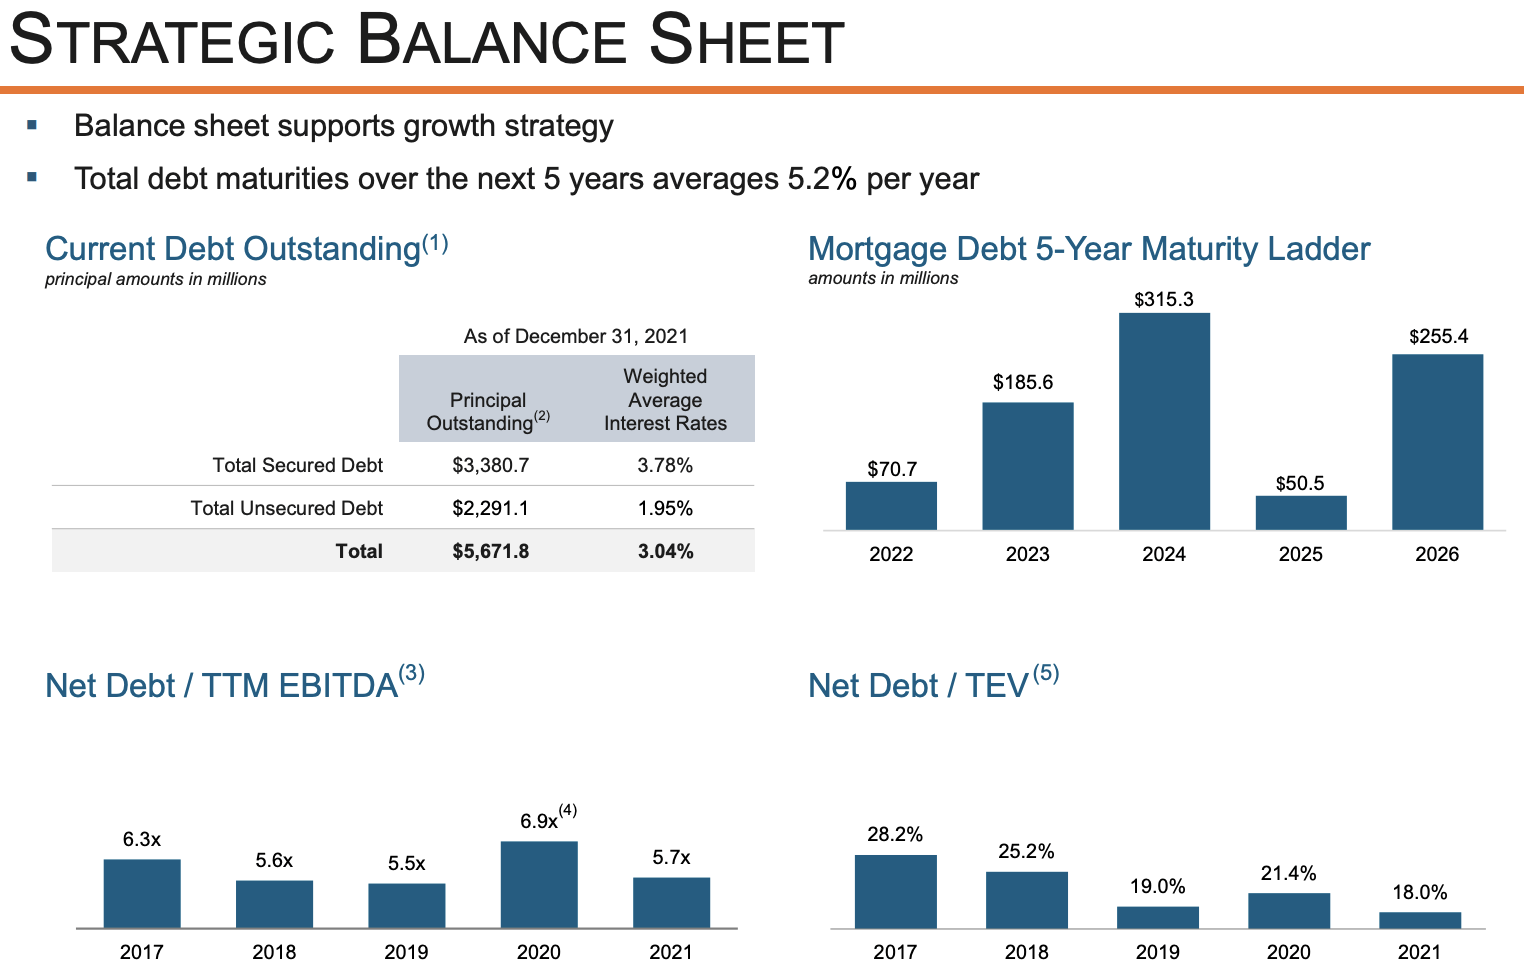
Now, the question is: are investors overpaying?
SUI Stock Valuation
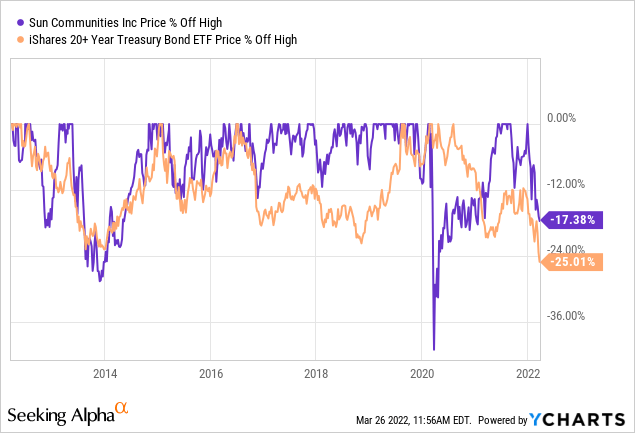
While I am writing this, we’re dealing with a SUI stock price of $173.8. That’s 17.4% below its all-time high, which makes it one of the bigger drawdowns of the past 10 years.
As the graph below shows, it’s caused by a significant increase in bond yields (lower bond prices). In this case, I’m comparing SUI to the iShares 20+ Year Treasury Bond ETF (TLT).
With that being said, the company has a market cap of roughly $20.7 billion. In 2021 the company did $759 million in core FFO, which implies a 27.3x multiple.
If we imply 15% growth for 2022, we end up with a forward multiple of 23.8x.
That’s not cheap, but it takes into account that there’s above-average growth in SUI, which makes sense. I would not have been bullish if the valuation using my 2022 estimate were above 26x FFO.
Takeaway
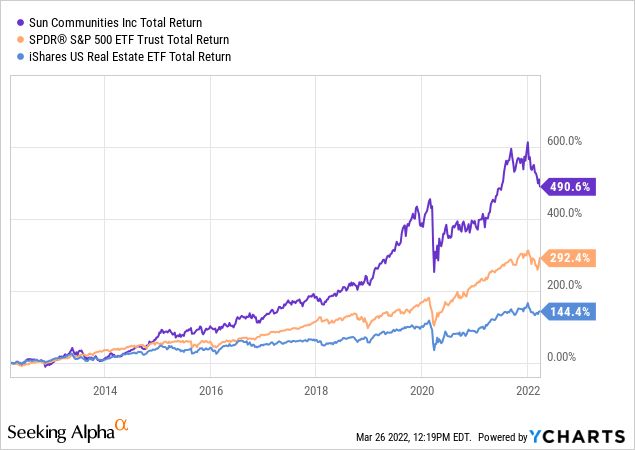
Sun Communities is one of the best stocks on the market, in my opinion. The company is yielding close to 2%, it has fantastic MH, RV, and marina assets and a model of aggressive growth that is bearing fruit. Not only does it come with double-digit NOI growth, but it also translates to outperforming total returns for investors.
SUI has “crushed” its REIT peers and the S&P 500 over the past 10 years (and prior to that) despite aggressively diluting common stock to fund operations. This is only possible because the company’s investments bear close to double-digit returns.
Going forward, I remain bullish on MH stocks as it’s much more attractive for a lot of people who are either retired, close to retirement, or able to work from – or anyone looking for affordable housing really.
The valuation isn’t cheap, and I doubt that will be the case as stocks like SUI don’t get really “cheap” unless the market tanks for whatever reasons.
Right now, the stock is in correction territory due to rising rates. I believe rates will rise until the market signals that the Federal Reserve is done hiking. I believe this will be in the second half of this year.
Until then, I think it’s appropriate to buy this stock on weakness like we’re currently witnessing.
(Dis)agree? Let me know in the comments!
Be the first to comment