

shaunl/E+ via Getty Images
In this article, I will examine the investment opportunities in Summit Materials, Inc. (NYSE:NYSE:SUM). There are expectations for good revenue and earnings growth moving forward, but is this potential upside a sufficient reason to invest, and is there any potential downside when considering Summit? In this article, I outline why I see potential here while noting there are some uncertainties that lead me to take a cautious stance on investments in Summit.
Summit Materials is a leading U.S. supplier of cement and other materials and products for the building and infrastructure industries. They have focused on vertical integration to enhance their economies of scale.
The Summit products have several markets driven by both public and private demand.
- Residential construction, with rising rents and a shortage of single-family housing.
- Non-residential construction, lifted by further on-shoring of manufacturing and ongoing demand for data centers and renewable energy projects.
- Public infrastructure – the State-level Transport budgets are seen to be strong and will ensure ongoing growth. The Federal Infrastructure bill is likely to provide a long-term inflow of funding and improved visibility.
Over the last ten years, Summit Materials have grown several parts of their business effectively, especially in their West business (Figure 1), which has shown relatively strong growth, along with their East business.
Figure 1. Summit Materials’ primary segments showing revenue growth (TIKR Terminal)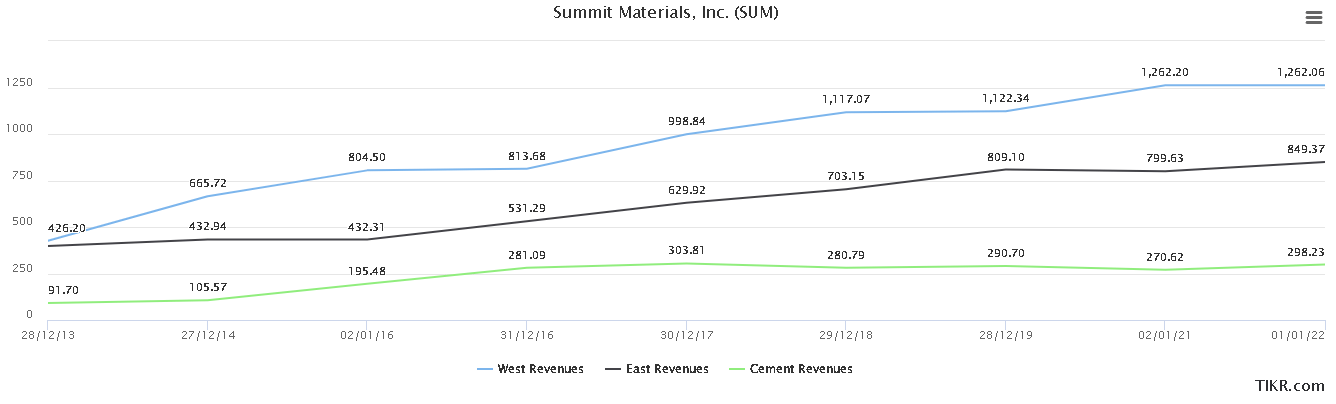
Profitability and outlook
Overall, vertical integration strategies can be competitively beneficial.
Turning to Stock Rover, I would say that Summit has been doing a reasonable job of managing its profitability. They have an ROIC of 14.2% which is reasonable, and about what I would expect with reference to their peers, and it seems to have been trending up over the last three years.
In contrast, the Operating Margin and Net Margin are 10.4 and 11.3%, respectively. These look reasonable, but the operating margin is 2.8% lower than Summit’s industry average while the net margin is only 1.6% above the industry average. Further, the gross margin has been declining. In 2016, it was 34.1%, and this has slipped to 27.3% today. From a more positive perspective, their operating margin has expanded slightly over the last three years.
Their overall Piotroski F-Score is reasonably high, at 7, showing a very healthy situation, especially with their current ratio and quick ratio being 3.2 and 2.3, respectively, at levels providing some security.
The 2Q 2022 results presentation shows drops in volume, driven by several divestitures, but strong pricing gains over aggregates (4.7%), cement (7.5%), ready-mix (9.7%), and asphalt (18.9%). The ability to pass pricing to customers should provide a buffer to margins in the next full-year results.
Peer comparisons
Given the primary segments for Summit Materials, I’ve opted for several firms focused on cement and aggregates.
- Cementos Pacasmayo S.A.A. (CPAC) for an international comparison
- CEMEX, S.A.B. de C.V. (CX) for an international comparison
- Martin Marietta Materials, Inc. (MLM)
- Smith-Midland Corporation (SMID)
- Summit Materials, Inc. (SUM)
- United States Lime & Minerals, Inc. (USLM)
- Vulcan Materials Company (VMC)
When making a comparison with three valuation measures (EV/EBITDA, Price / Sales, and Price / Earnings) against its peers, Summit appears to be near the middle of the pack. VMC and MLM appear to have more elevated valuations and I’ve made the highest two valuations in each column bold.
In contrast, if we look at the final row, we can get a sense of the peer groups and see that Summit’s slightly undervalued in terms of EV / EBITDA and P/E while is about the same as peers in terms of P/S.
Table 1. A comparison of Summit to key peers over valuation metrics
| Ticker | EV / EBITDA | Price / Sales (LTM) | Price / Earnings |
| CPAC | 4.9 | 0.8 | 9 |
| CX | 7.3 | 0.4 | 7.9 |
| EXP | 8.7 | 2.5 | 12.6 |
| MLM | 16.3 | 3.8 | 28.2 |
| SMID | 13.5 | 2.4 | 25.2 |
| SUM | 6.8 | 1.4 | 12.5 |
| USLM | 7.4 | 2.9 | 16.3 |
| VMC | 18.6 | 3.5 | 37.6 |
| Summary | 10.4 | 1.3 | 14.3 |
Source: Author, with data from Stock Rover
Risks and issues to monitor
There are two points of minor concern when looking at Summit Materials’ metrics and several key economic risks. First, two minor points of concern:
- Goodwill – I note that there is a high level of goodwill (26.7%) on the balance. This type of situation always concerns me, as they can manage it as an impairment charge at a later date.
- The overall sales growth has been choppy. While the 5Y average sales growth has been 6.6%, I note the 3Y average sales growth of 4.5% and the 1Y growth are lower, suggesting difficulty expanding sales. Most firms in the industry have had a tougher 1Y growth in sales that came in lower than the 5Y growth.
However, I see several sources of economic risk for my thesis for Summit Materials. Here, I provide some insight into the metrics that I will monitor.
First, the other major end-use for their cement segment is in infrastructural projects. While there is strong federal and state funding, the planning and budgeting are often years ahead. Inflationary pressures may impact Summit Materials’ margins, with little ability to improve pricing in their contracts. I would be watching margins as this would lead to a substantial deterioration in their margins.
Second, there are economic risks to sales in the primary end-use of their segments. A general economic downturn would reduce residential and non-residential construction and lower sales for materials destined for these segments. There is presently a backlog in residential housing and a reasonable demographic of buyers in their 30s and 40s (29% from ages 35 to 55) who should provide a solid demand for further housing and keep at least the residential construction market buoyant.
Neither of these risks should pose a long-term risk to the company, but would erode margins and result in substantially lower returns.
Valuation and investment opportunities
The FAST Graph’s Analyst Scorecard rates this as an 80% miss over two-year estimates at a 20% margin of error. It is clearly not an easy company to forecast; noting, also, the relatively short history of the company coupled with the impact of the COVID pandemic in 2020, meaning that there will have been fewer opportunities for good forecasts to emerge.
I note that there are 15 analysts’ targets on Finbox.io, ranging from $28 to $52. This relatively wide range, to the current price of $28.83, mirrors the difficulty noted above in terms of forecasting this company’s prospects. The average analyst target is 37.73, providing an approximate 30% upside from the current price.
This value is comparable to the value I reach with a 5Y Revenue-Exit discounted cash flow (“DCF”) model, providing a fair value of approximately $36.78. I’ve used revenue forecasts and cost of capital rates of 8.3% to 9.3%, with 8.8% in the final assessment and revenue exit multiples of 1.7x to 1.9x, with 1.8x as the final value. This outcome suggests just over 25% upside.
To assess the likely investment opportunity and the sensitivity to key factors, I like to use analyst estimates of earnings and examine returns that will occur if prices move to expected P/E ratios to these earnings. FAST Graphs provide a fast and convenient mechanism to calculate the likely outcomes.
Figure 2 shows the strong growth in the analysts’ expectations of earnings. If we use the P/E=Growth of 24.86 as the target ratio, shown as the orange line in the figure, we can take the consensus estimate earnings at the end of 2024 and calculate the returns if prices maintain the 24.86x multiple to these earnings. It gives us a potential 88% total rate of return or an annualized rate of return of 32%.
Figure 2. Summit Materials’ analysts’ estimates of earnings and the likely returns from P/E normalization (FAST Graphs)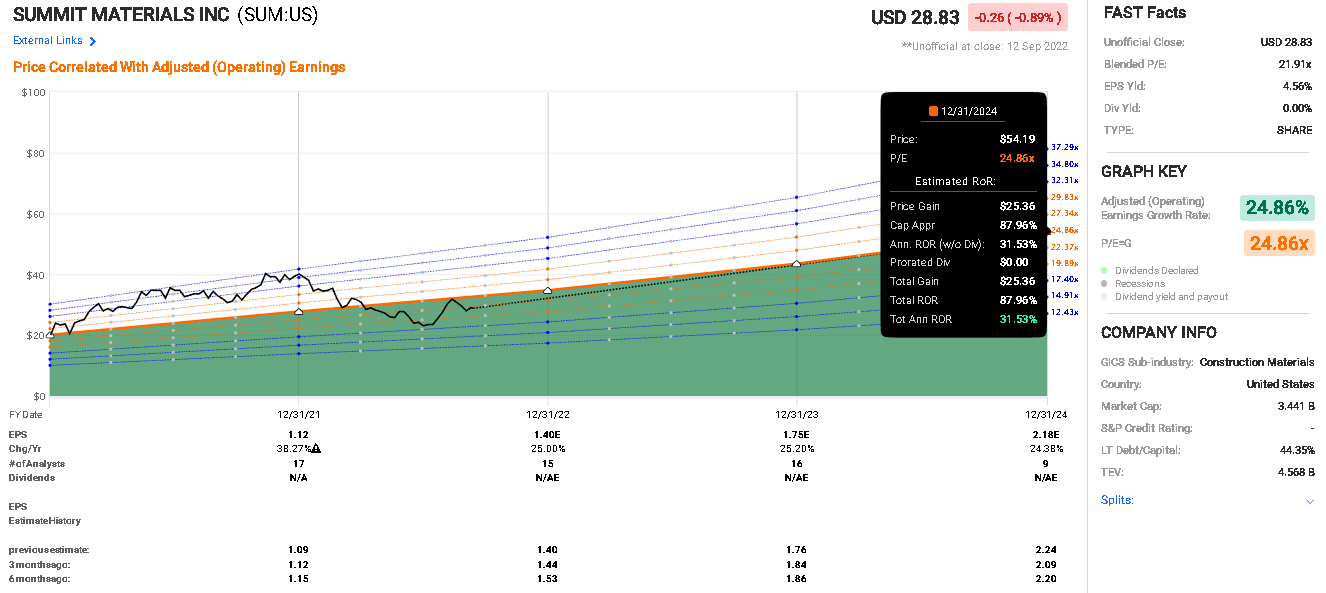
However, as noted, the analysts have difficulty forecasting the earnings for the company. Using Finbox.io, I extracted the lowest analyst estimates for EPS until 2024 and re-calculated returns. With these very conservative estimates, if Summit can maintain a P/E ratio of 22.5x (close to the P/E=G of 24.86x noted in Figure 2), then the total rate of return at the close of 2024 would be 20%, or an 8.3% annualized rate of return. Note that this conservative estimate allows for the prices to remain at a strong multiple to earnings; if the multiple drops, then the returns will be lower still.
Thesis
Summit Materials uses a vertical integration approach. They have maintained a strong financial position but appears to be managing moderate profitability metrics. Summit is reasonably valued against their peers.
While Summit faces strong potential EPS growth to 2024, there is uncertainty regarding the opportunity to benefit from this growth. Analysts seem to have had difficulty providing reliable forecasts of earnings. Taking conservative estimates and P/E multiples, there appears to be some upside here. However, there is no dividend as a cushion for me as an investor while I wait for the upside to materialize. Summit is also not trading from a relatively low valuation. So, while I consider the potential upside to be present, I consider it somewhat fragile.
For these reasons, I rate Summit Materials as a tentative Buy for the time being. I will certainly return in the future and cover Summit again and reassess if the situation changes.
Thank you for taking the time to read this analysis. Let me know if you have questions or if there are any other companies you think I should look at.
Be the first to comment